Dashboard (OLD)
- Click on the Dashboard in the left menu to open the Schedule Dashboard screen.
- Schedule Dashboard screen includes a chart and a detailed data table that provides statistics on each collection run in the triggered schedule.
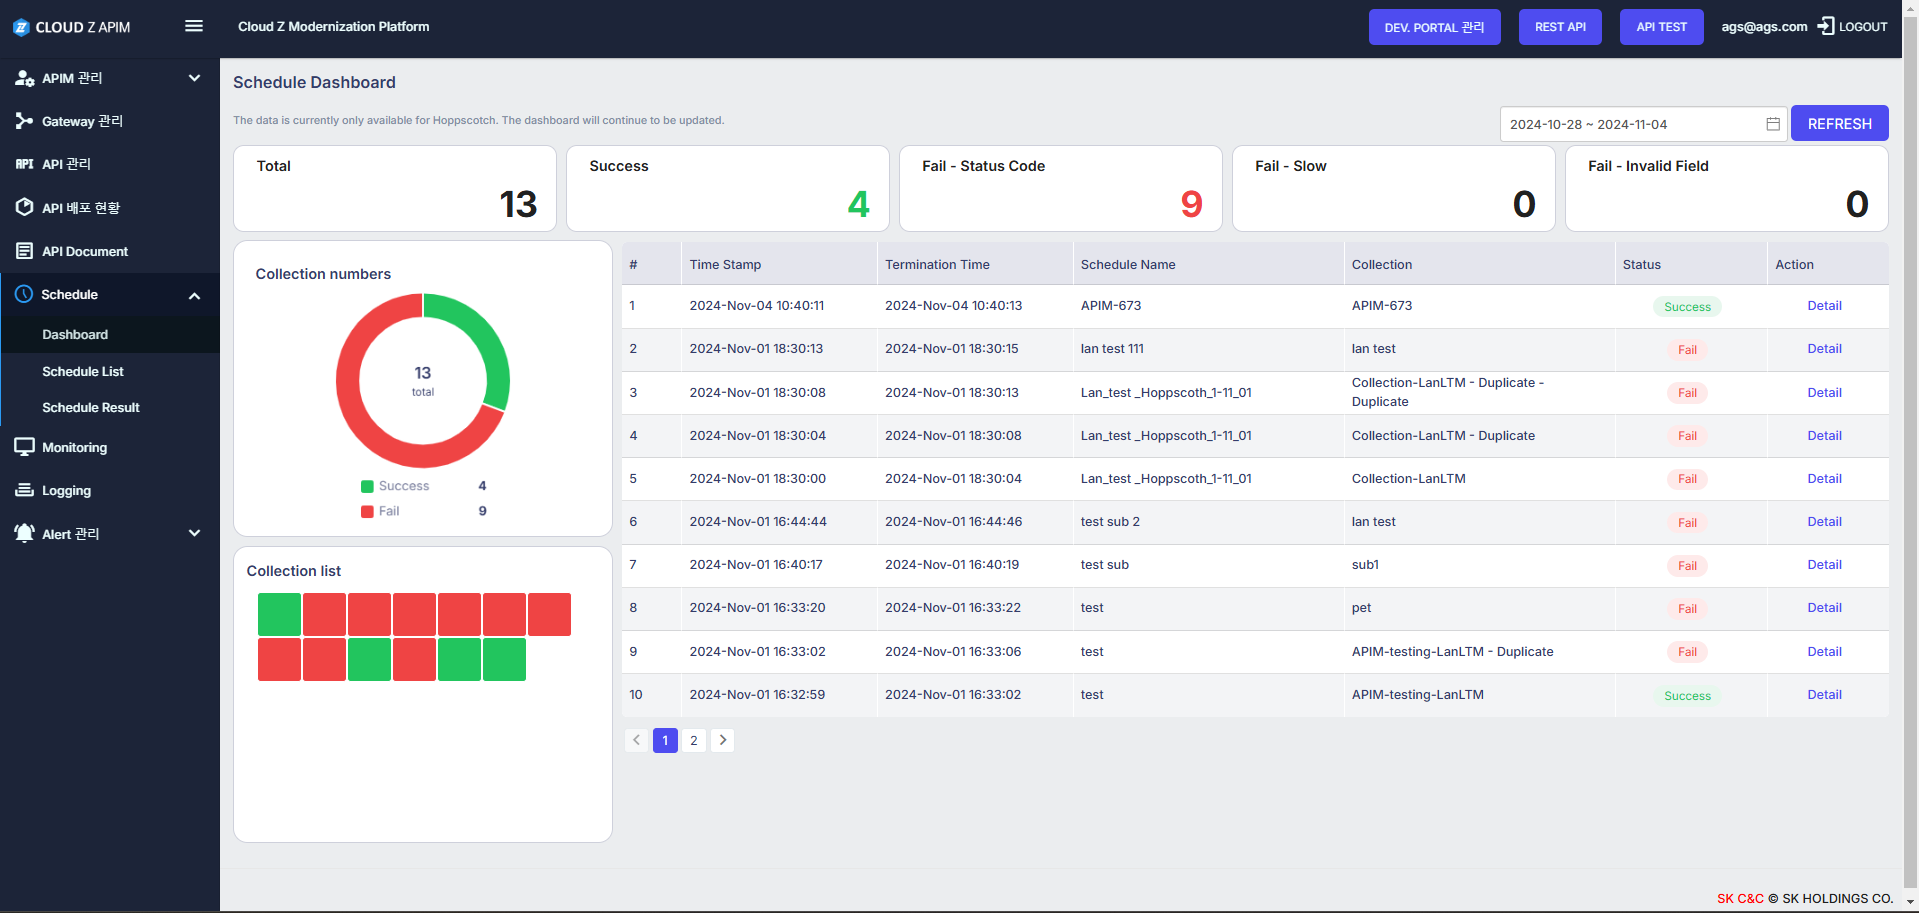
image.png
1. Schedule Dashboard screen
1.1. Filter
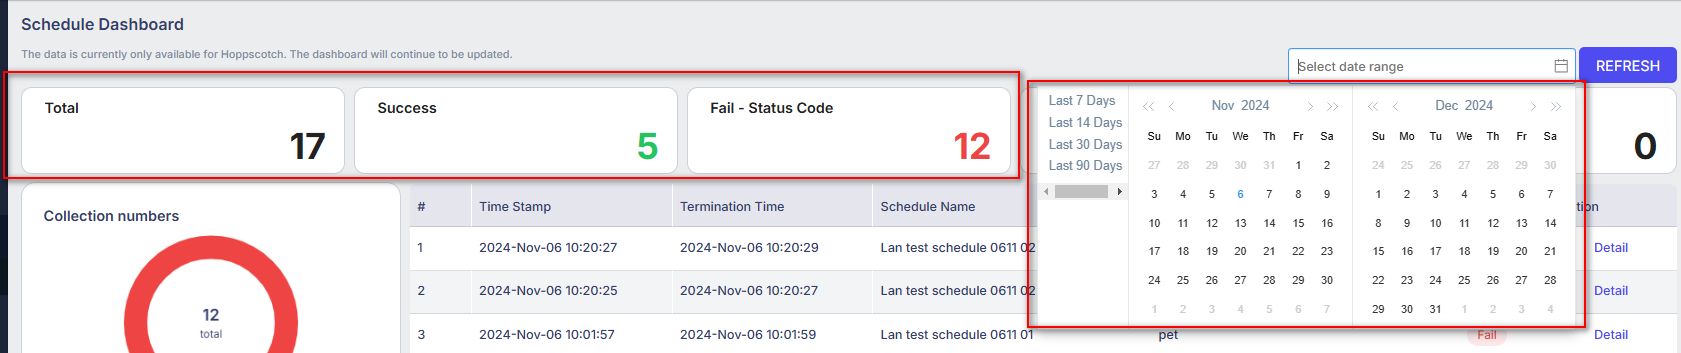
image.png
- Filter types:
- Filter by status:
- The number in each block represents the quantity of collections with the corresponding status.
- Click on the status block: Table list will display only the records with the corresponding status.
- Filter by date range.
- Filter by “Last Days.”
- Click the “REFRESH” button to clear all filters on the screen and display all records in the collection.
1.2. Table collection
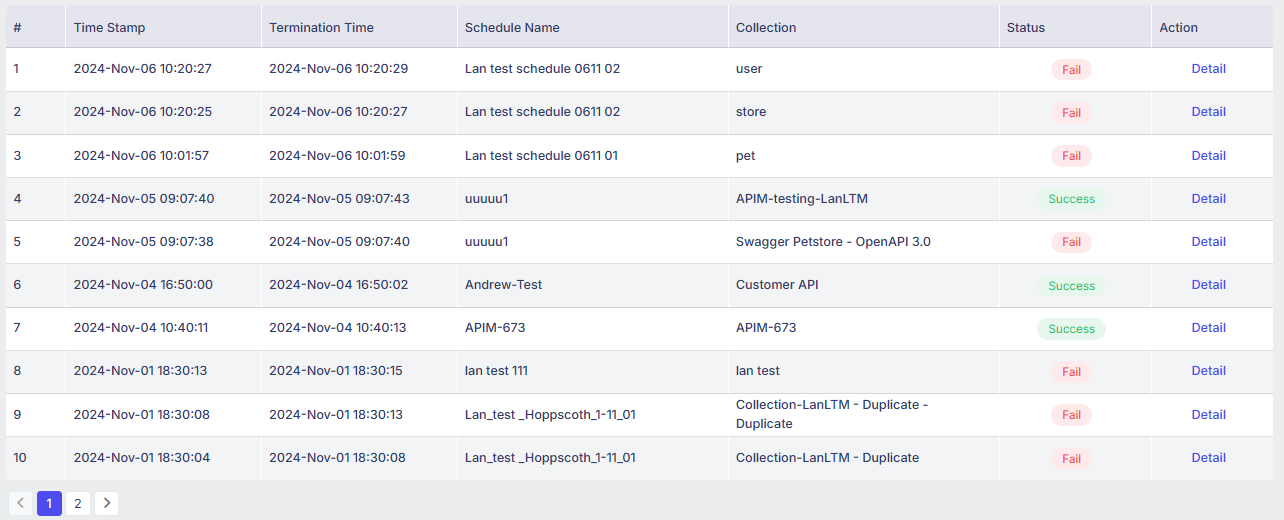
image.png
| Column | Description |
|---|---|
| # | Number |
| Time Stamp | Timestamp for triggering the schedule |
| Termination Time | Timestamp for schedule completion |
| Schedule Name | Name of the schedule |
| Collection | Collection name |
| Status | Status of the collection |
| Action | Click on the “Detail” button to open the “detail collection” popup |
1.3. Dashboard
1.3.1. Collection numbers Dashboard
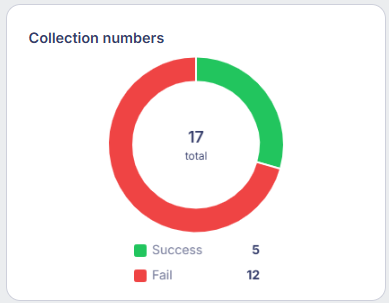
image.png
- This dashboard show percent of status.
- Click the status to select data display on the dashboard.
1.3.2. Collection list Dashboard

image.png
- Each square represents a collection.
- Red indicates a collection with a “Success” status, and blue indicates a collection with a “Fail” status.
- Hover over each square to display a tooltip with the collection’s name.
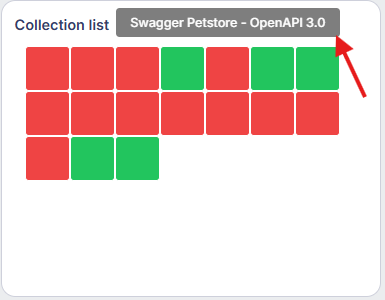
image.png
- Click on each square to focus on that collection in the list table beside it.
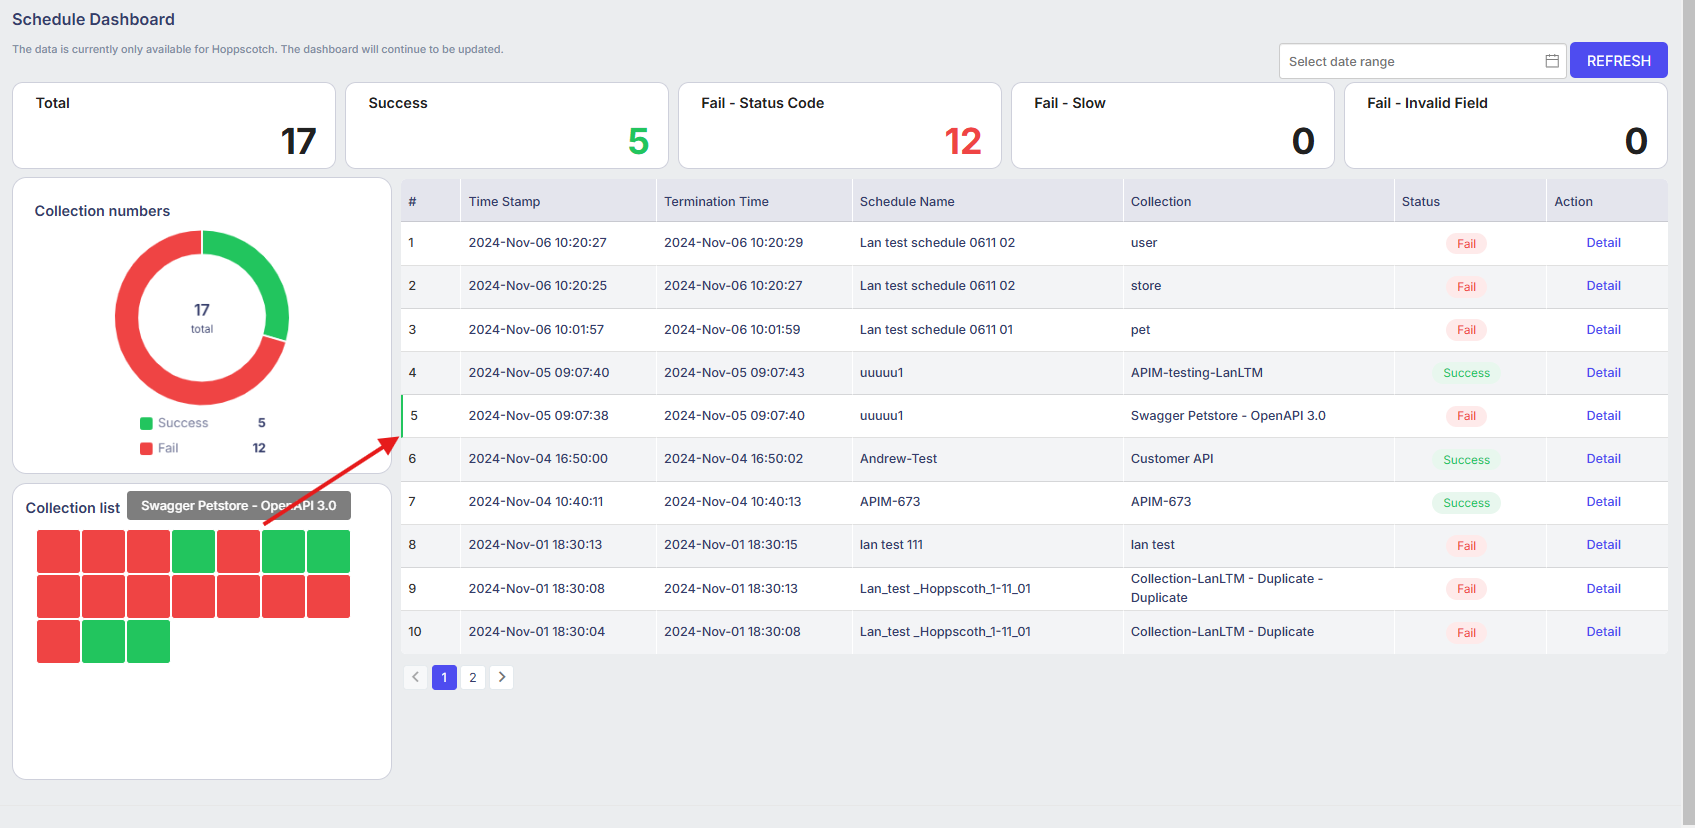
image.png
2. Detail popup
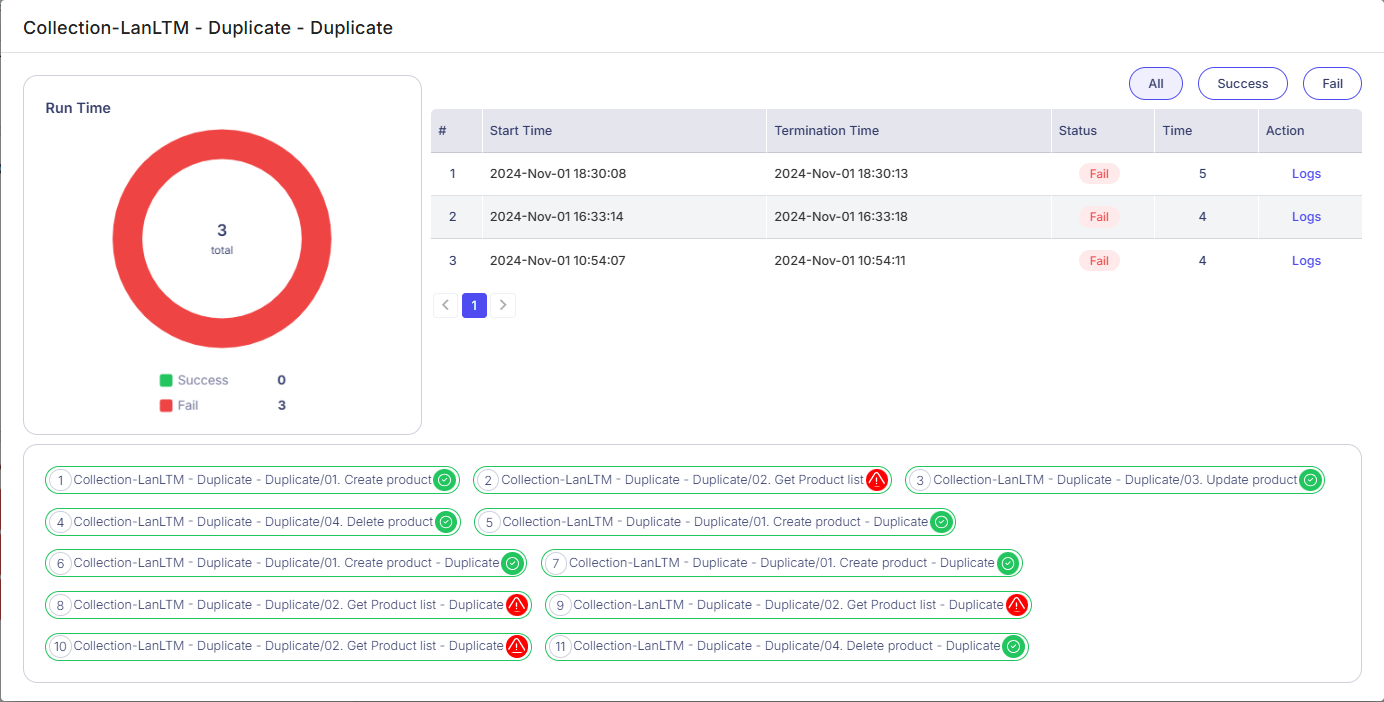
image.png
2.1. Run Time dashboard
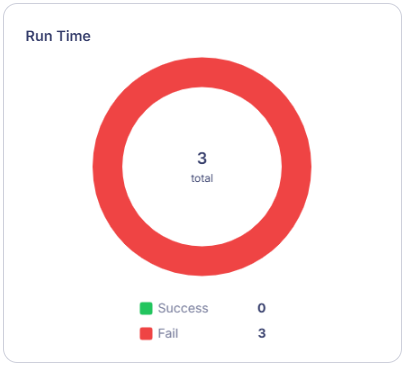
image.png
- This dashboard shows the percentage of statuses for all runtimes when this collection is selected.
- Click the status to select data display on the dashboard.
2.2. Table of collection runtimes
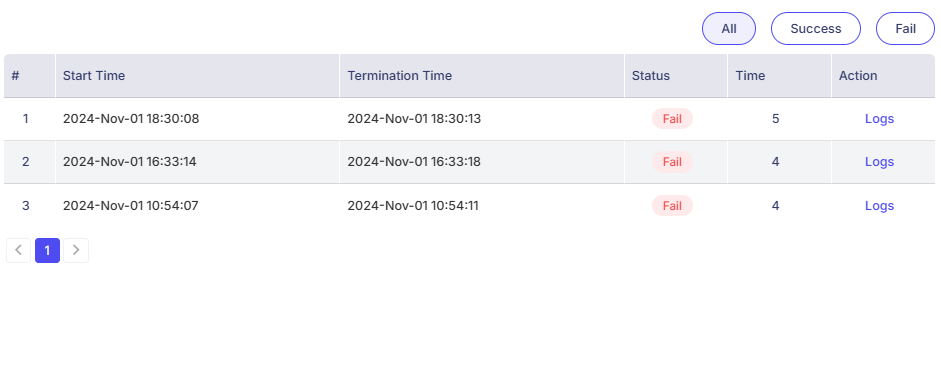
image.png
| Item | Description |
|---|---|
| # | Number |
| Start Time | Timestamp for triggering the completion |
| Termination Time | Timestamp for schedule completion |
| Status | Status of this collection in this runtime. |
| Time | Time to complete this collection |
| Action | Click the “Logs” button to display the list of APIs for this collection below. |
| 3 button filter: | |
| “All”, “Success”, “Fail” | Click on the button to filter data corresponding. |
2.3. List of APIs for the collection
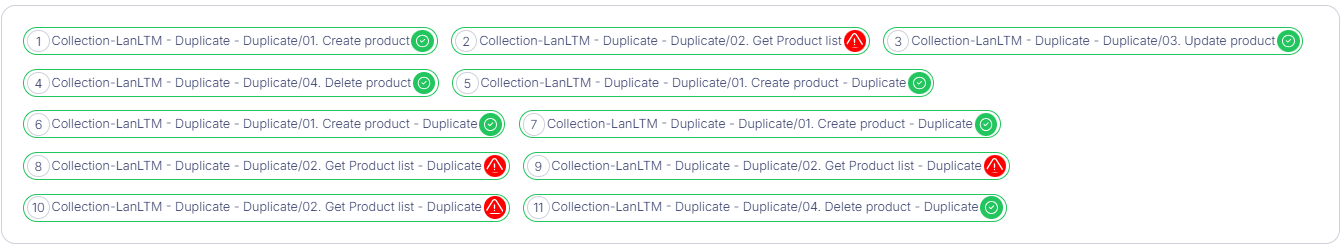
image.png
- This list is displayed in the order of the APIs in the collection, numbered sequentially.
- An API with a green icon indicates a “Pass” status.
- An API with a red icon indicates a “Fail” status.