MCP Management
🔧 MCP Management
Overview
Path: Left Sidebar → MCP Management
Menu Type: Group Menu (contains submenus)
MCP (Model Context Protocol) Management provides functions to manage MCP servers and tools used for integration with LLMs. By registering and managing MCP servers and tools, this module enables seamless integration with AI applications.
How to Access
- Click the MCP Management menu in the left sidebar to expand its submenus.
- Select the desired function from the expanded submenu list.
💡 Note: The MCP Management menu is a group menu, so clicking it will toggle the expansion or collapse of its submenus.
Submenu Structure
When clicking the MCP Management menu, the following submenus are displayed:
- Tool Management – Manage and view the MCP Tool list
- MCP Server Management – Manage MCP server instances
- Virtual MCP Server Management – Configure virtual MCP server environments
- Metrics – View MCP-related performance metrics and monitoring data
Tool Management
Path: Left Sidebar → MCP Management → Tool Management
Feature Overview
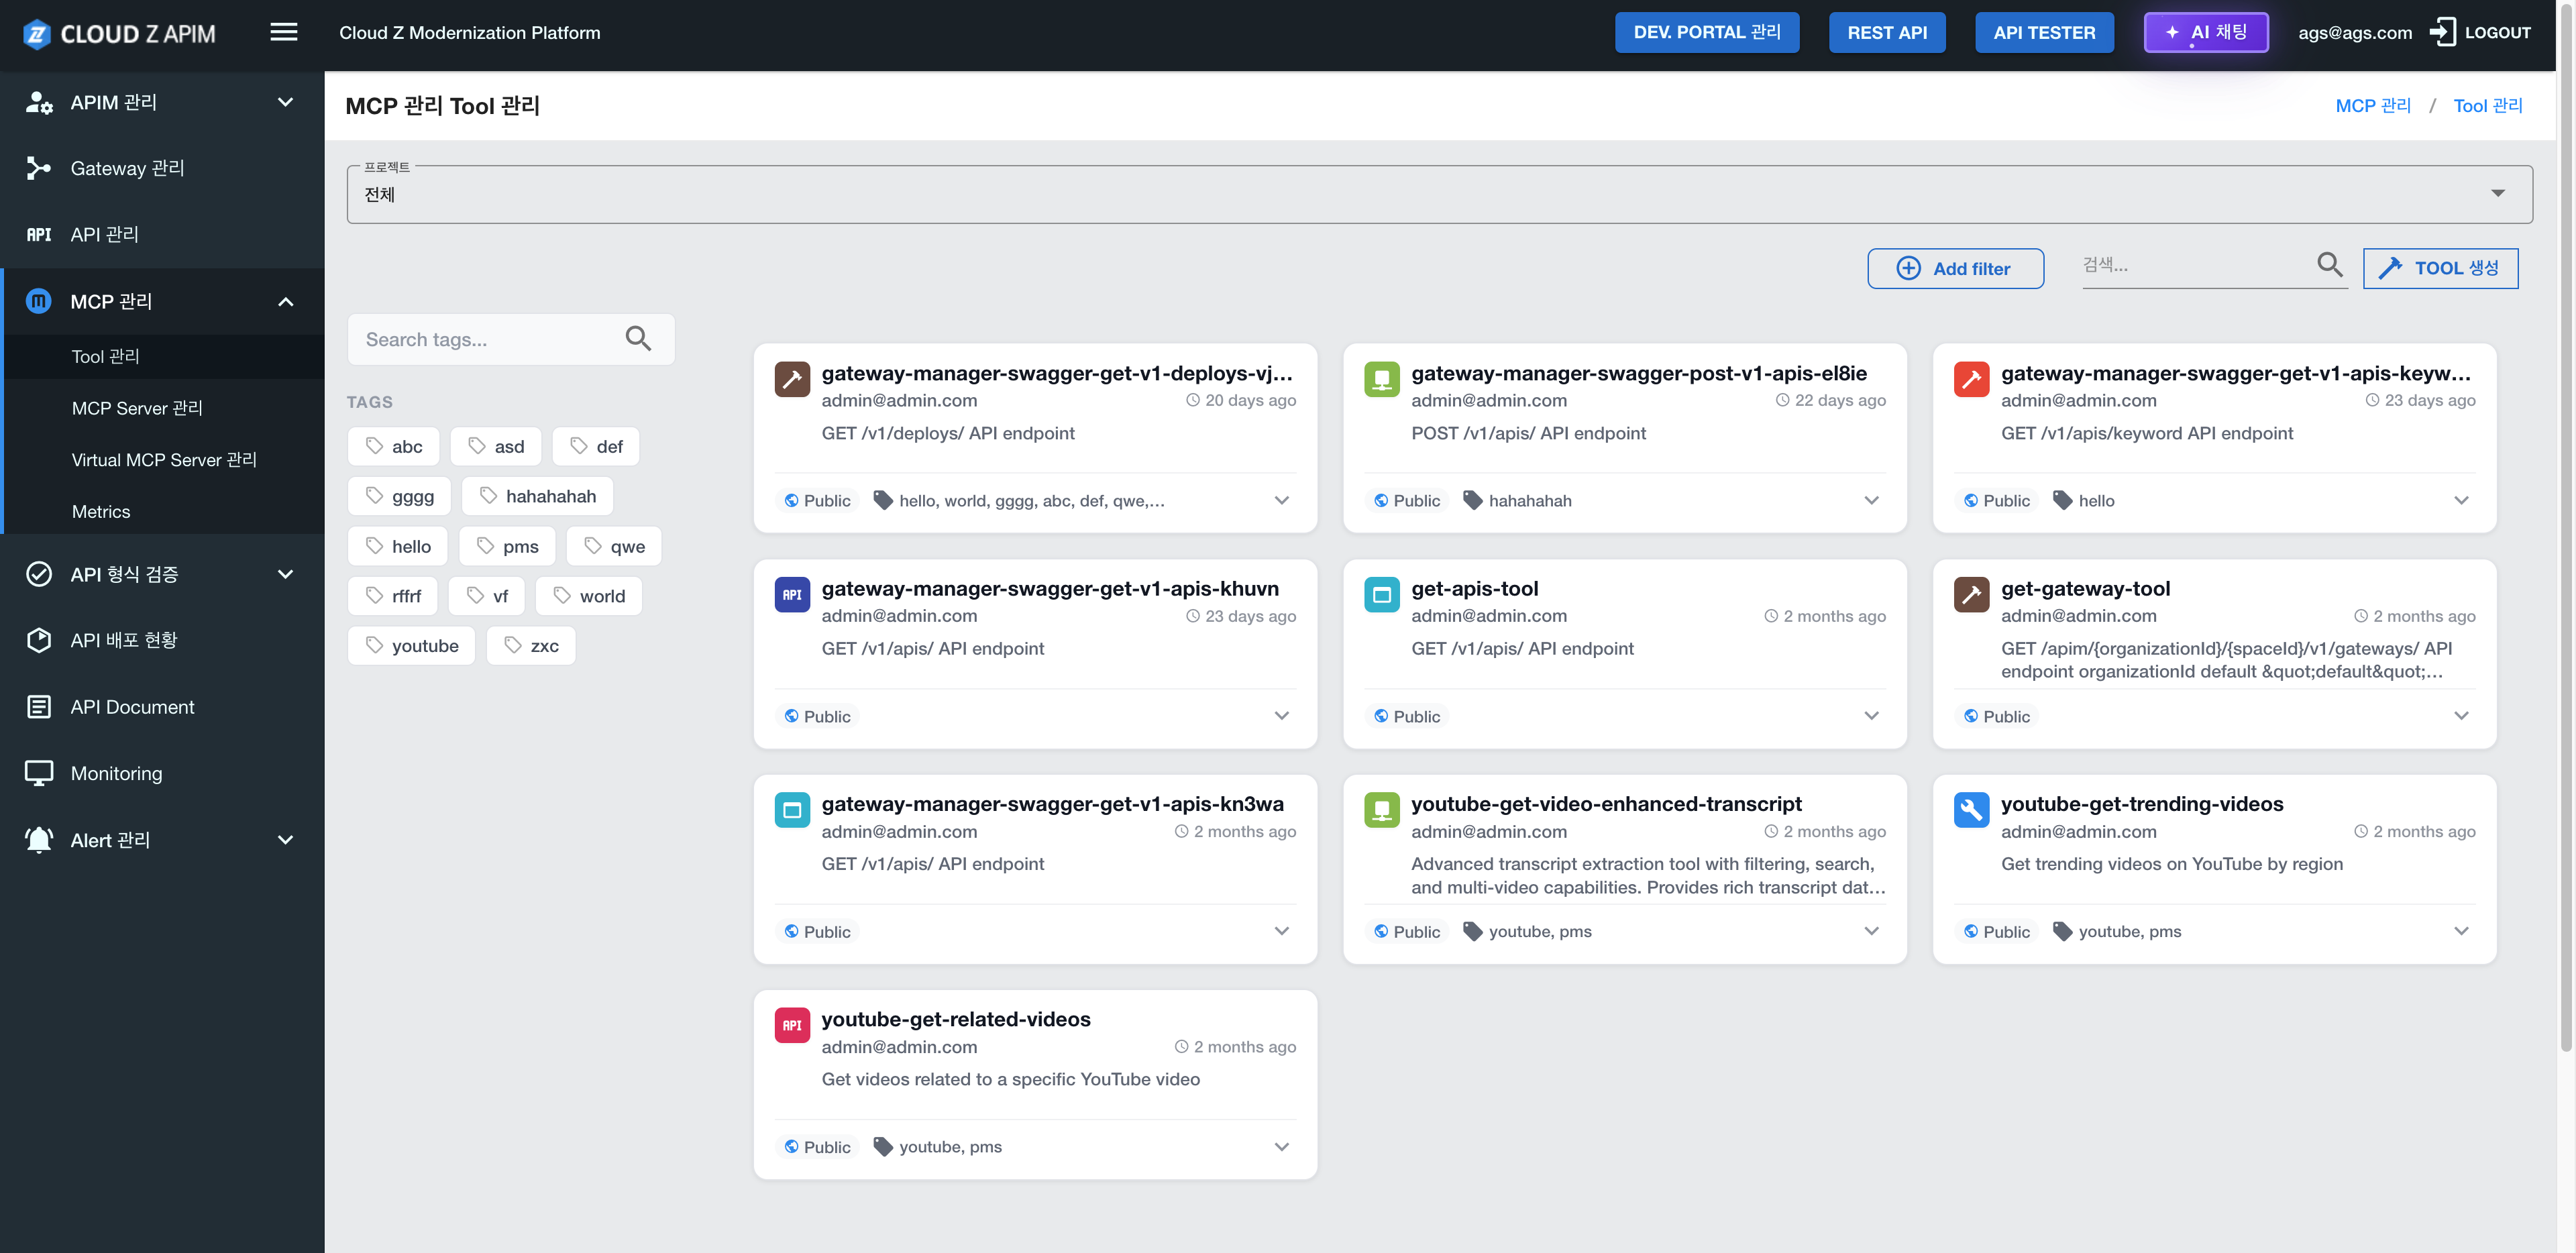
Tool Management page allows users to browse the list of MCP Tools, review each Tool’s Input Schema, and create or manage MCP Tools
Page Structure
1. Tool List SectionRegistered MCP Tools are displayed in a card-based layout.
Tool Card Information:
- Tool Name: Name of the Tool and its associated icon
- Creator Information: Email address of the user who created the Tool
- Creation Time: Relative time since the Tool was created (e.g., "2 hours ago")
- Description: Overview of the Tool’s purpose and functions
- Visibility Status: Indicates whether the Tool is Public or Private
- Tags: List of tags associated with the Tool
- Click the Create Tool or Add Tool button to register a new MCP Tool.
Key Features
1. View Tool List- Browse all registered MCP Tools in a card layout
- Quickly review each Tool’s basic information and visibility status
- Click the Tool card to view the tool’s detailed information.
- Input Schema: Input parameter schema for the Tool
- Description: Detailed explanation of the Tool’s functionality and usage
- Register a new MCP Tool for use in AI applications.
- Users can specify: Tool name, Description, Input Schema, Tags
4. Edit & Delete Tool
- Modify the information of an existing Tool or Delete a Tool if it is no longer needed
- Change the Tool’s Public/Private visibility settings
- Search Tools by name, tags, or creator
- Filter Tools by visibility (Public / Private)
How to Use
- Click the “MCP Management” menu in the left sidebar.
- Select ”Tool Management” from the submenu.
- Browse the Tool list to find the Tool you want.
- Click a Tool card to view detailed information.
- Click the Create Tool button to register a new Tool.
Usage Examples
Example 1: Checking the Tool List
- Navigate to MCP Management > Tool Management
- Review the list of registered Tools
- Check each Tool’s name, creator, description, and tags
Example 2: Viewing Tool Details
- Click the desired Tool card in the Tool list
- Review the Tool’s Input Schema
- Check the detailed description and usage instructions
Example 3: Registering a New Tool
- Click the Create Tool button
- Enter the Tool name, description, and Input Schema
- Configure tags and visibility settings
- Save to complete the Tool registration
Cautions
- ⚠️ The Tool’s Input Schema must be defined in JSON format
- ⚠️ Public Tools can be used by all users, while Private Tools are accessible only by the creator
- ⚠️ Deleting a Tool may break all connections that depend on that Tool
MCP Server Management
Path: Left Sidebar → MCP Management → MCP Server Management
Feature Overview
The MCP Server Management page allows users to monitor WebSocket/SSE connection status with external MCP-compatible servers, as well as register and manage MCP server endpoints.
Page Structure
1. Server List SectionRegistered MCP servers are displayed in a table or card layout
Server Information:
- Server Name: Name of the MCP server
- Endpoint URL: WebSocket or SSE endpoint address
- Connection Status: Connected / Disconnected / Error
- Connection Type: WebSocket or SSE (Server-Sent Events)
- Last Connected Time: Timestamp of the last successful connection
- Actions: Connection test, settings modification, delete, etc.
- Click Add Server to register a new MCP server.
Key Features
1. View Server List- Check the list of all registered MCP servers
- Review endpoint URLs and connection types
- View server connection status in real time
- Connection status updates automatically when changes occur
- Registers a new MCP server endpoint.
- Configures server details such as the server name, endpoint URL, and connection type (WebSocket or SSE).
- Test connectivity with a registered server
- Review error messages when the connection test fails
- Update server configuration or Restart server connections
- Delete servers no longer in use
How to Use
- Click the ”MCP Management” menu in the left sidebar
- Select ”MCP Server Management” from the submenu
- Review the connection status of registered servers
- Click Add Server to register a new server
- Enter server information:
- Server
- URL (e.g., ws://example.com/mcp or https://example.com/mcp/sse)
- Connection Type (WebSocket or SSE)
- Click the Test Connection button to verify the connection
- Save to complete the server registration
Usage Examples
Example 1: Checking the Server List
- Navigate to MCP Management > MCP Server Management
- Review the list of registered servers
- Check each server’s connection status (Connected / Disconnected)
Example 2: Registering a New Server
- Click the Add Server button
- Enter a server name (e.g., "My MCP Server")
- Enter the endpoint URL (e.g., wss://mcp.example.com/ws)
- Select a connection type (WebSocket or SSE)
- Use the Test Connection button to verify connectivity
- Save to complete the registration
Example 3: Monitoring Server Status
- Review the connection status in the server list
- Click the Test Connection button for servers showing Disconnected
- Review error messages and troubleshoot issues
Cautions
- ⚠️ MCP servers must support WebSocket or SSE protocols
- ⚠️ Endpoint URLs must be valid and accessible
- ⚠️ Tools cannot be used if the server connection is lost
- ⚠️ Deleting a server removes all associated Tool connections
Virtual MCP Server Management
Path: Left Sidebar → MCP Management → Virtual MCP Server Management
Feature Overview
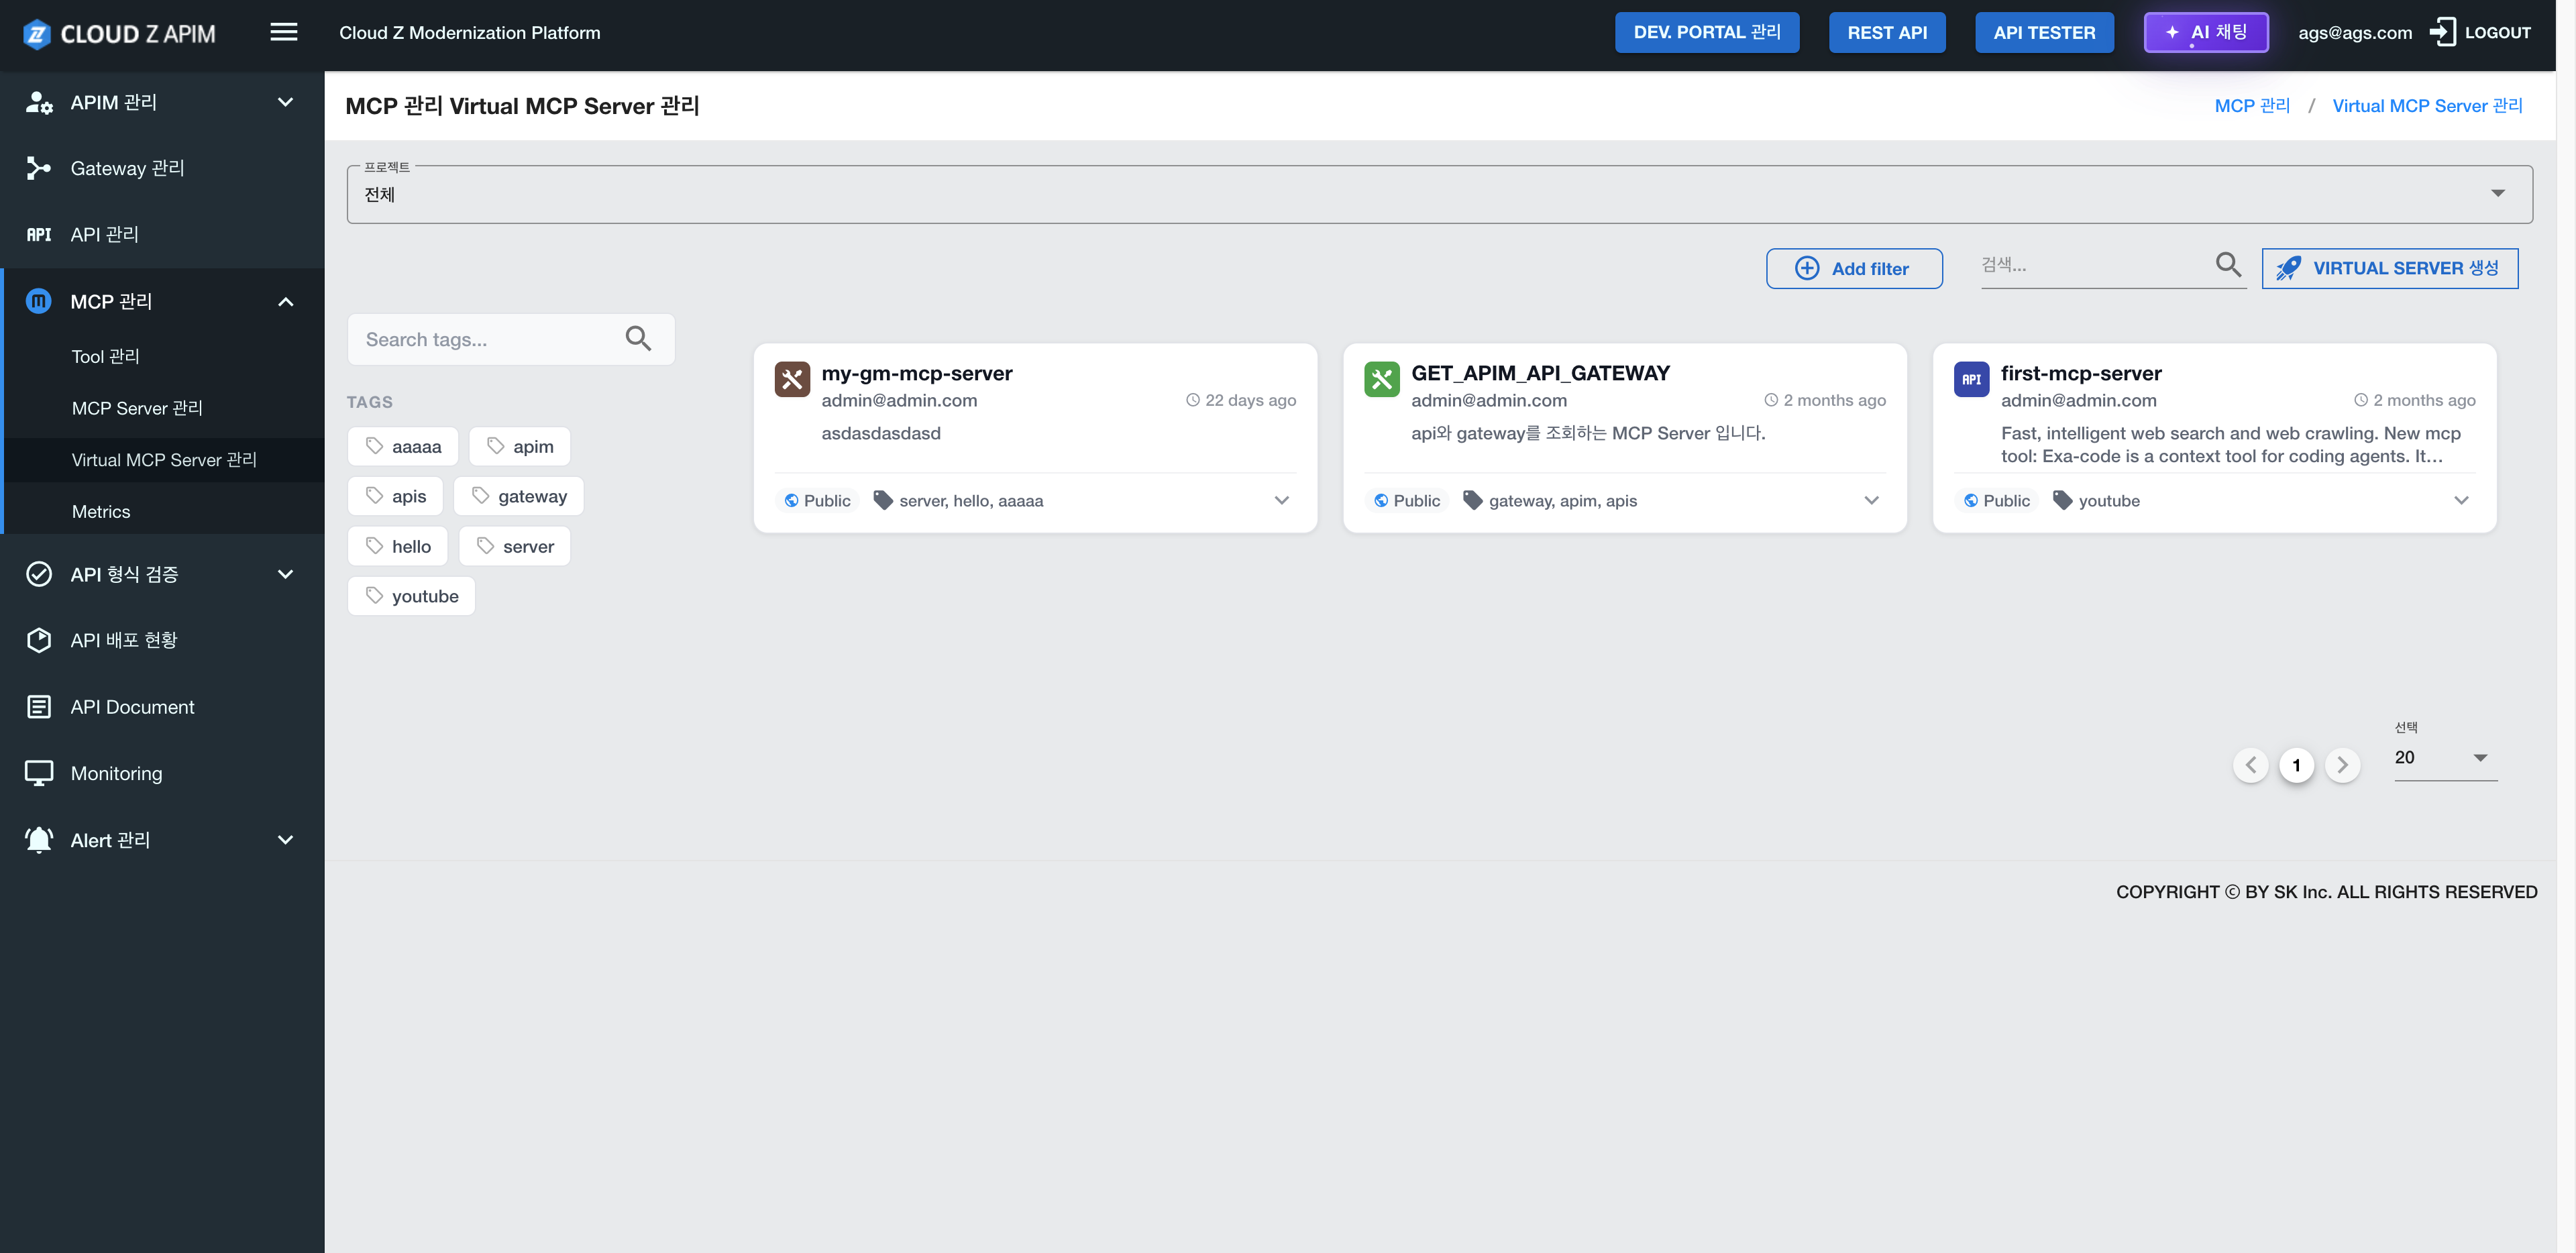
Virtual MCP Server Management page allows users to configure and manage virtual MCP server environments. These virtual servers can be used to simulate MCP server in development or testing environment.
Page Structure
1. Virtual Server List Section
Displays a list of created virtual MCP servers.
Virtual Server Information:
- Server Name: Name of the virtual server
- Status: Running / Stopped / Paused
- Creation Time: Timestamp when the virtual server was created
- Configuration Info: Details about the virtual server’s configuration
- Actions: Start, stop, modify settings, delete, etc.
- Click Create Virtual Server to add a new virtual MCP server.
Key Features
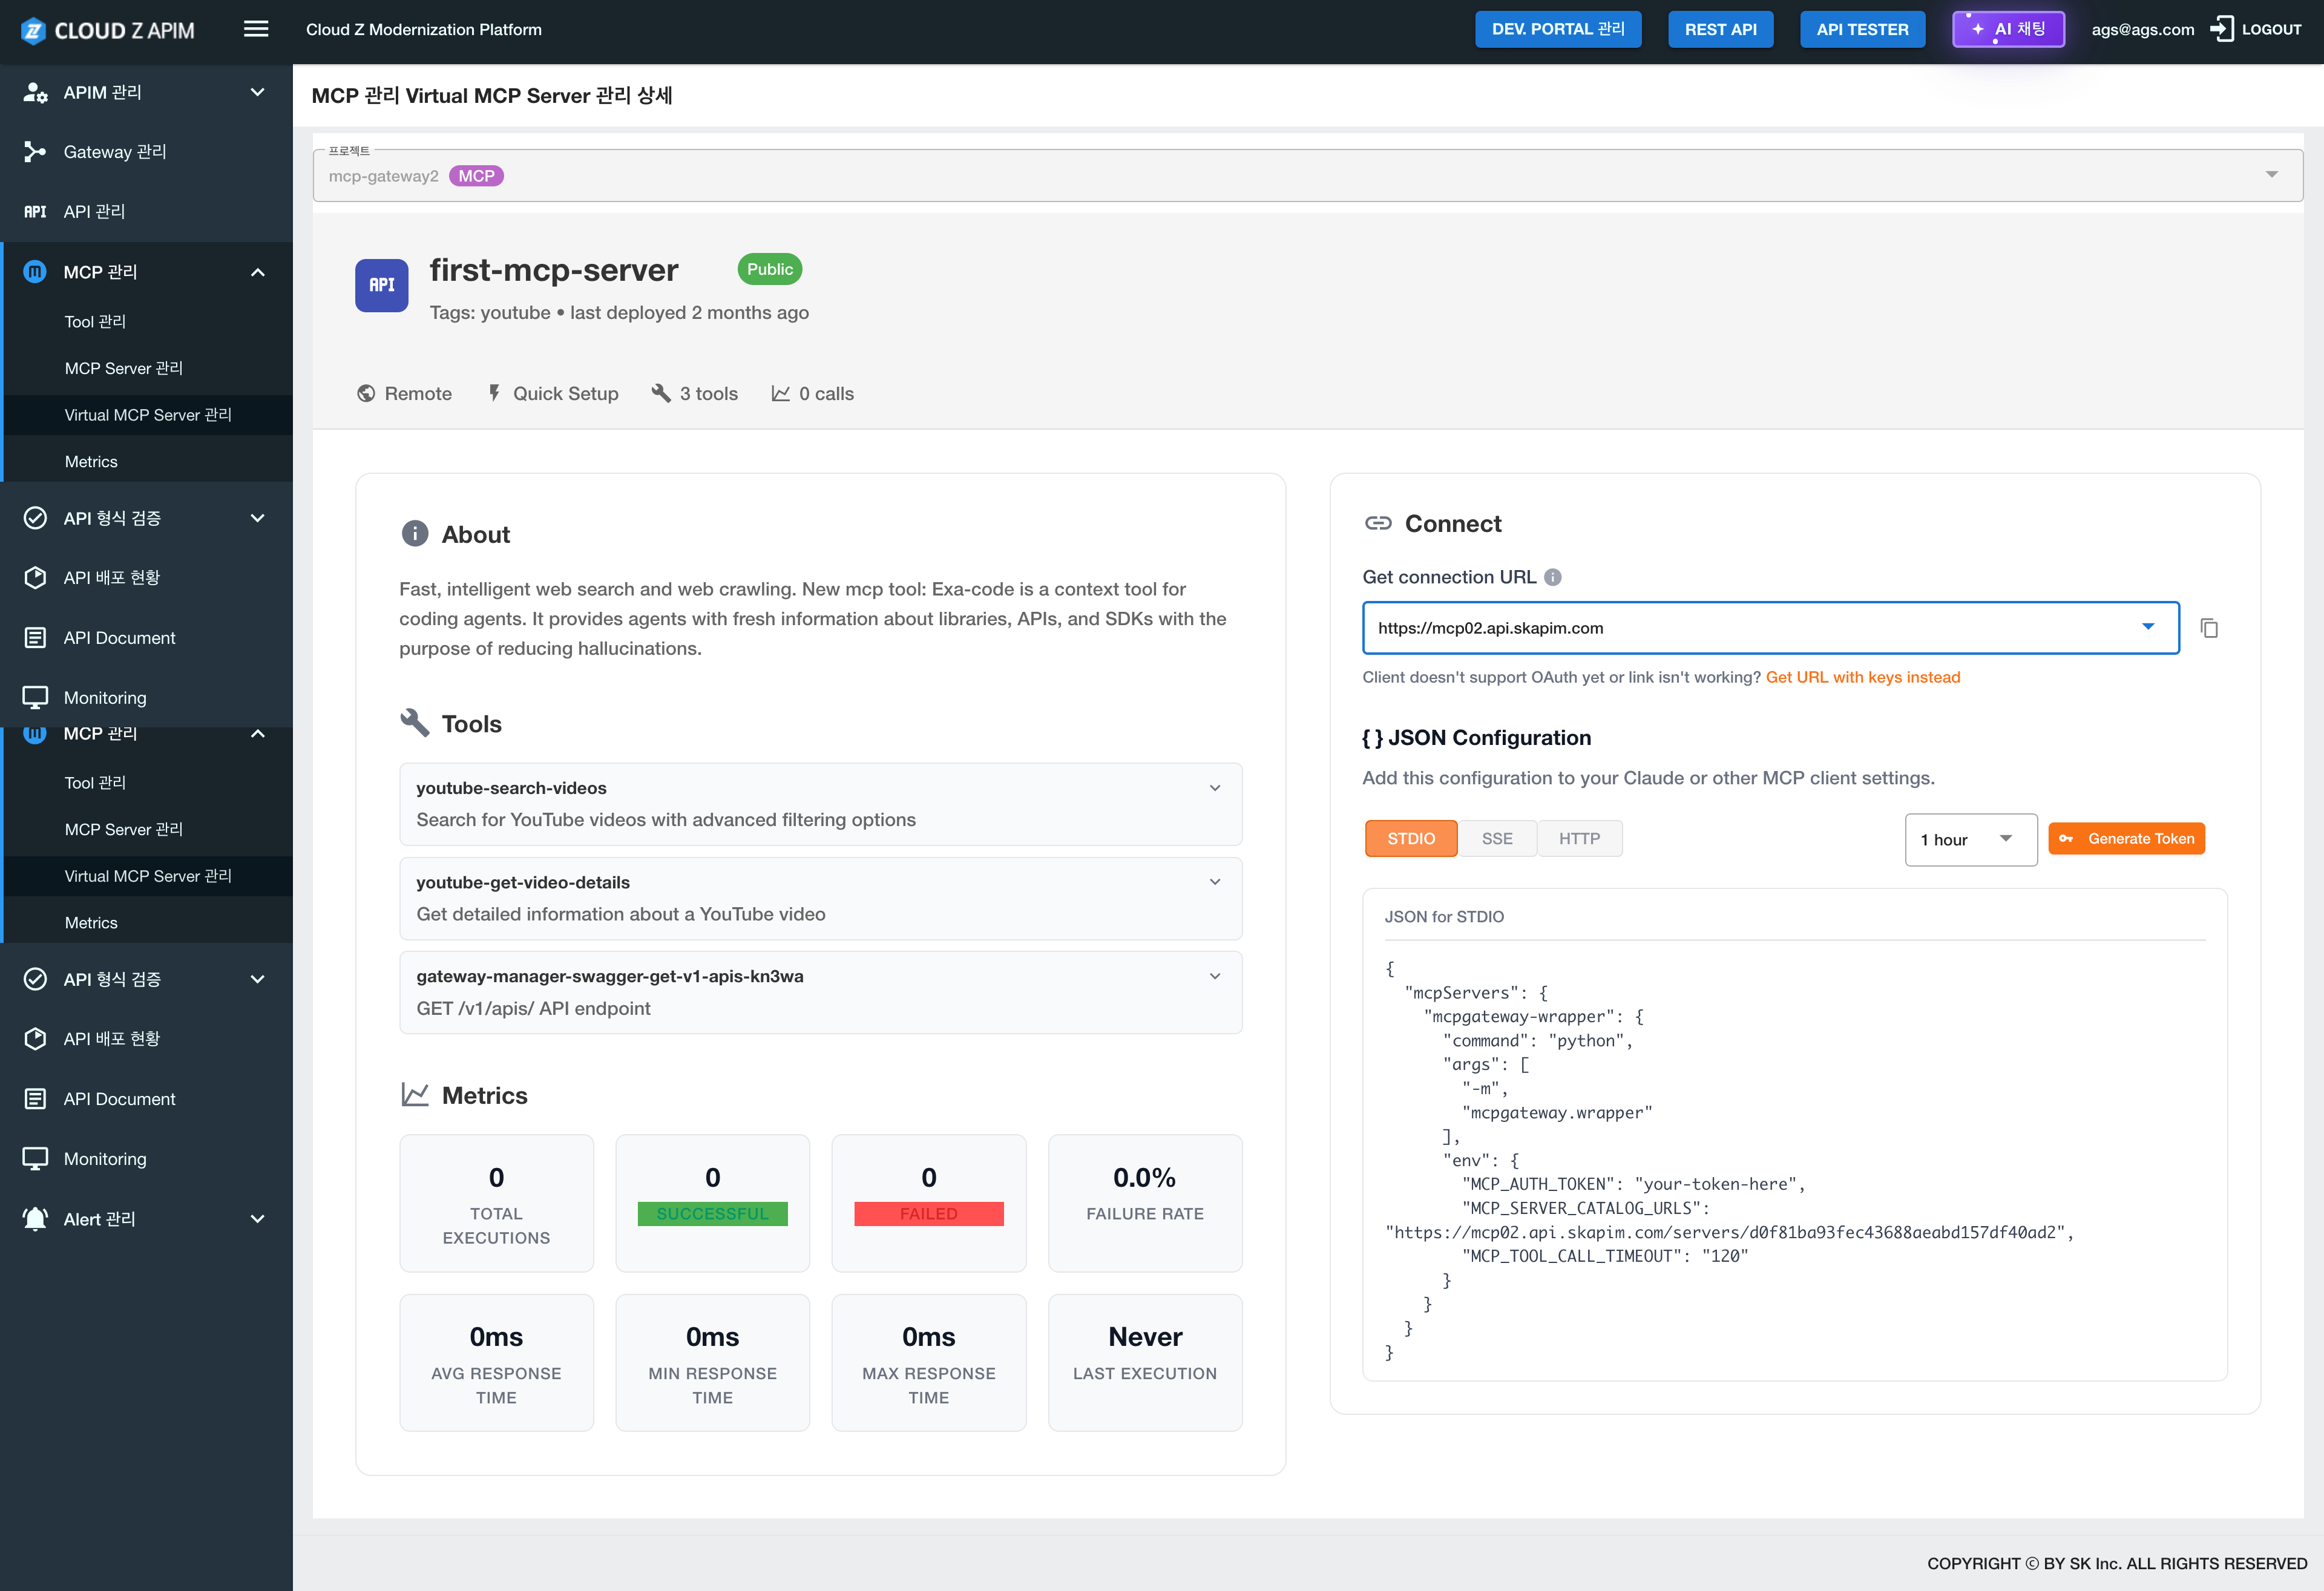
1. View Virtual Server List- Check all created virtual MCP servers and their current status
- Create a new virtual MCP server
- Configure server name, settings, environment variables, and more
- Start or stop virtual MCP servers
- Control the server’s status as needed
- Change configuration settings
- Adjust environment variables, resource allocation, etc.
- Create virtualized environments for development and testing
- Test MCP functionality without using a real server
How to Use
- Click the MCP Management menu in the left sidebar
- Select Virtual MCP Server Management
- Review the list of created virtual servers
- Click Create Virtual Server to add a new virtual server
- Enter server information:
- Server Name
- Configuration settings
- Environment variables (if needed)
- Save to complete the virtual server creation
- Click Start to start the virtual server
Usage Examples
Example 1: Creating a Virtual Server
- Navigate to MCP Management > Virtual MCP Server Management
- Click Create Virtual Server
- Enter a server name (e.g., "Test MCP Server")
- Configure the necessary settings
- Save to complete the virtual server creation
- Select a server from the Virtual Server List
- Click Start to run the server
- Verify that the server status changes to Running
- Click Stop to halt the server
Cautions
- ⚠️ Virtual servers are intended for testing and development purposes
- ⚠️ Virtual server resources may be limited
- ⚠️ Deleting a virtual server removes all associated data permanently
Metrics
Path: Left Sidebar → MCP Management → Metrics
Feature Overview
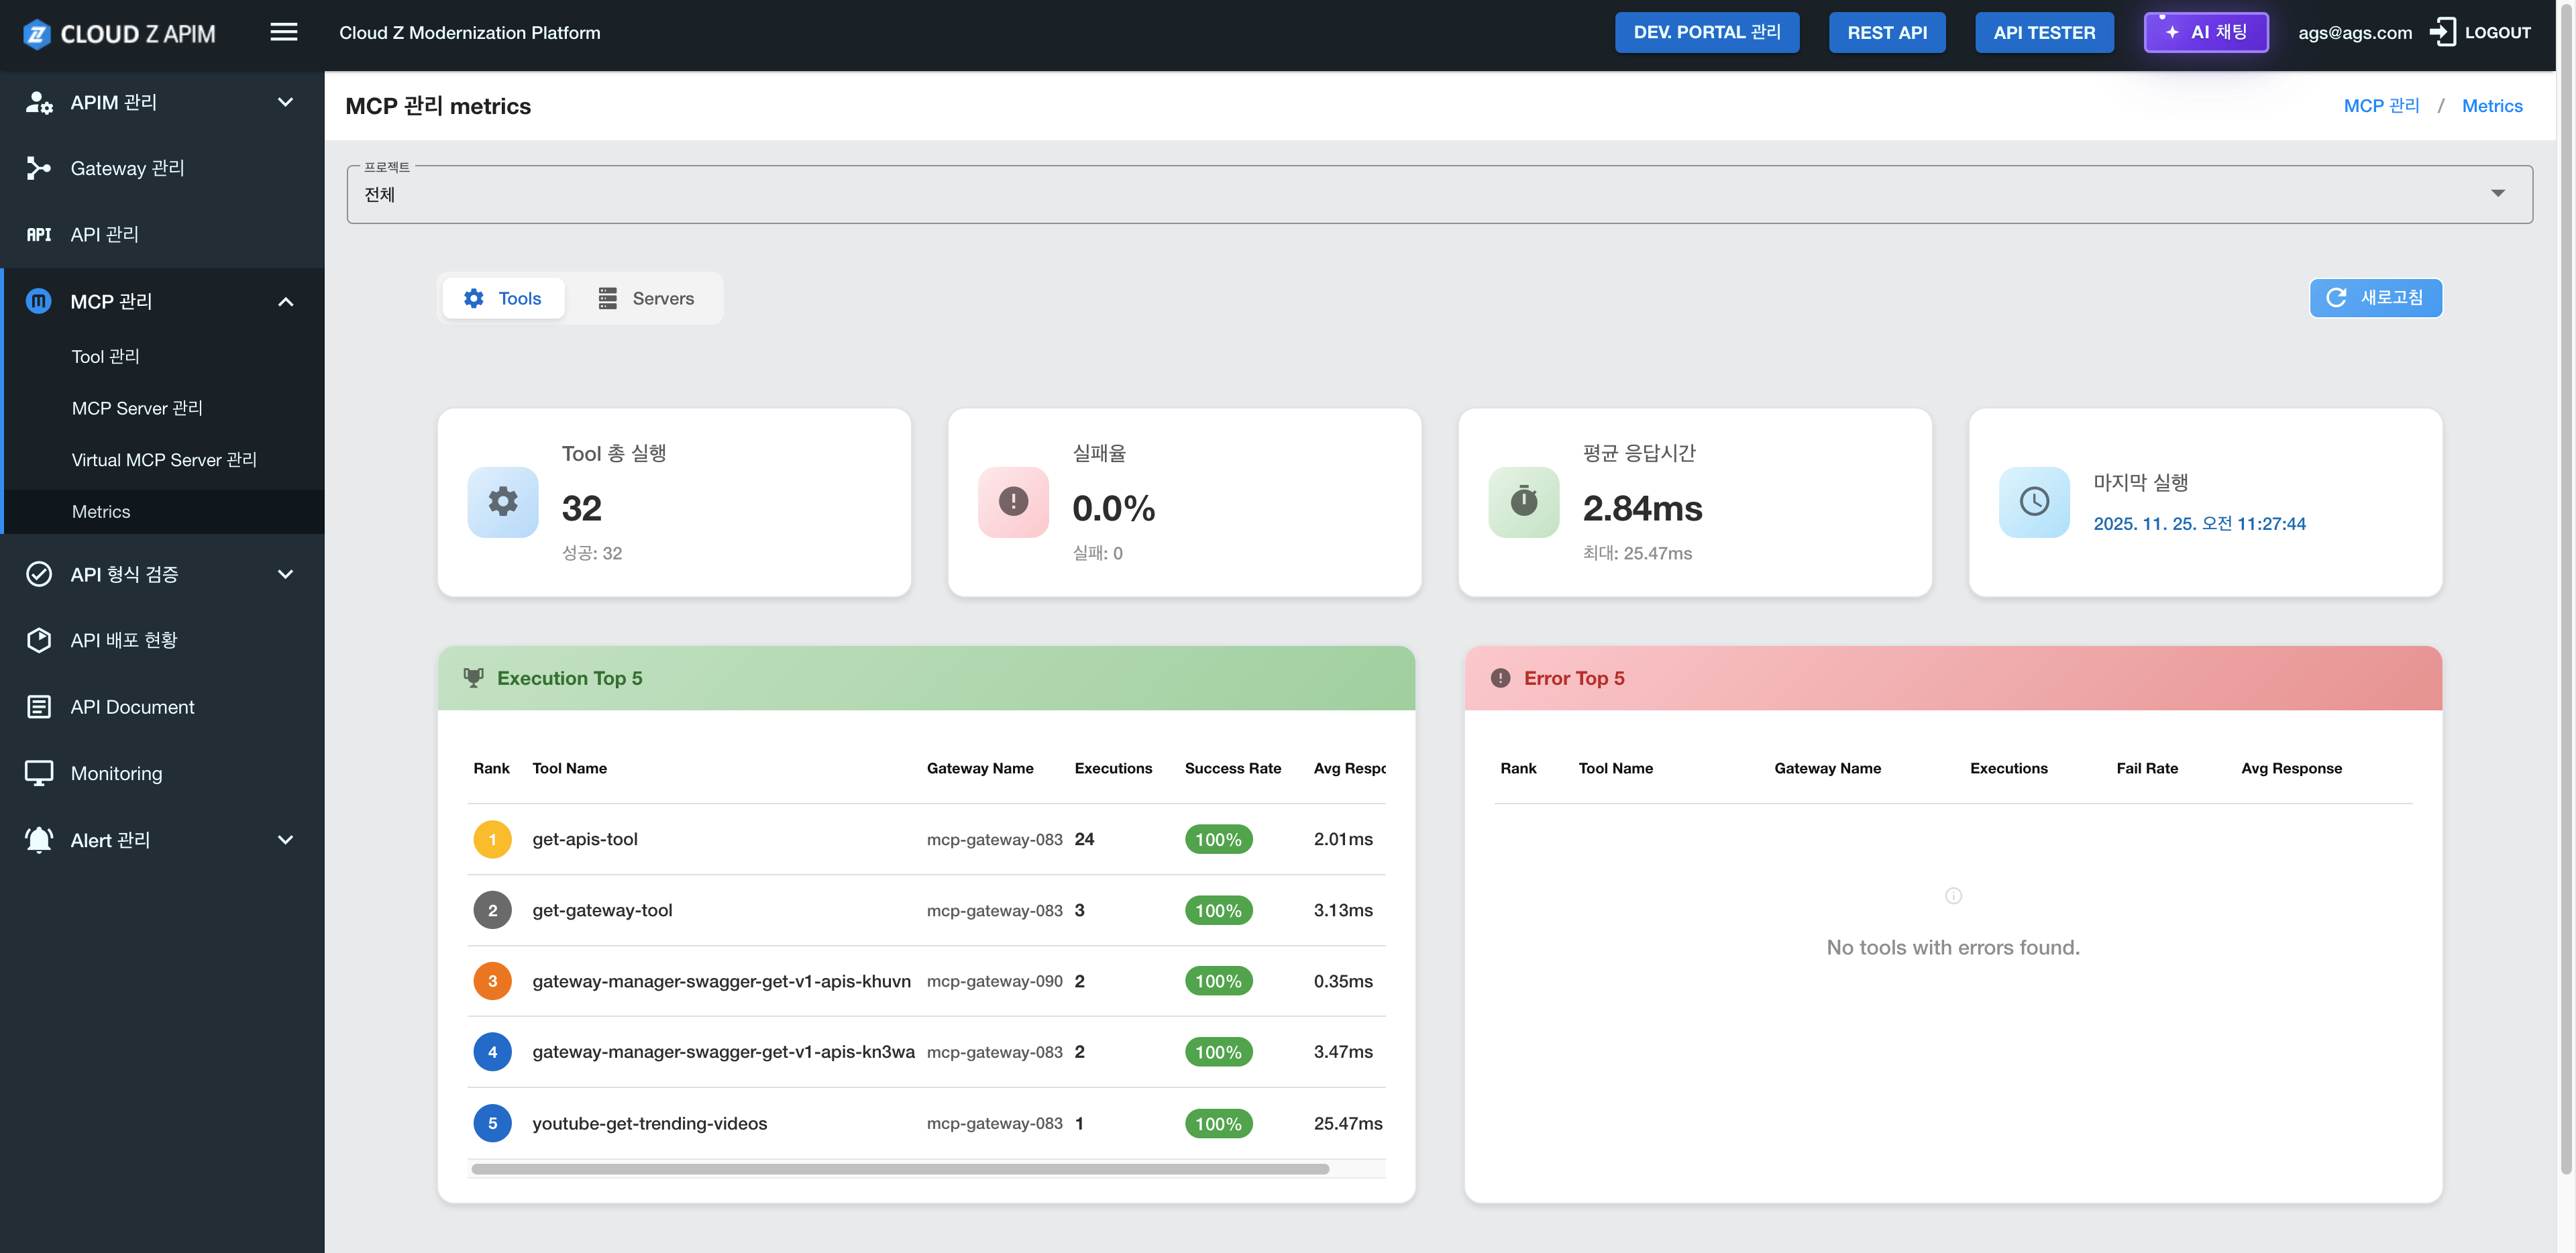
The Metrics page allows users to monitor performance indicators and resource usage related to MCP operations. User can track server status, Tool usage, connection activity, and various MCP-related performance metrics.
Page Structure
1. Metrics Dashboard
Displays key performance metrics in card or chart formats.
Main metrics:- Server Status: Number of connected MCP servers and their connection states
- Tool Usage: Number of Tool calls and usage statistics
- Connection Status: Number of active connections and connection pool status
- Response Time: Average response time and latency trends
- Error Rate: Error counts and error ratio
- Resource Usage: CPU, memory, and network usage
2. Time Range Selector
- Allows selection of the time range for metric visualization
- Examples: Last 1 hour, Last 24 hours, Last 7 days, etc.
- Filter metrics by server, Tool, project, and other criteria
Key Features
1. Real-Time Metrics Monitoring- Monitor MCP-related performance indicators in real time
- Track server status, Tool usage, and connection activity live
- Review response time, throughput, error rate, and more
- Use charts to visualize performance trends over time
- Monitor CPU, memory, and network usage
- Identify servers or Tools with high resource consumption
- View error occurrences and overall error rates
- Check system warnings and alerts
- Export metric data in CSV or JSON formats
- Useful for reporting and data sharing
How to Use
- Click the ”MCP Management” menu in the left sidebar
- Select ”Metrics” from the submenu
- Review key indicators on the Metrics Dashboard
- Select a time range to view metrics for the desired period
- Use filter options to focus on a specific server or Tool
- Analyze performance trends using charts
Usage Examples
Example 1: Viewing All Metrics- Navigate to MCP Management > Metrics
- Review overall data on the Metrics Dashboard
- Check server status, Tool usage, and response time
- Select a time range (e.g., Last 24 hours)
- Review performance charts
- Analyze trends such as response time changes or error rate fluctuations
- View the Resource Usage section
- Identify servers with high CPU or memory usage
- Adjust server resource allocations if necessary
Cautions
- ⚠️ Metric data may be deleted automatically after a certain retention period
- ⚠️ Real-time metrics may have slight delays
- ⚠️ Metric accuracy may vary depending on the server’s stability
Usage Tips
- 💡 Regular Monitoring: Check metrics periodically to detect performance issues early
- 💡 Set Alerts: Configure notifications when certain thresholds are exceeded
- 💡 Analyze Trends: Use long-term metric trends for capacity planning and optimization