Clicking the Monitoring menu will redirect you to the Grafana Dashboard screen.
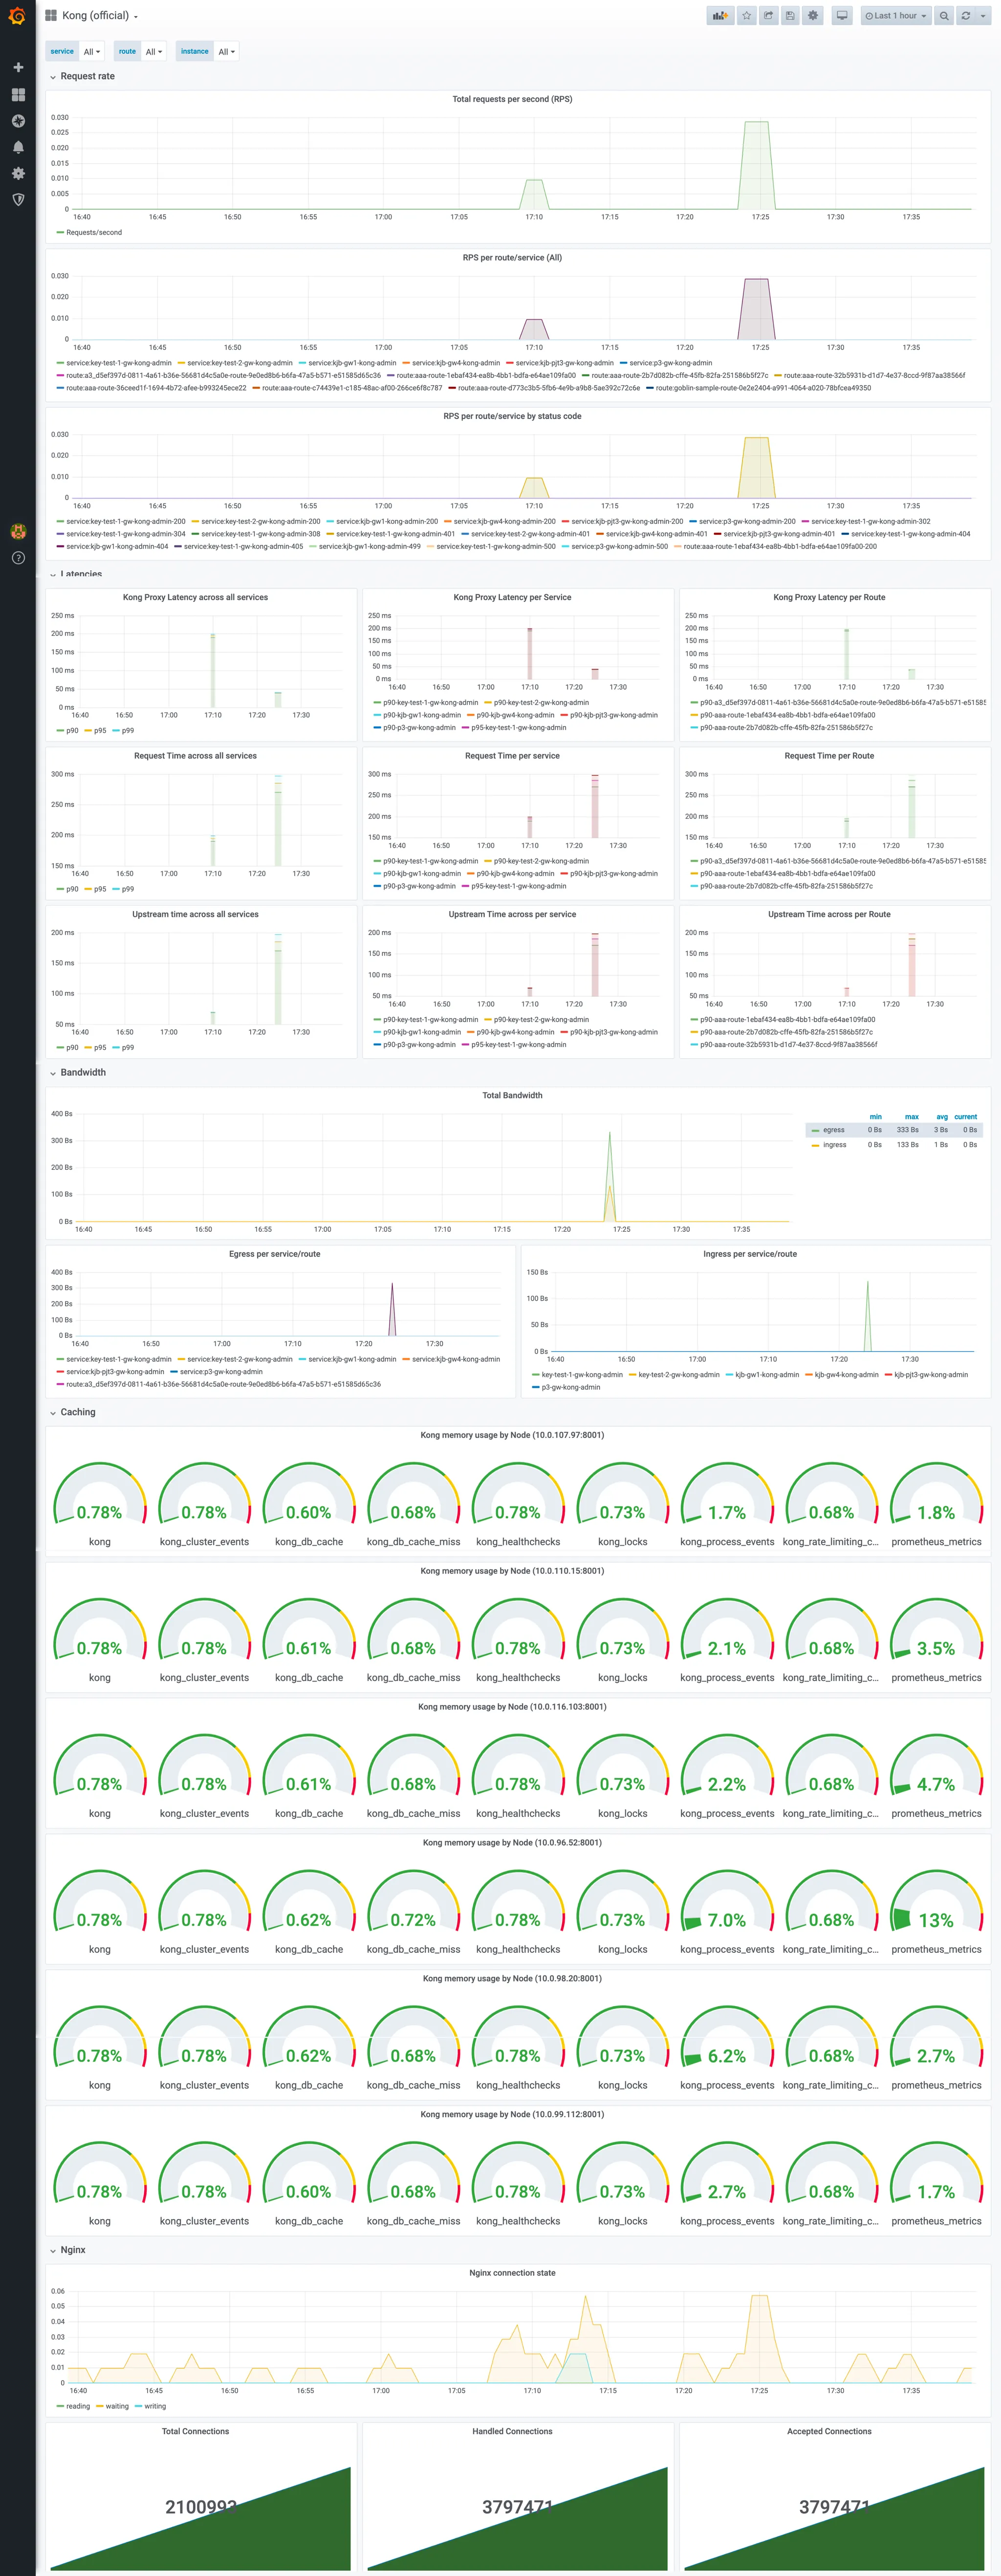
The Grafana Dashboard has a dedicated dashboard where you can monitor Kong resources. (Dashboards → General → Kong)
If you are logged into the APIM Console but the login screen appears again on the Grafana Dashboard, you can log in by clicking the [Sign in with OAuth] button.
service: The backend service inside the Kong Gateway.
route: The API endpoint called by the frontend service inside the Kong Gateway.
instance: A Kong Gateway instance.
Total requests per second (RPS): The total number of requests per second.
RPS per route/service (All): The number of requests per second for each API (route+service).
RPS for route/service by status code: The number of requests per second for each API (route+service), categorized by status code.
Kong Proxy Latency: The latency of the Kong Gateway Proxy.
Upstream Time: The latency of the backend service.
Request Time: Kong Proxy Latency + Upstream Time.
Egress: The amount of outbound traffic.
Ingress: The amount of inbound traffic.
Total Bandwidth: Ingress + Egress.
Caching: The usage rate of each detailed cache memory compared to the total memory of the Kong Gateway.
Nginx
reading: The current number of connections where Nginx is reading the request header.
writing: The current number of connections where Nginx is writing the response back to the client.
waiting: The current number of idle client connections waiting for a request.
Total Connections: The total number of client requests since the Nginx master process started.
Handled Connections: Connections that Nginx has finished writing data to the client, successfully completing and closing the request.
Accepted Connections: A connection moves to the Accepted state after the TCP handshake and then takes one of three sub-states (waiting/reading/writing).