Code Quality
The Code Quality Dashboard is a tool designed to track various metrics related to code quality and assess the health of the codebase. It allows developers to comprehensively monitor code quality metrics, assess the health of the codebase, and maintain higher code quality standards.
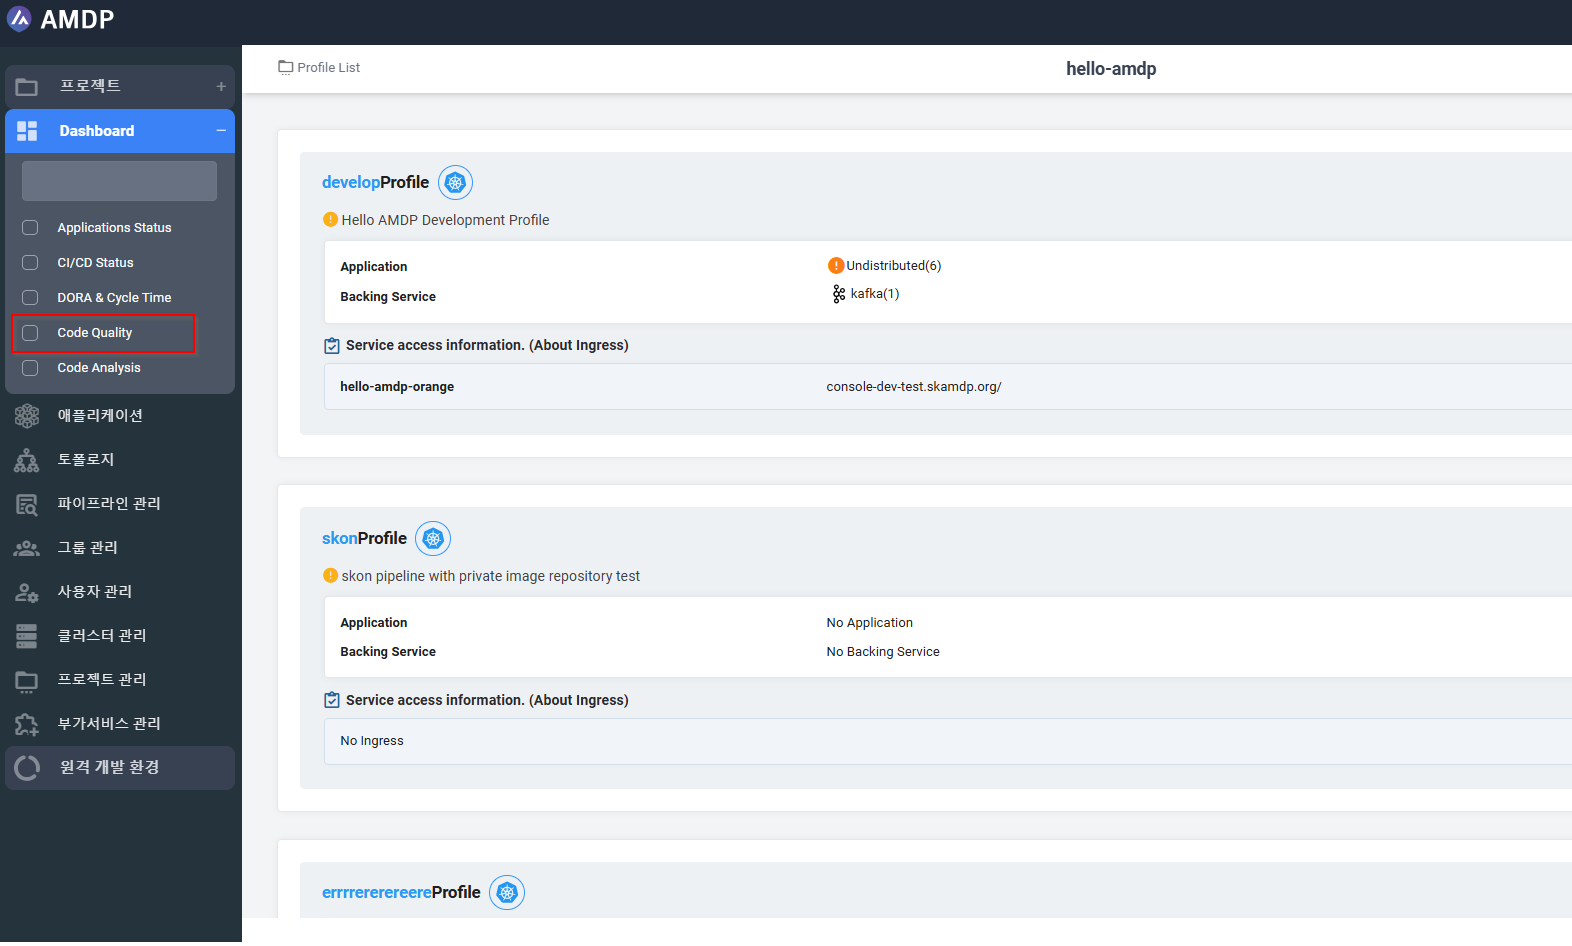
Code Quality dashboard
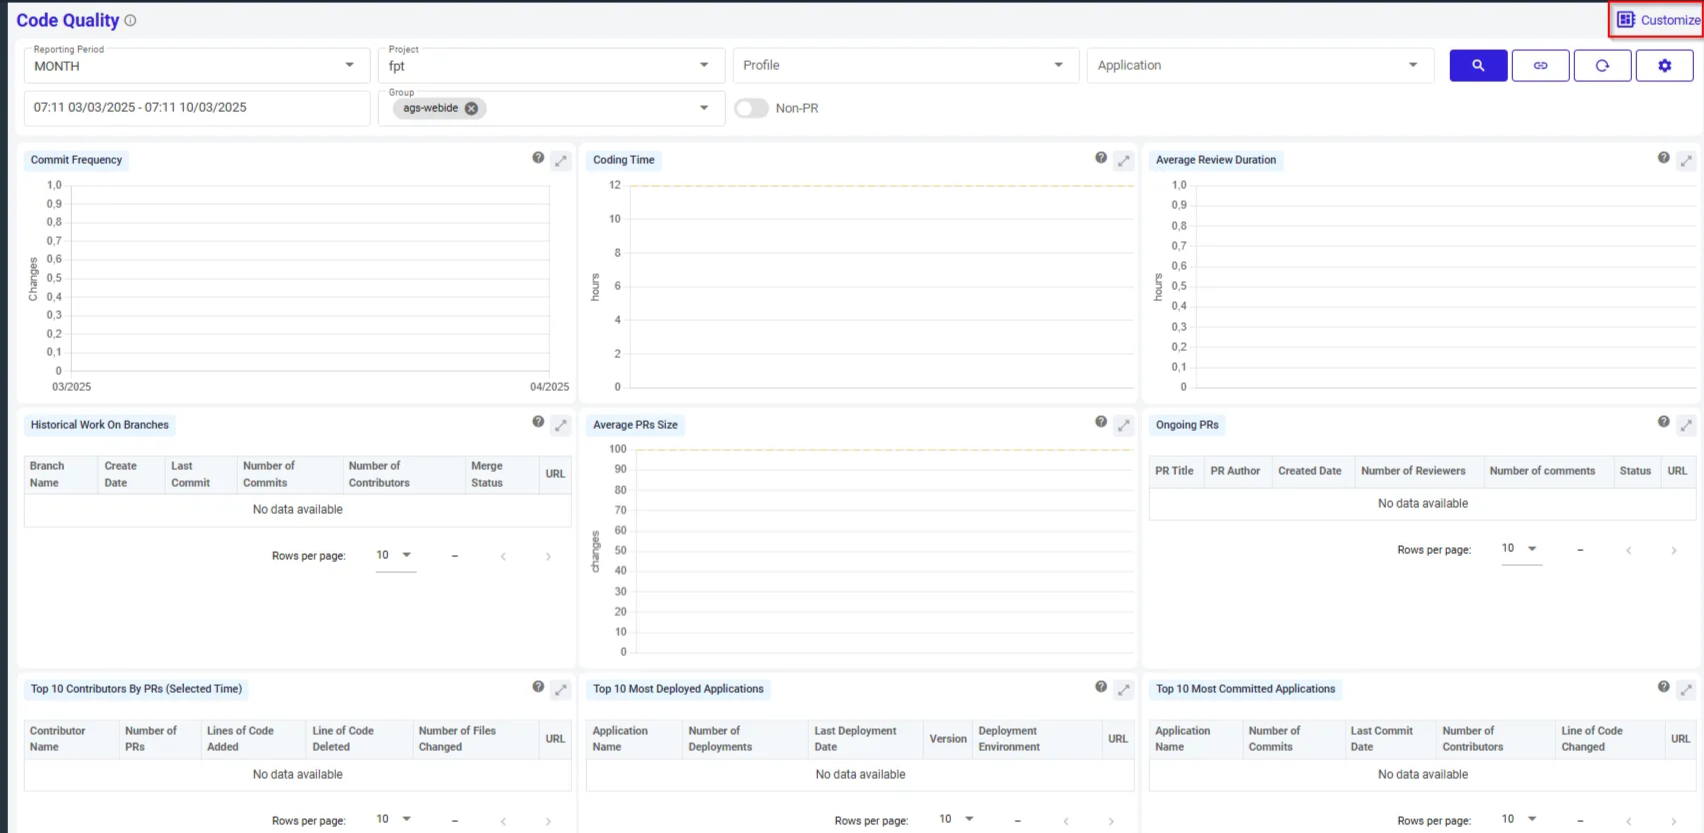
From the Sidebar Menu, select the Dashboard/Code Quality:
Key functions
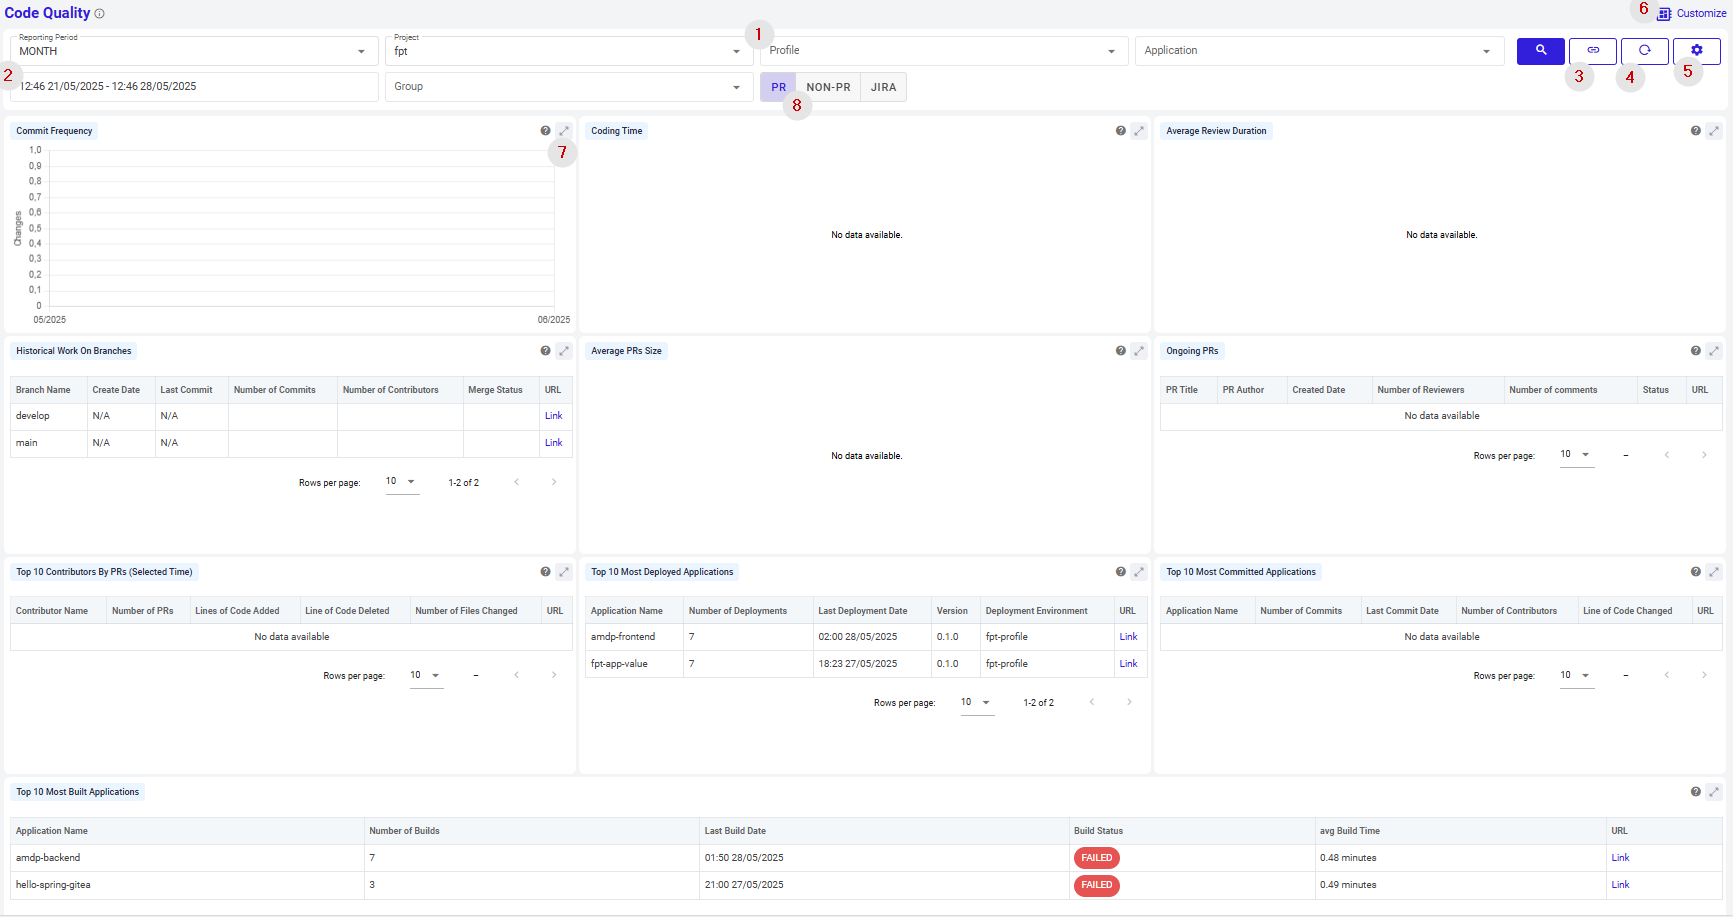
From the Code Quality Dashboard, below actions can be performed:
-
Search for a report, which is:
- Filtered by Project
- Filtered by Project and Profile of project
- Filtered by Project and Profile and application of profile
- Filtered by Project and Group of project
- Filtered by Project and Profile, group of project
-
View report by customized time:
- Sorted by Period ( Day, Week, Month, Year)
- Sorted by specific date time set by user
- Sorted by suggested time ranges: Last 2 weeks, 2 hours…
-
Copy URL of current Code quality dashboard.
-
Reset the dashboard:
When click on button Reset, all the data selected in terms of project, profile, application, group and Time duration selected are reset.
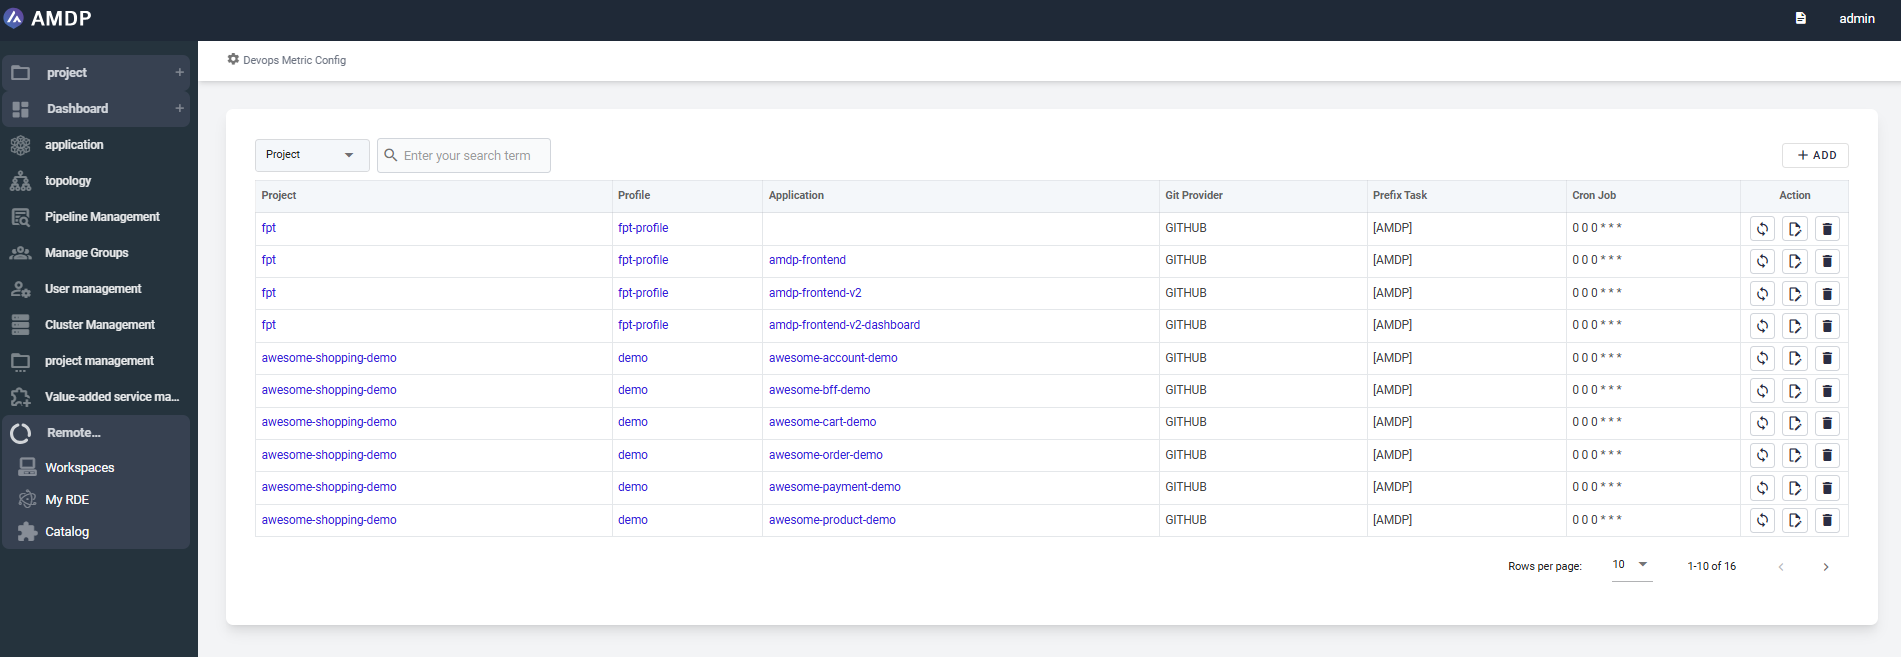
- Configure Devops Metric:
Allow user to navigate to Devops Metric Config screen, which allow user to view project detail, profile detail, application detail, create new config, fetch the sync manually, edit config and delete config.
- Customize the displayed report by enable or disable charts/tables:
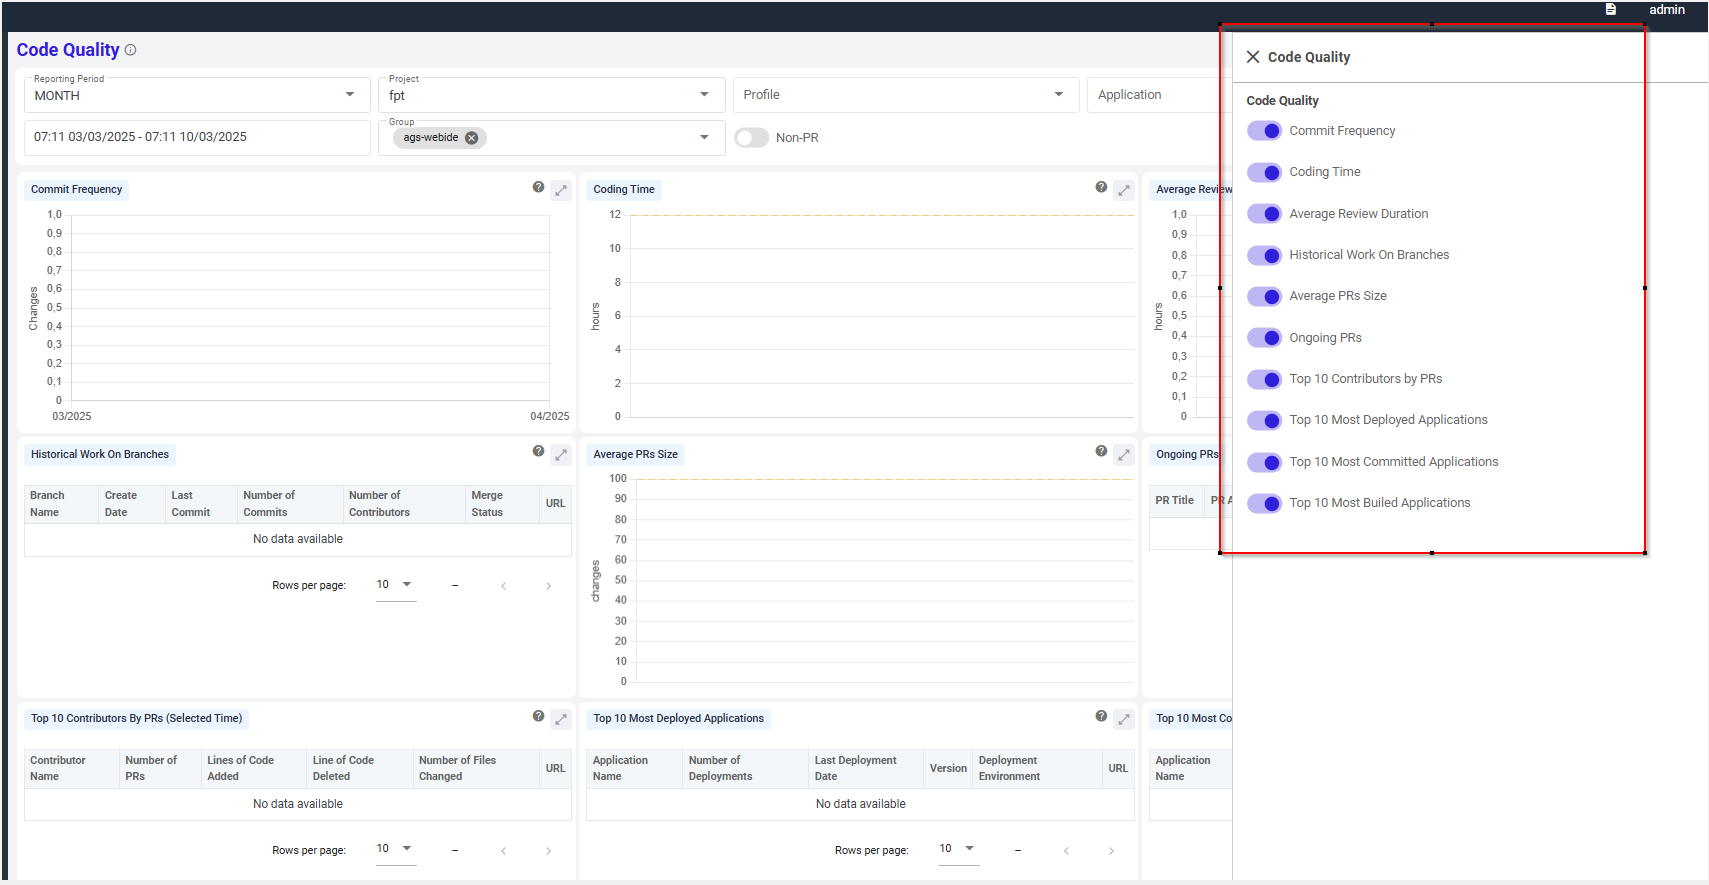
-
Expand a specific report chart on Dashboard.
-
Switch between PR (Pull Request) and Non-PR( Non Pull Request) mode:
With mode PR: board illustrates the data of commits from pull request, which are parts of a pull request workflow, typically used for code review before merging into the main branch.
With non PR: board illustrates the data of commits without pull request, these are direct commits (e.g., pushed directly to the main branch or another branch) not associated with any pull request.
By default, dashboard is displayed on PR mode.7
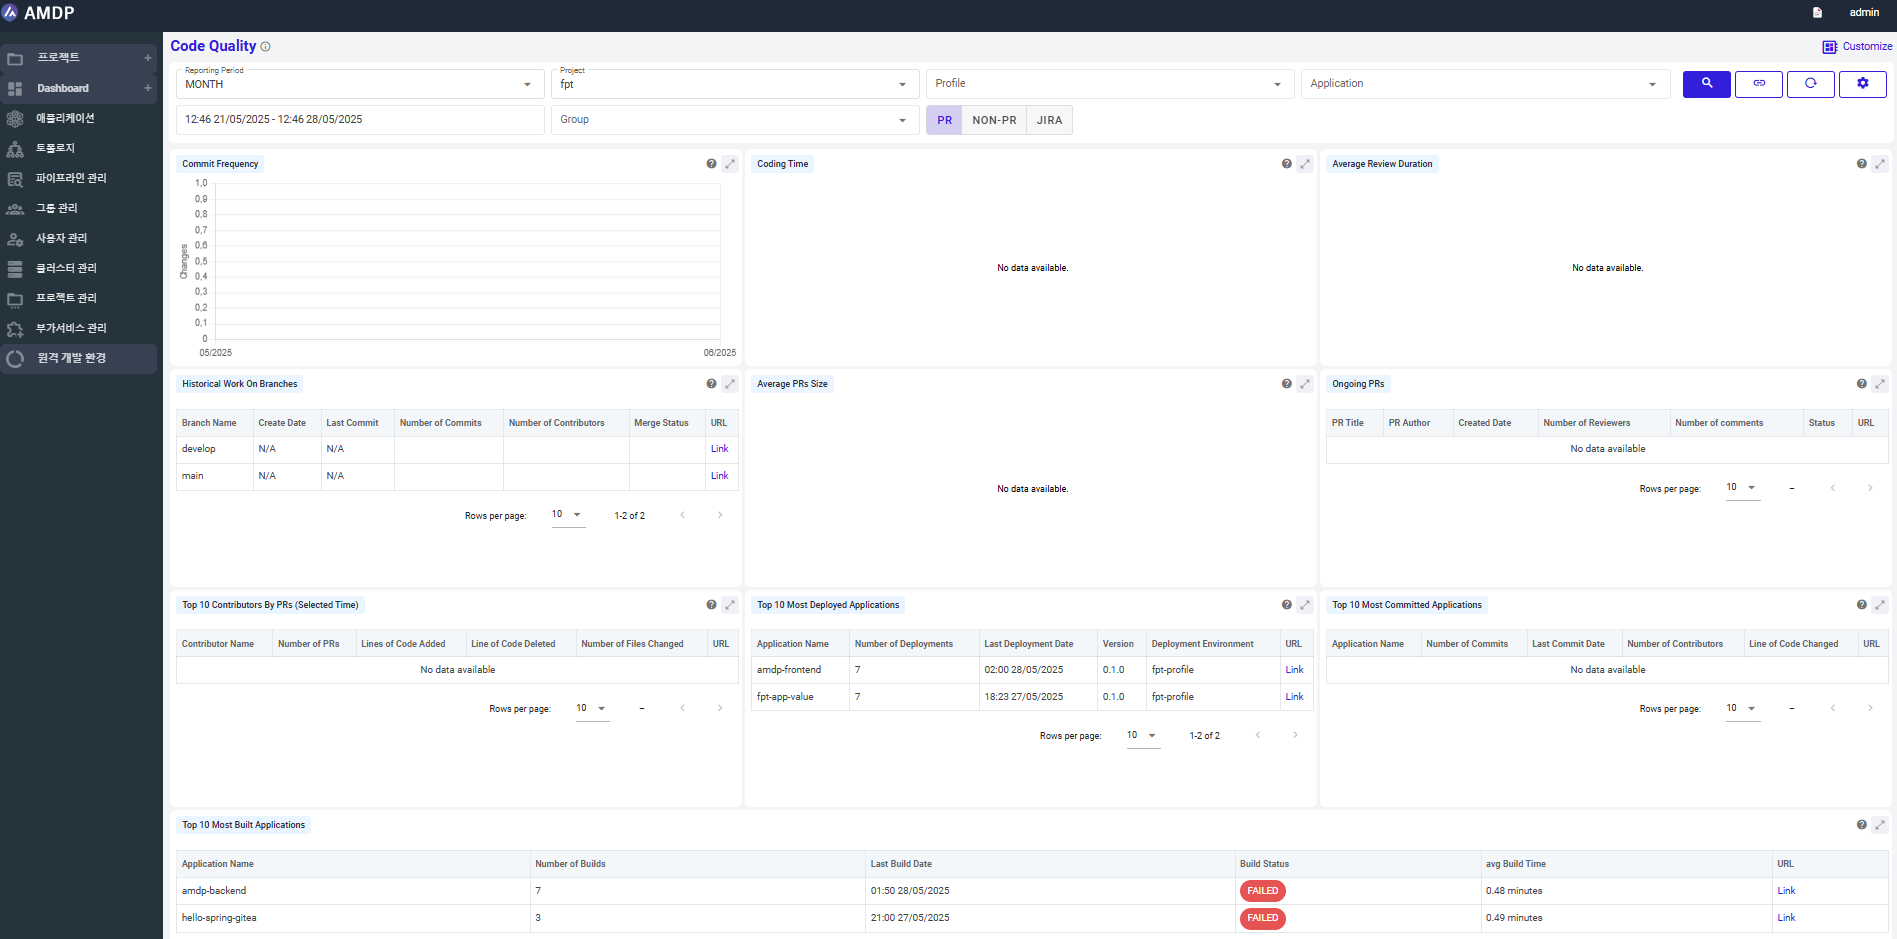
Key components
The dashboard visualizes multiple metrics related to code quality, aiding in maintaining and improving the quality of the codebase. Key components include:
Commit Frequency: Displays the number of commits over a specific period, indicating the frequency of code changes.
This chart helps in assessing developer productivity by tracking how often code changes occur and identifying peak periods of activity
- Y-axis (Changes): Represents the number of changes made in each commit.
- X-axis (Date): Displays the timeline, indicating when the commits were made.
- Data Points: Each point on the graph corresponds to a specific commit, showing its frequency and magnitude.
Coding Time: Visualizes the time spent on coding for each application in hours.
This chart helps in analyzing how much time developers are spending on different applications, allowing for better resource allocation and productivity assessment
- Y-axis (Hours): Represents the amount of time spent on each commit.
- X-axis (App): Lists the applications related to the commits.
- Data Points: Each bar indicates the total coding time for a particular application.
Average Review Duration: Shows the average time spent on code review.
This chart helps in understanding the review workload across different applications, facilitating better time management and process optimization.
- Y-axis (Hours): Represents the total review time spent per application.
- X-axis (App): Lists the applications associated with the pull requests.
- Data Points: Each bar indicates the average review duration for a specific application.
Average PRs Size: Represents the average size of pull requests in terms of lines of code changed.
This chart helps in evaluating the complexity and impact of pull requests, aiding in better project management and review processes.
- Y-axis (Changes): Represents the number of code changes, including additions and deletions.
- X-axis (PRs): Lists the pull requests associated with various applications.
- Data Points: Each bar shows the size of a pull request, with details such as lines of code added, deleted, and the number of files changed.
Ongoing PRs: Lists PRs that are currently under review or not yet merged.
This table helps in tracking the progress and status of ongoing development work, facilitating better project management and collaboration.
- PR Title: The title of each pull request, indicating its purpose or feature.
- Author: The developer who created the pull request.
- Created Date: The date and time when the pull request was initiated.
- Number of Reviewers: Indicates how many reviewers are assigned to each pull request.
- Number of Comments: Shows the number of comments made on the pull request.
- Status: The current status of the pull request (e.g., open, closed).
- URL: A link to view the pull request in detail on GitHub.
Historical Work on Branches: Displays information such as branch creation date, last commit date, number of commits, and contributors for each branch.
This table helps in tracking the development progress and collaboration on different branches, providing insights into team activity and project evolution.
- Branch Name: The name of each branch.
- Create Date: The date when the branch was created.
- Last Commit: The date of the most recent commit on the branch.
- Number of Commits: Total number of commits made to the branch.
- Number of Contributors: Number of contributors who have worked on the branch.
- Merge Status: Indicates whether the branch has been successfully merged.
- URL: A link to view more details about the branch.
Top 10 Contributors by PRs: Lists the top 10 contributors by number of PRs, lines of code added/deleted, and number of files changed over the selected period.
This table provides insights into the most active contributors, helping teams recognize key contributors and manage resources effectively.
- Contributor Name: The name of each developer contributing to the project.
- Number of PRs: Total number of pull requests submitted by the contributor.
- Lines of Code Added: The number of lines of code added by the contributor.
- Lines of Code Deleted: The number of lines of code removed by the contributor.
- Number of Files Changed: Total files modified by the contributor.
- URL: A link to view more details about each contributor's activity.
Top 10 Most Deployed Applications: Shows the top 10 applications with the highest number of deployments, indicating deployment frequency.
This table helps in identifying the most actively deployed applications, providing insights into deployment frequency and version management.
- Application Name: The name of each application.
- Number of Deployments: Total number of times the application has been deployed.
- Last Deployment Date: The date and time of the most recent deployment.
- Version: The current version of the deployed application.
- Deployment Environment: The environment where the application is deployed.
- URL: A link to view more details about each deployment.
Top 10 Most Committed Applications: Displays the top 10 applications with the highest number of commits.
This table helps in identifying which applications are undergoing the most development activity, providing insights into team focus and project priorities
- Application Name: The name of each application.
- Number of Commits: Total number of commits made to the application.
- Last Commit Date: The date and time of the most recent commit.
- Number of Contributors: Number of developers who have contributed to the application.
- Lines of Code Changed: Total lines of code that have been added or modified.
- URL: A link to view more details about each application's commit history.
Top 10 Most Built Applications: Shows the top 10 applications with the highest build frequency, indicating build activity.
This table helps in identifying which applications are being built most frequently, offering insights into development focus and potential areas requiring attention.
- Application Name: The name of each application.
- Number of Builds: Total number of builds completed for the application.
- Last Build Date: The date and time of the most recent build.
- Build Status: Indicates whether the last build was successful or failed.
- Average Build Time: The average time taken to complete a build.
- URL: A link to view more details about each application's build history.