CICD Status
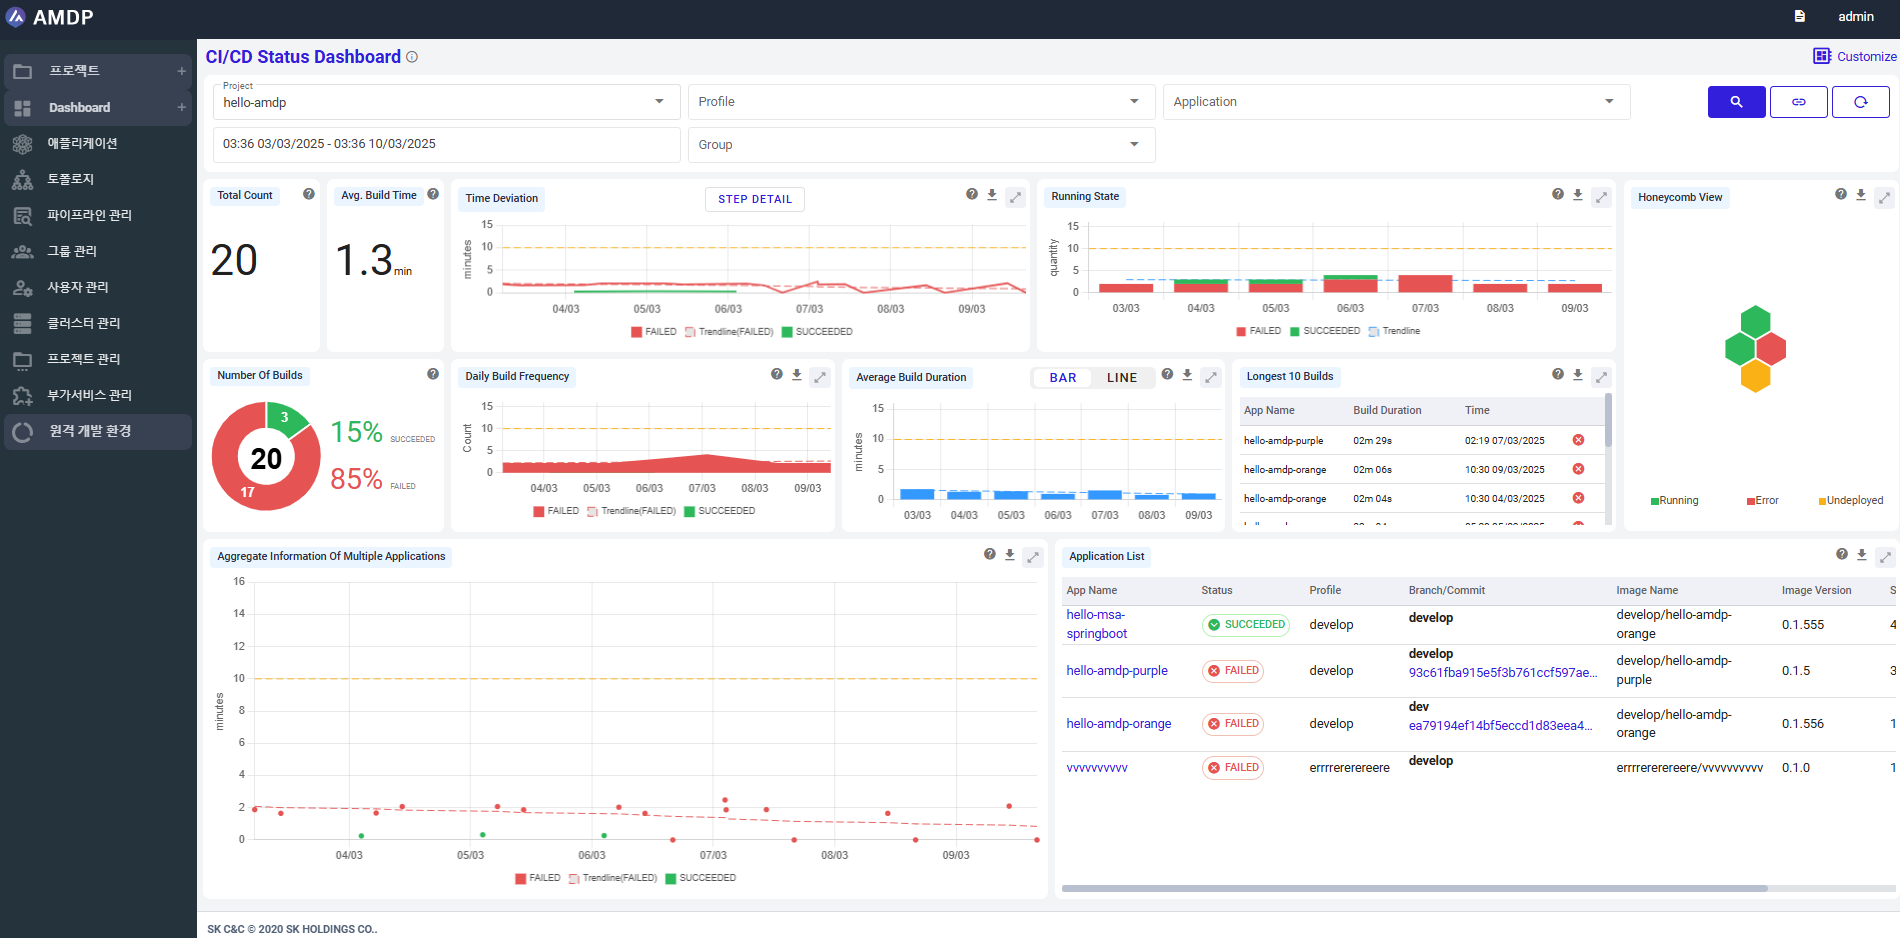
The CI/CD Status Dashboard is a tool designed to monitor and manage build and deployment statuses in real-time within the software development and deployment process. It allows for tracking the overall project’s build success rate, build times, status changes, and provides quick response capabilities in case of issues.
CICD status dashboard
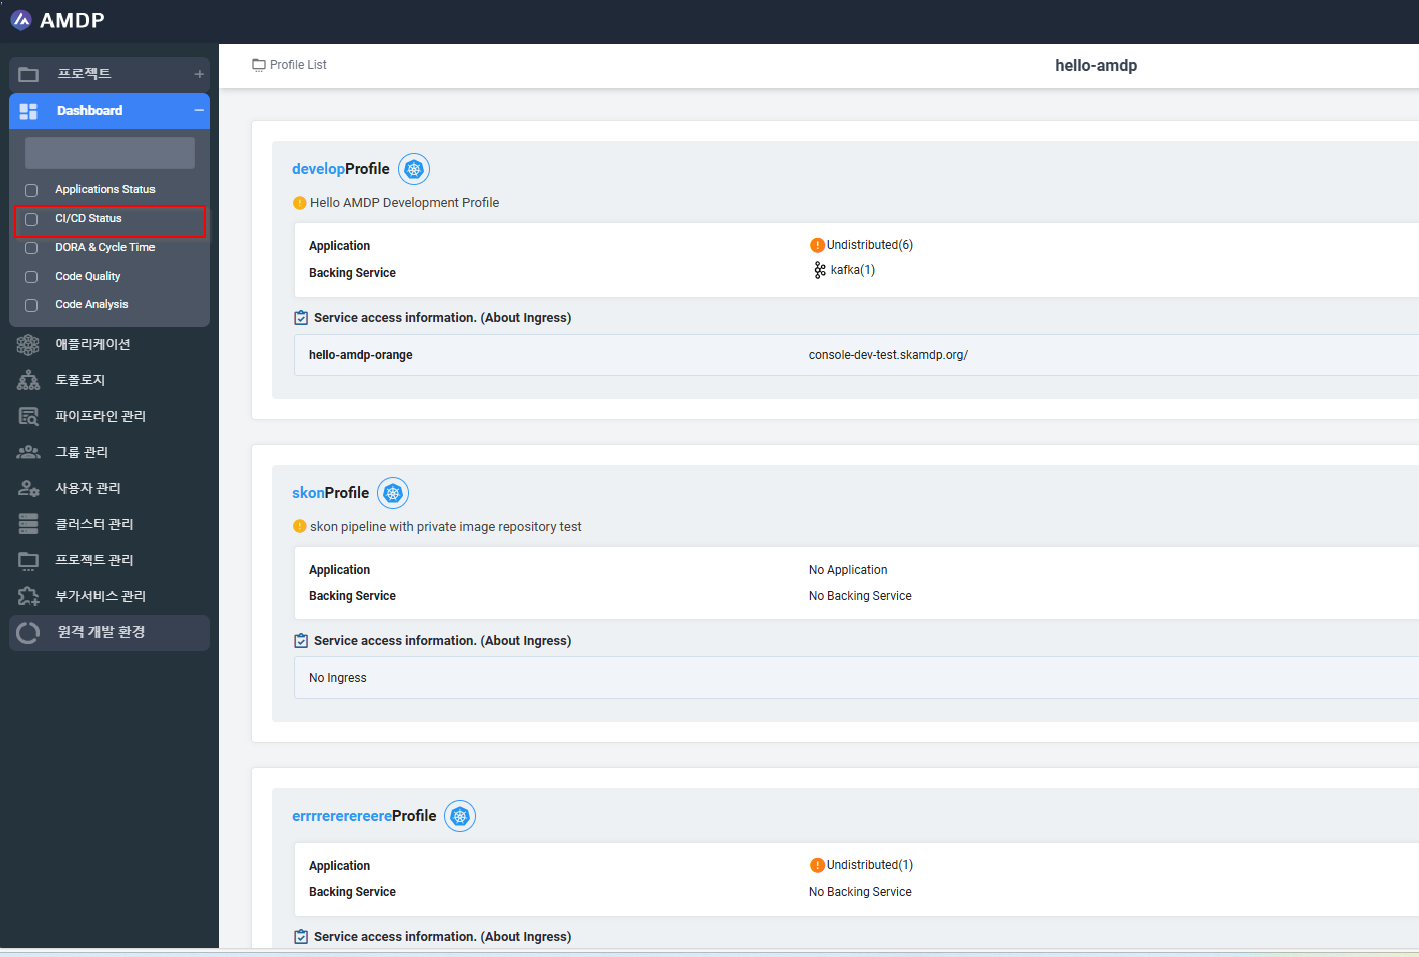
From the Sidebar Menu, select the Dashboard/CICD Status:
Key functions
From the CICD Status Dashboard, below actions can be performed:
-
Search for a report, which is
- Filtered by Projects.
- Filtered by Project and Profile of projects
- Filtered by Project and Group of projects
- Filtered by Project and Profile, group of projects
-
View report by customized time
-
Copy URL of current CICD status Dashboard
-
Reset the dashboard:
When click on button Reset, all the data selected in terms of project, profile, application, Group and Time duration selected are reset.
-
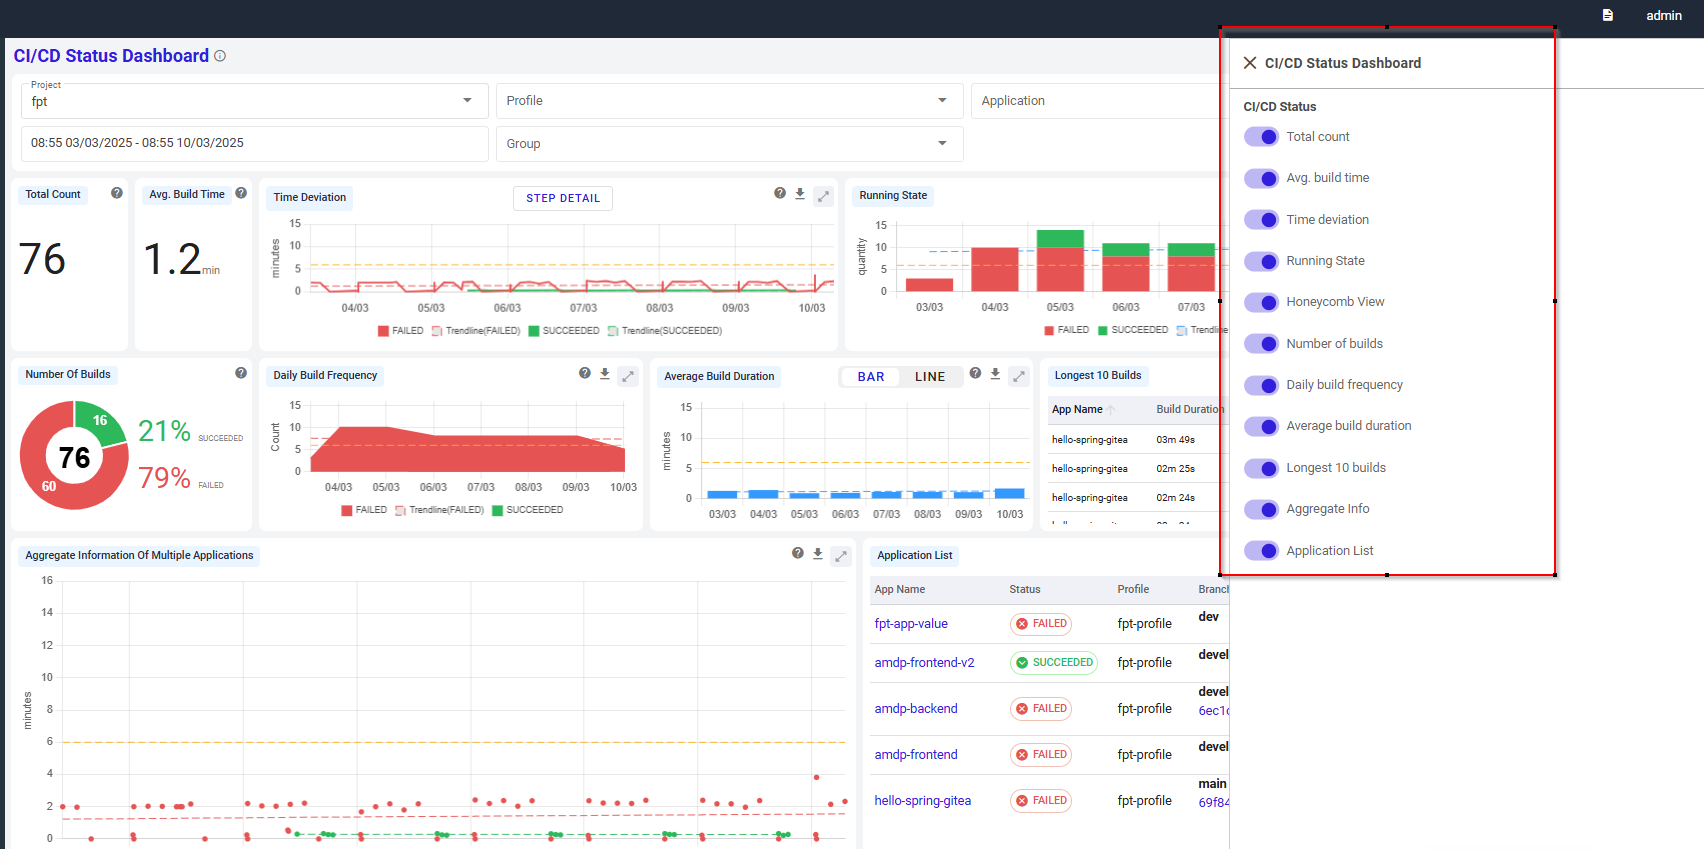
Customize the displayed report by enable or disable charts/tables
-
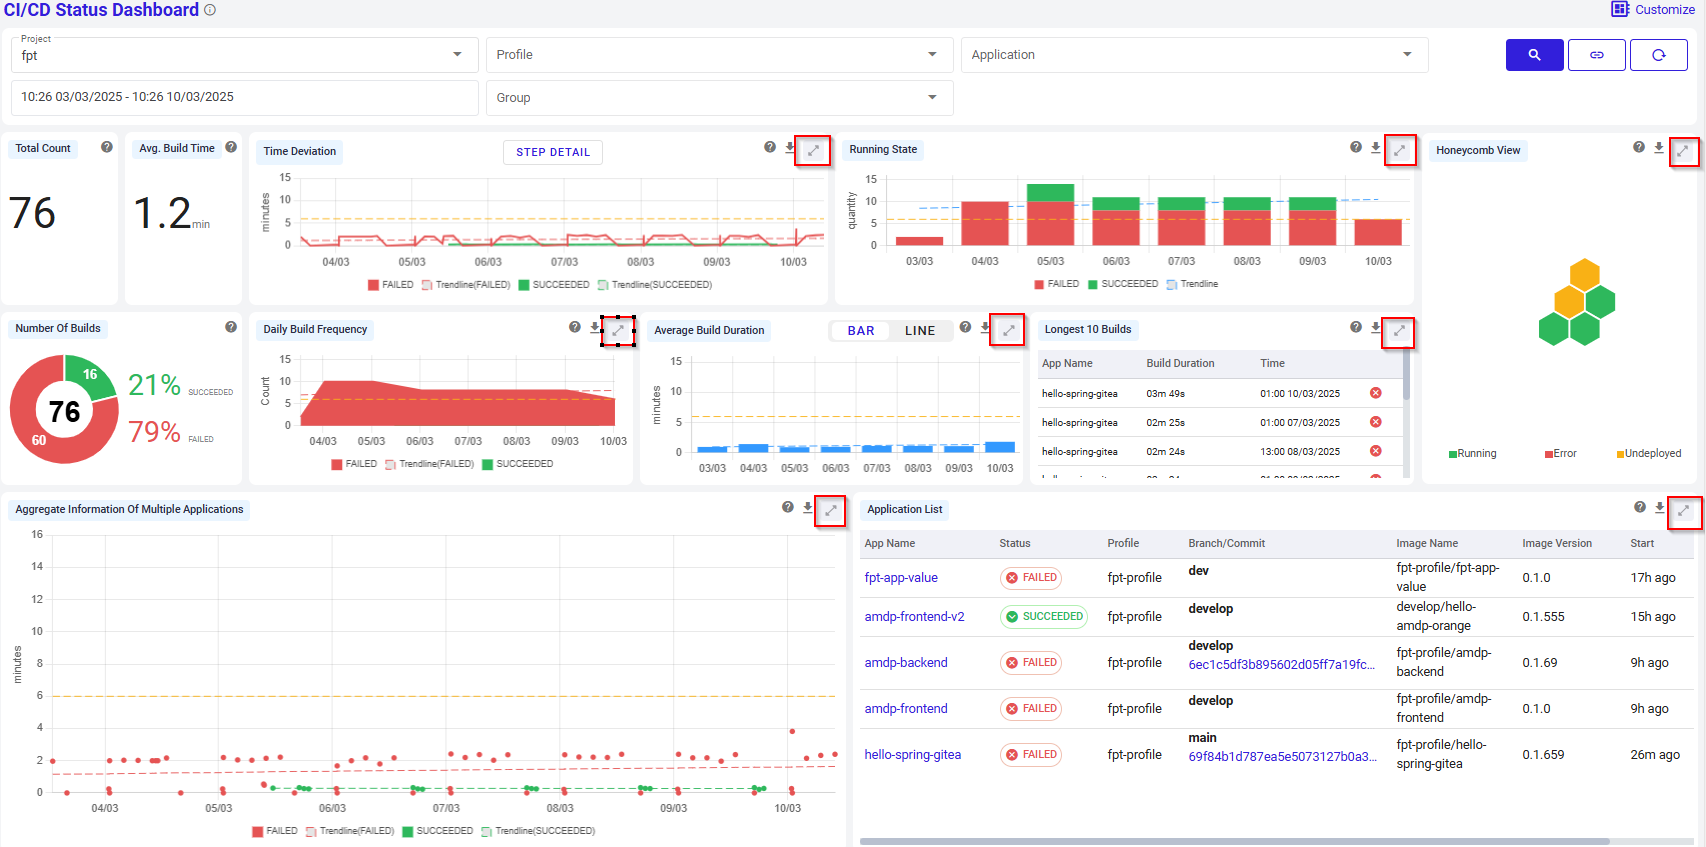
Expand a specific report chart on Dashboard:
Select icon on the top right of each chart to open it up:
Click on “X” icon to close the report.
-
Export to .csv file regarding:
- Time Deviation
- Running State
- Honeycomb View
- Daily Build Frequency
- Average Build Duration
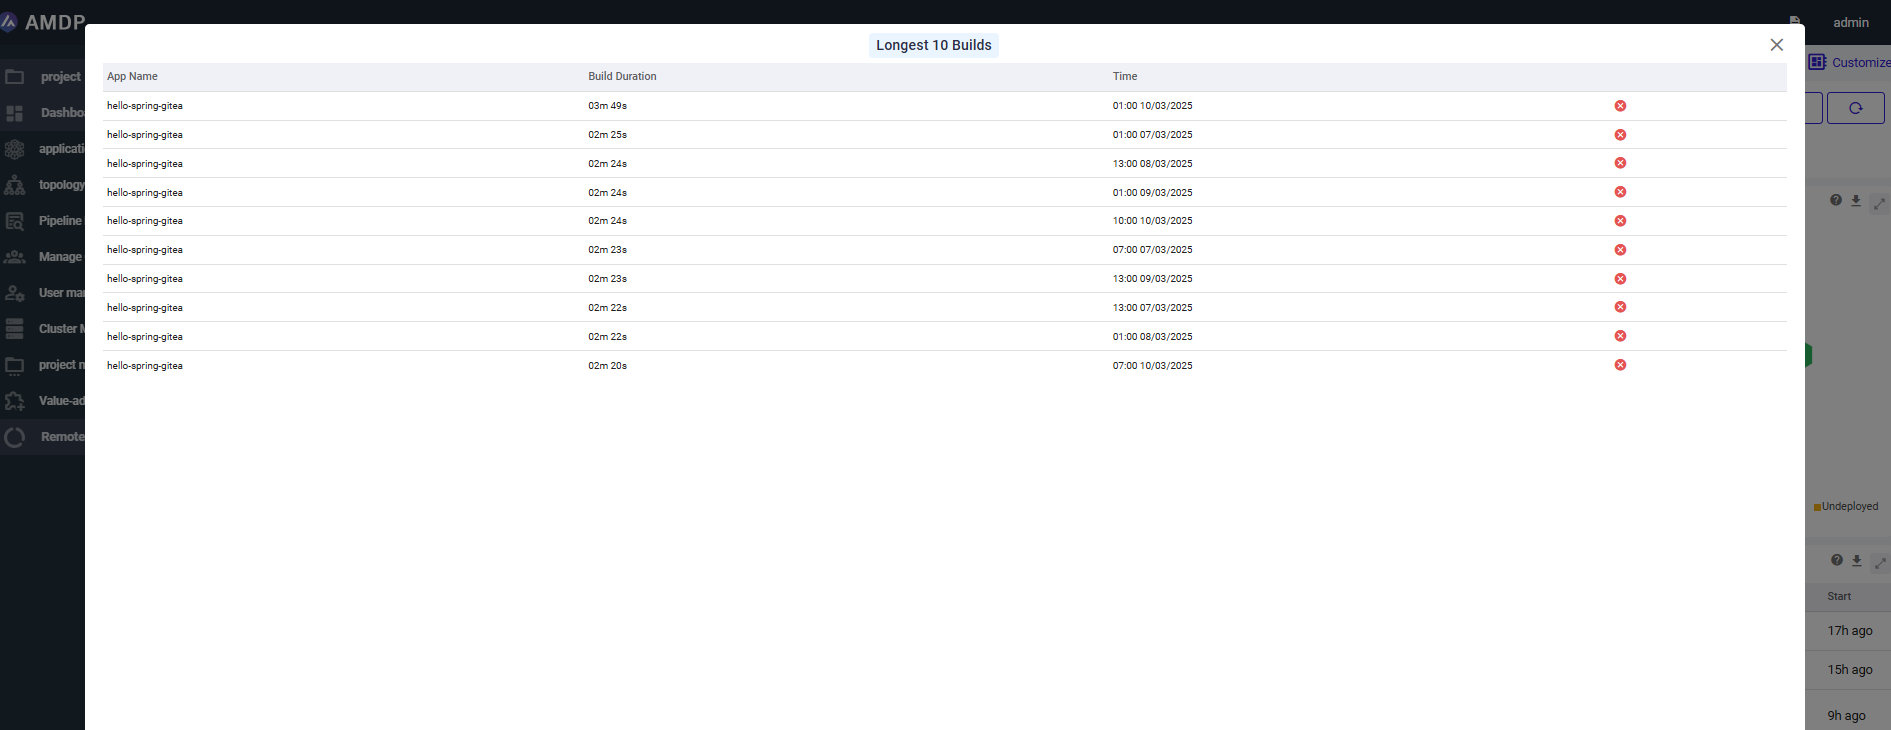
- Longest 10 Builds
- Application List
- Aggregate Information of Multiple Applications
Key components
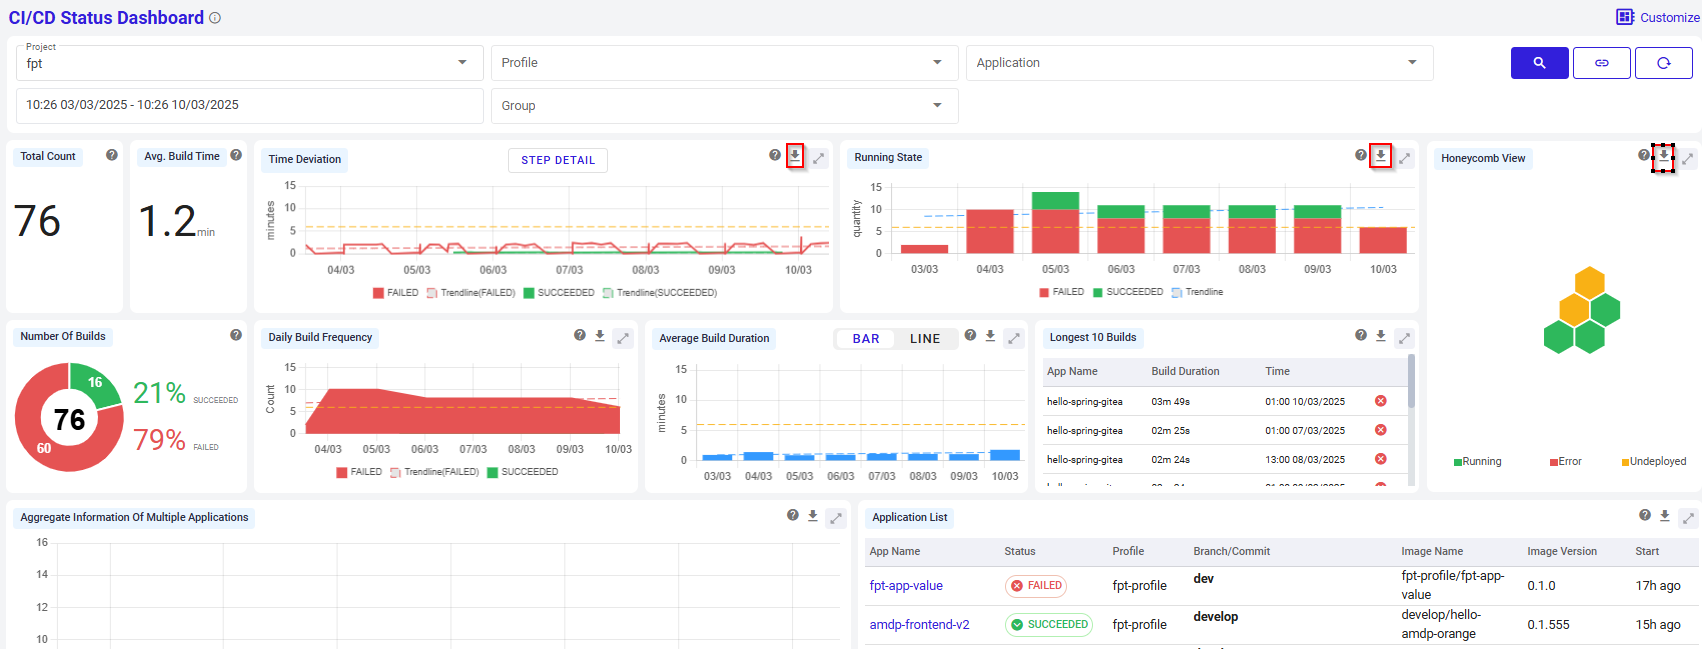
This dashboard provides various visualizations of CI/CD pipeline information, making it useful for tracking build status and efficiency. Key components of the dashboard include:
Total Count: Displays the total number of builds executed within the selected time period.It helps to intuitively understand the overall activity of pipelines activated during the specific period of time.
Average Build Time: Shows the average time taken per build in minutes.
Time Deviation: Visualizes the variability in build times with trend lines for successful and failed builds.
Running State: A histogram that represents changes in build status (e.g., succeeded, failed, error) over time
Number of Builds: A pie chart showing the proportion of successful and failed builds out of the total builds.
Daily Build Frequency: Indicates the number of builds conducted each day along with their success/failure status
Average Build Duration: Provides the average build duration in a line or bar chart.
Longest 10 Builds: Lists the top 10 longest builds to help with build time optimization.
Application List: Displays detailed information for each application, including current status (success/failure), profile, branch, and image name.
Honeycomb View: A hexagonal visualization showing the running status of each application at a glance.
Aggregate Information of Multiple Applications: A summary view of build times across multiple applications, offering insight into overall build performance.