Application status
The Application Status Dashboard is a tool developed to track and control the current performance and resource consumption of an application. It allows user to analyze the application's running condition, CPU, and memory usage, supporting resource optimization and proactive issue detection.
Application status dashboard
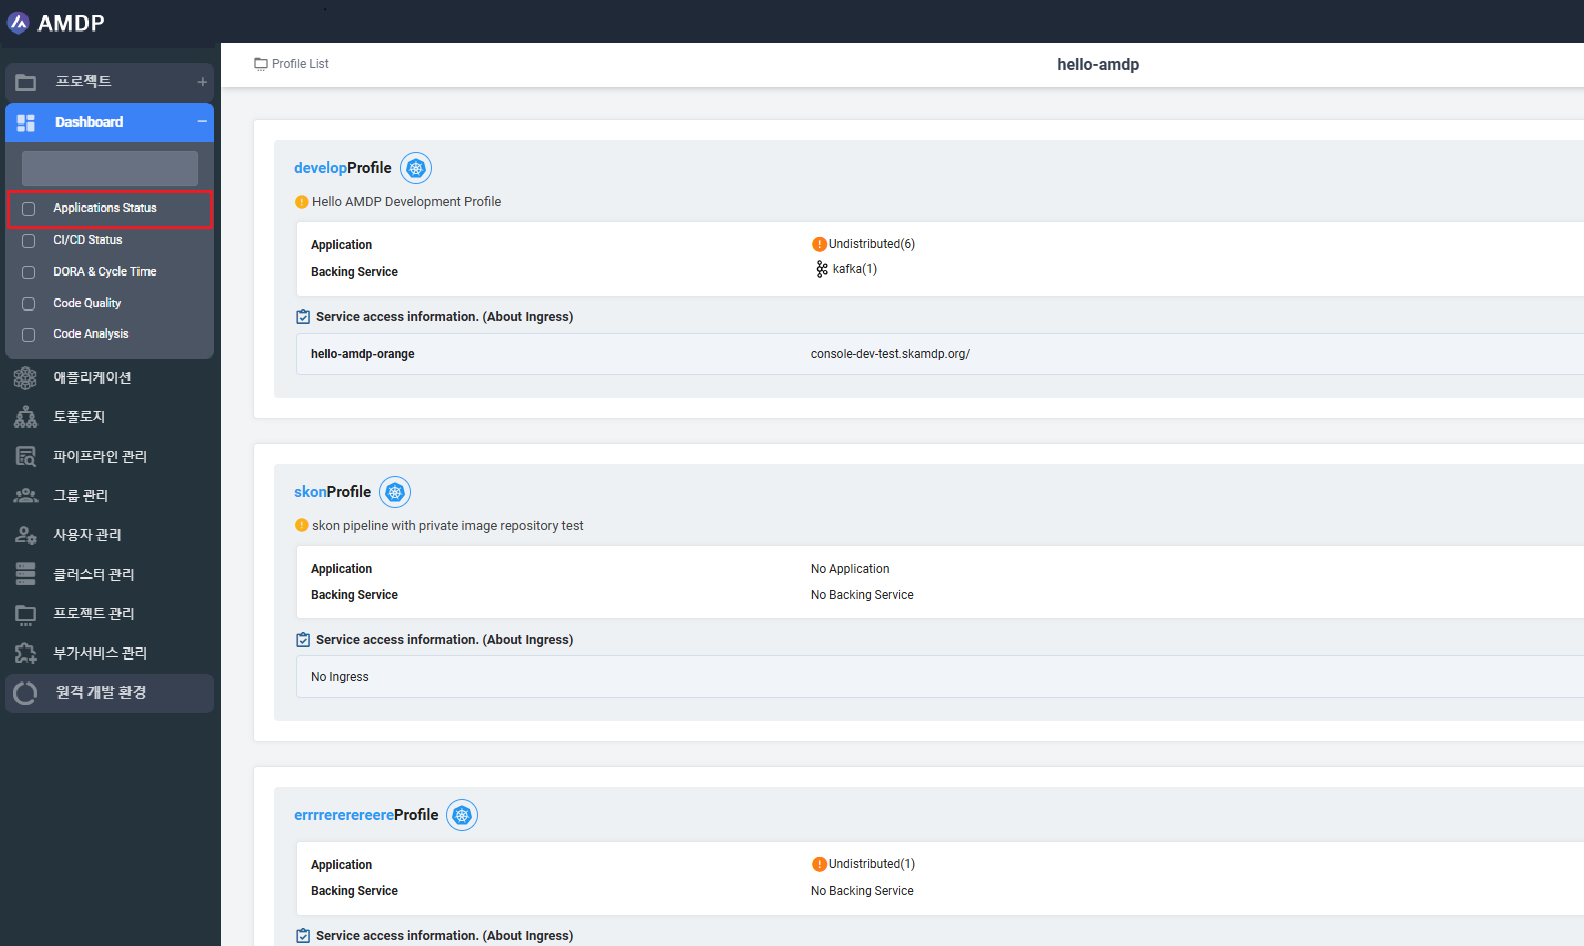
From the Sidebar Menu, select the Dashboard/ Application Status:
Key functions
From the Application Status Dashboard, below actions can be performed:
-
Search for a report, which is:
- Filtered by Project
- Filtered by Project and Profile of project
- Filtered by Project and Group of project
- Filtered by Project and Profile, group of project
-
Copy URL of current application status dashboard
-
Reset the dashboard:
When click on button Reset, all the data selected in terms of project, profile, group selected are reset.
-
Refresh data on dashboard: data on dashboard can be refreshed manually or automatically refreshed per minute.
-
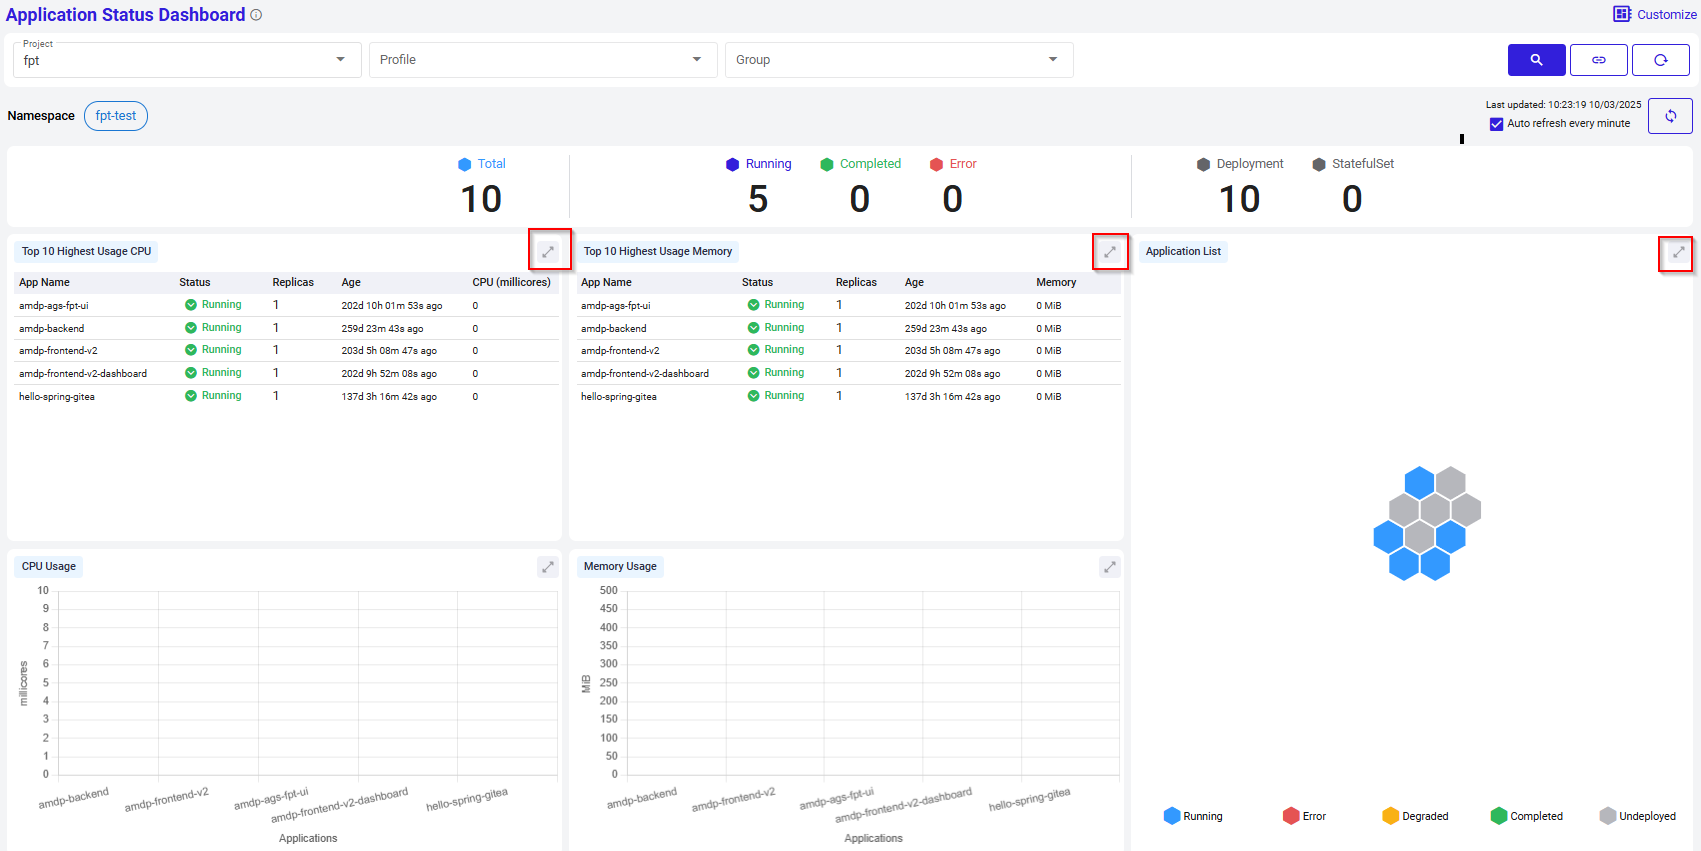
Expand a specific report chart on Dashboard:
Select icon on the top right of each chart to open it up:
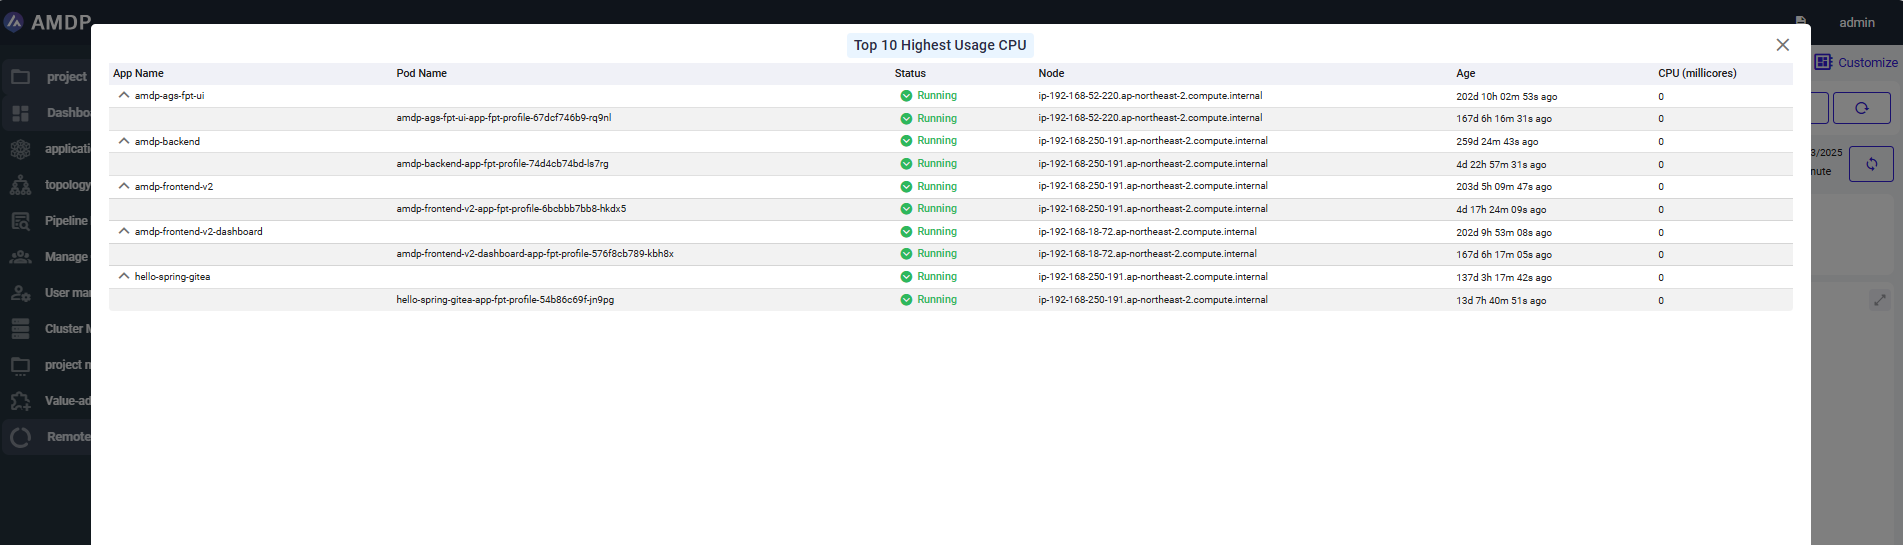
Click on “X” icon to close the report.
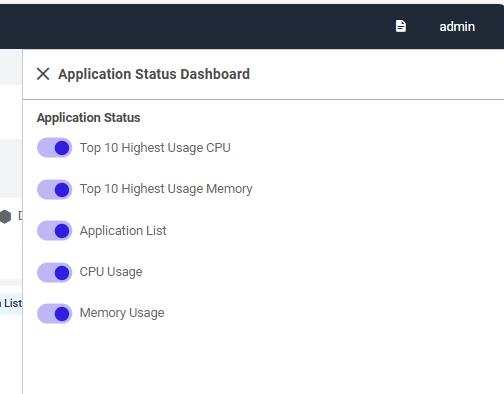
- Customize on which components displayed on the dashboard:
By click on button Customize on the top left of the screen, the specific metrics can be enable or disable to be displayed on the screen:
Key components
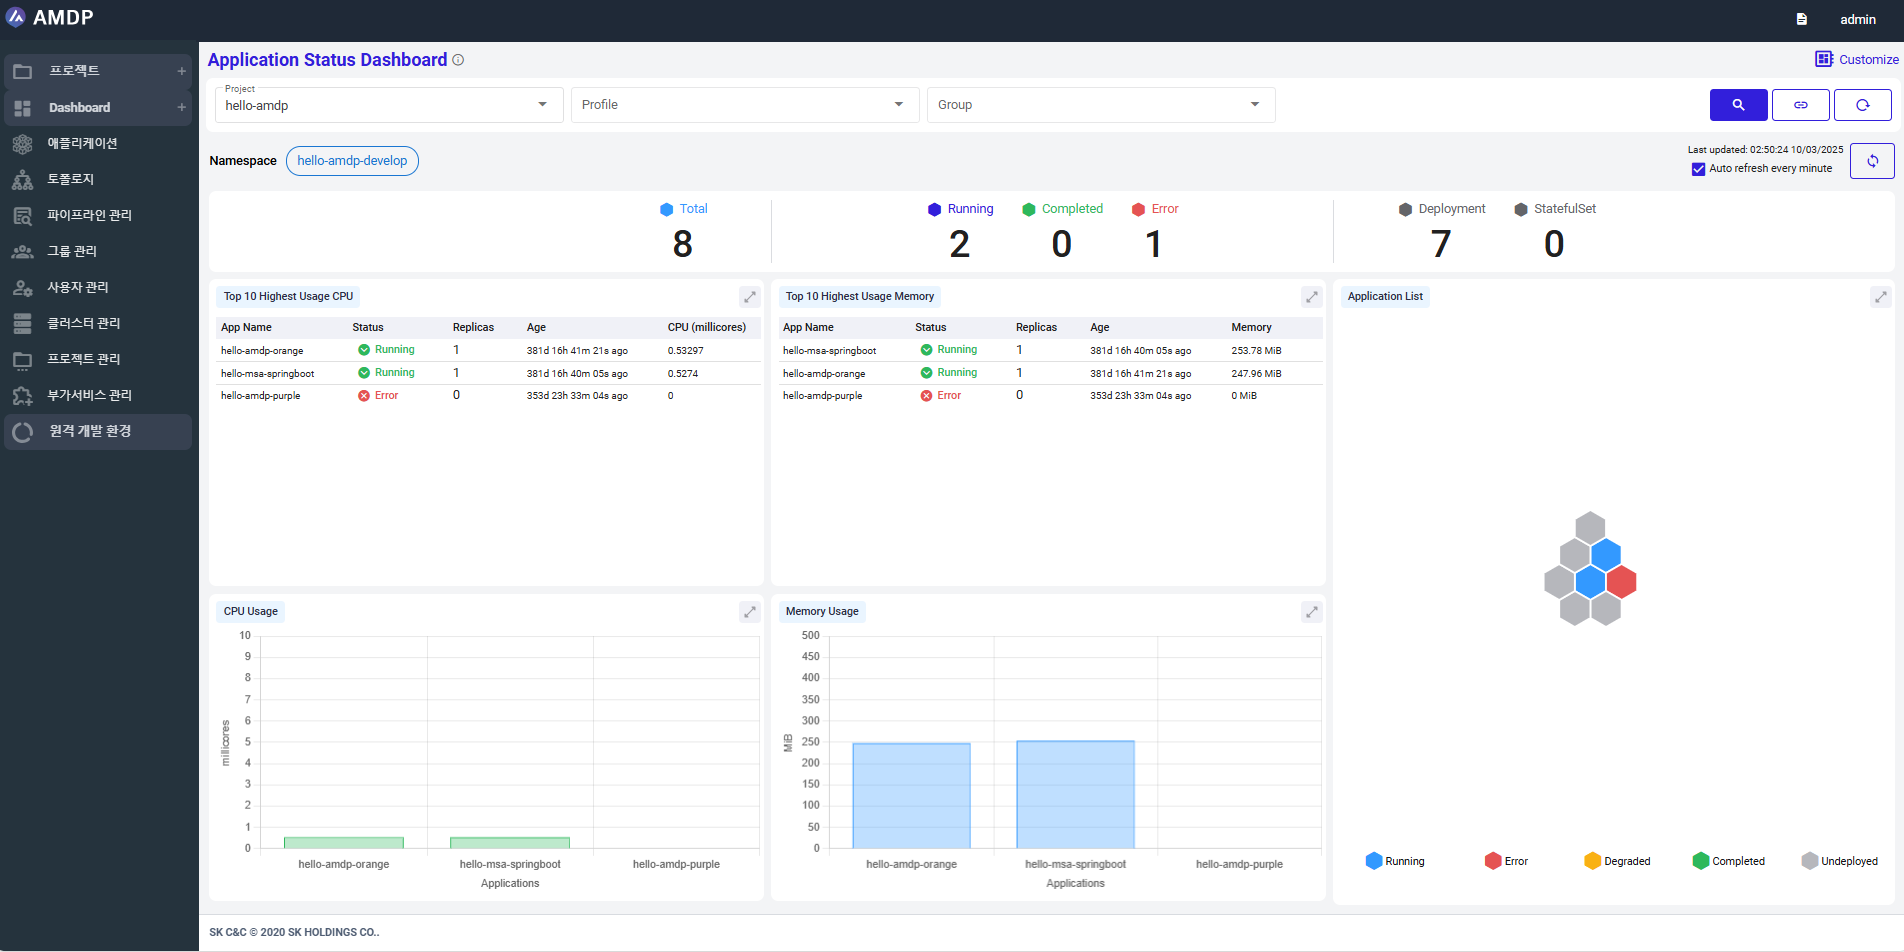
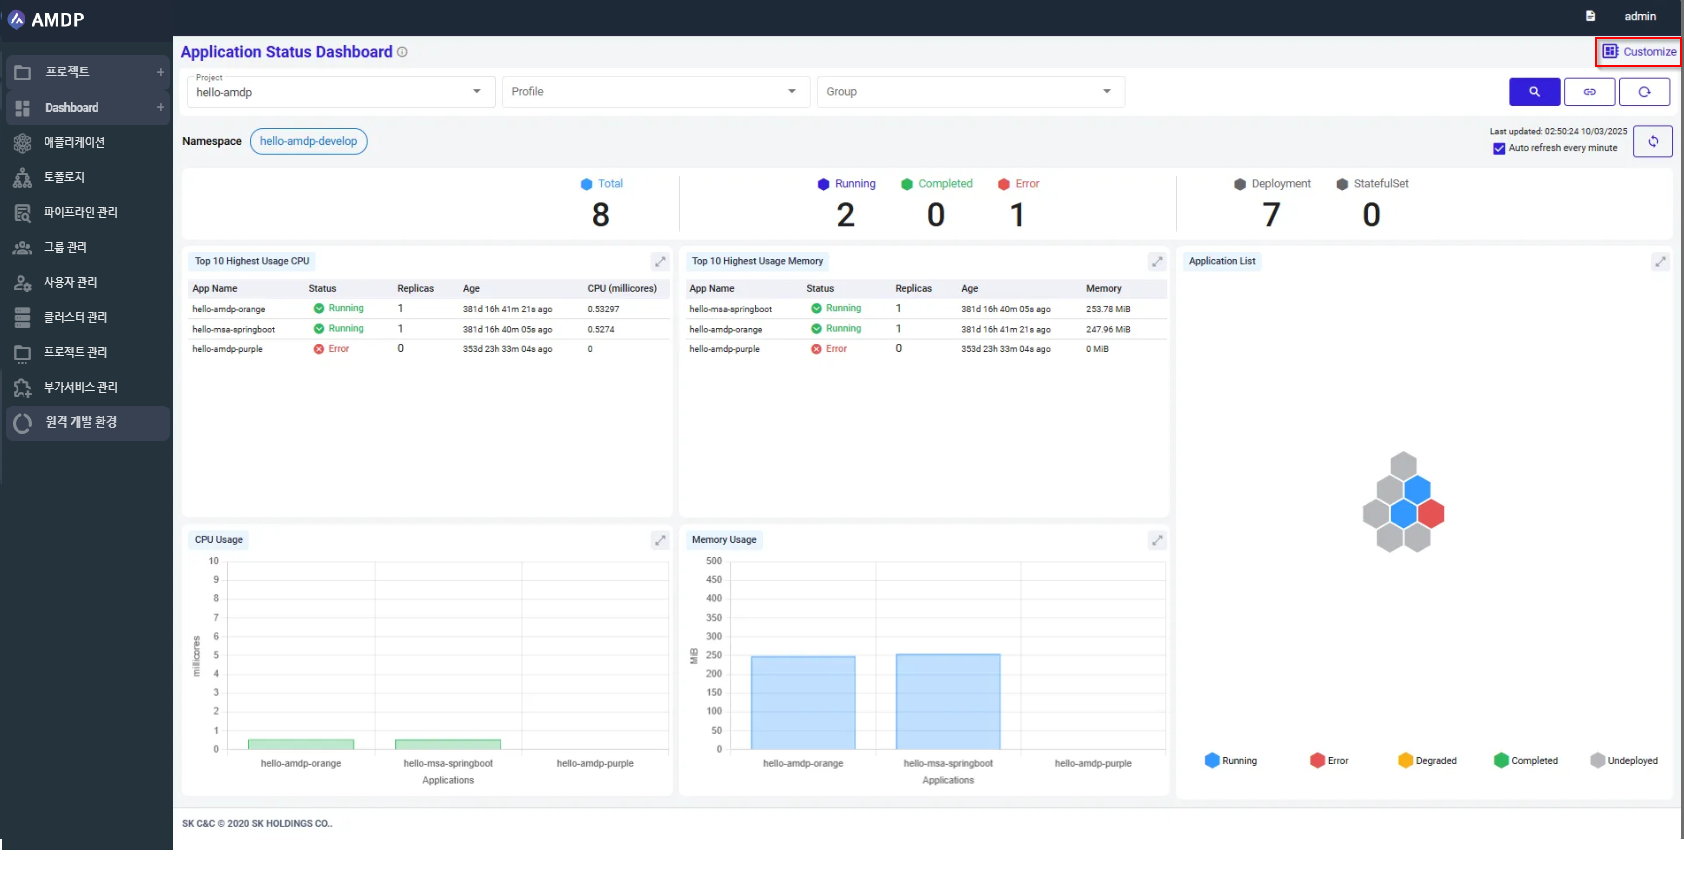
This dashboard provides visual insights into application status and resource usage, helping teams track application performance and stability. Key components of the dashboard include:
Total Applications: shows the total number of applications currently being monitored. Applications by Status as explained as below:
- Running - The number of applications currently running.
- Completed - The number of applications that have completed execution.
- Error - The number of applications where errors have occurred.
Deployment and Stateful Management: show two main stages of application:
- Deployment - Total number of deployed applications.
- StatefulSet - Total number of stateful applications.
Top 10 Highest Usage CPU: Displays the top 10 applications with the highest CPU usage, providing insight into resource consumption.
Top 10 Highest Usage Memory: Lists the top 10 applications with the highest memory usage.
CPU Usage Graph: A graph showing CPU usage in milli-cores for each application.
Memory Usage Graph: A graph displaying memory usage in MiB (Mebibytes) for each application.
Application Status Honeycomb View :A hexagonal visualization that provides a quick overview of each application's current status.