Code Analysis
The Code Analysis Dashboard is a tool for in-depth analysis of code quality, tracking metrics such as reliability, security, and maintainability to improve code quality and prevent potential issues proactively.
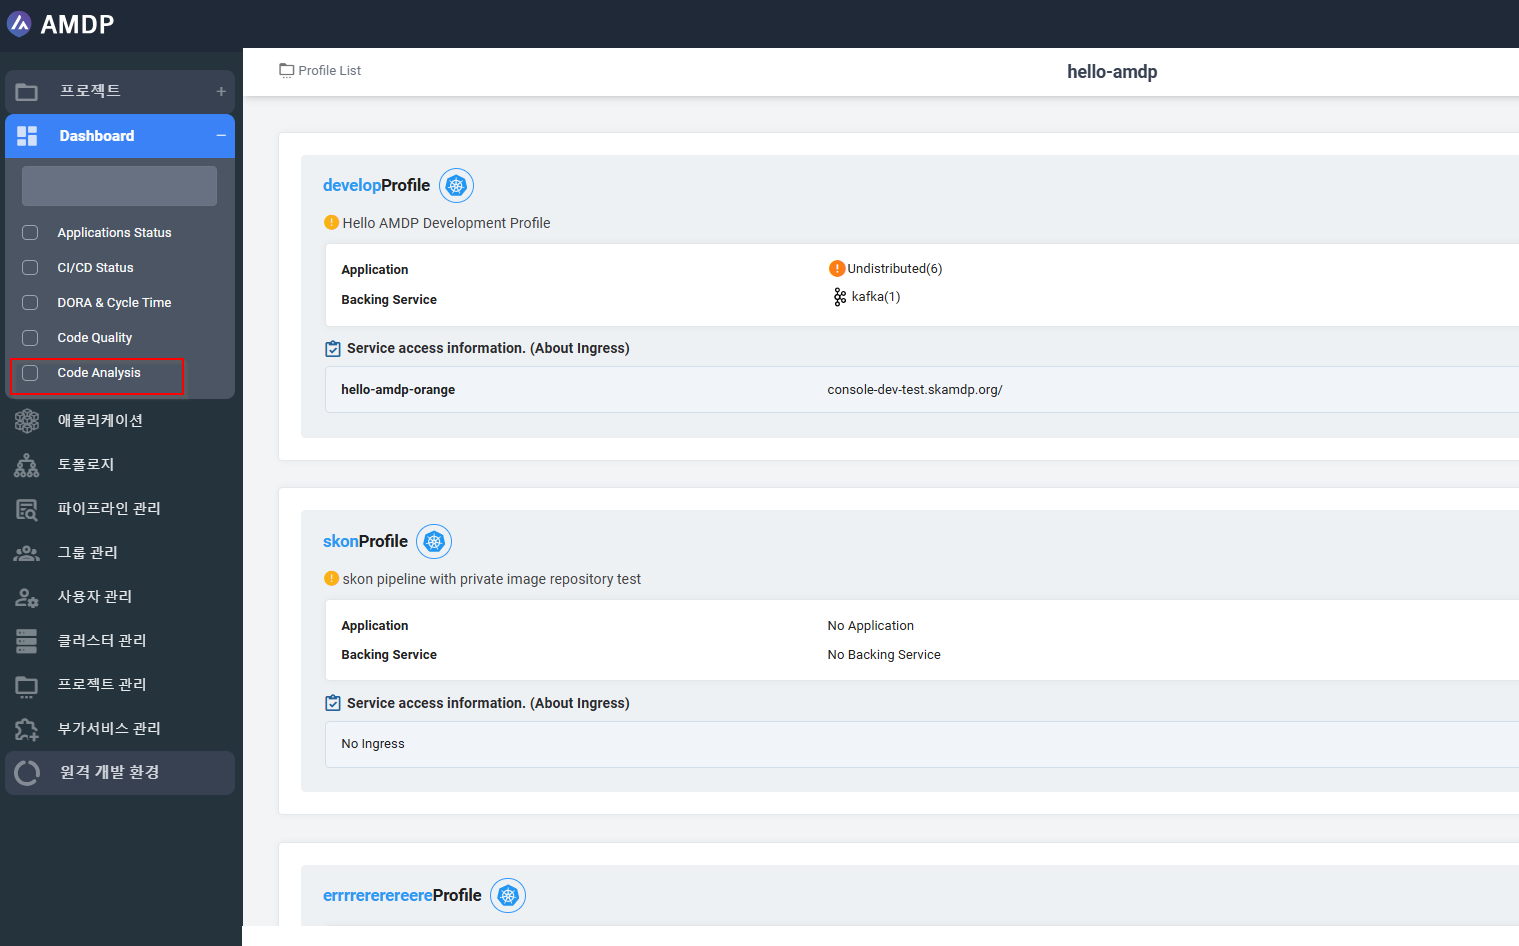
Code Analysis dashboard
From the Sidebar Menu, select the Dashboard/Code Analysis:
Key functions
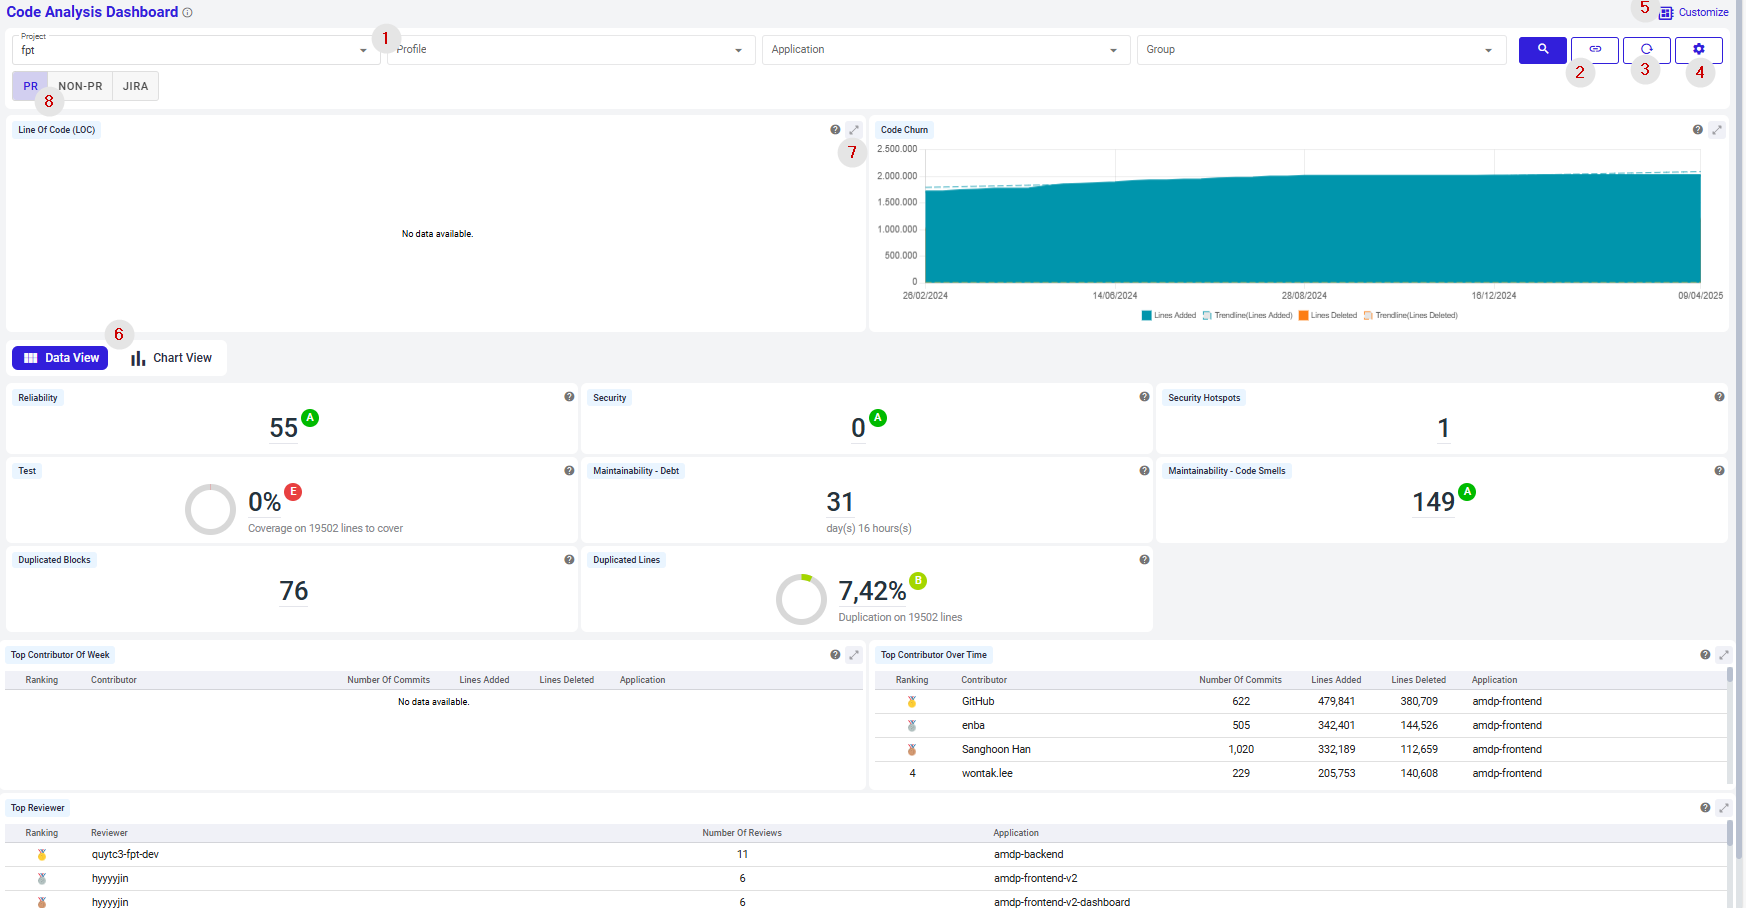
From the Code Analysis Dashboard, below actions can be performed:
-
Search for a report, which is:
- Filtered by Project
- Filtered by Project and Profile of project
- Filtered by Project and Profile and application of profile
- Filtered by Project and Group of project
- Filtered by Project and Profile, group of project
-
Copy URL of current Code quality dashboard.
-
Reset the dashboard:
When click on button Reset, all the data selected in terms of project, profile, application and group selected are reset.
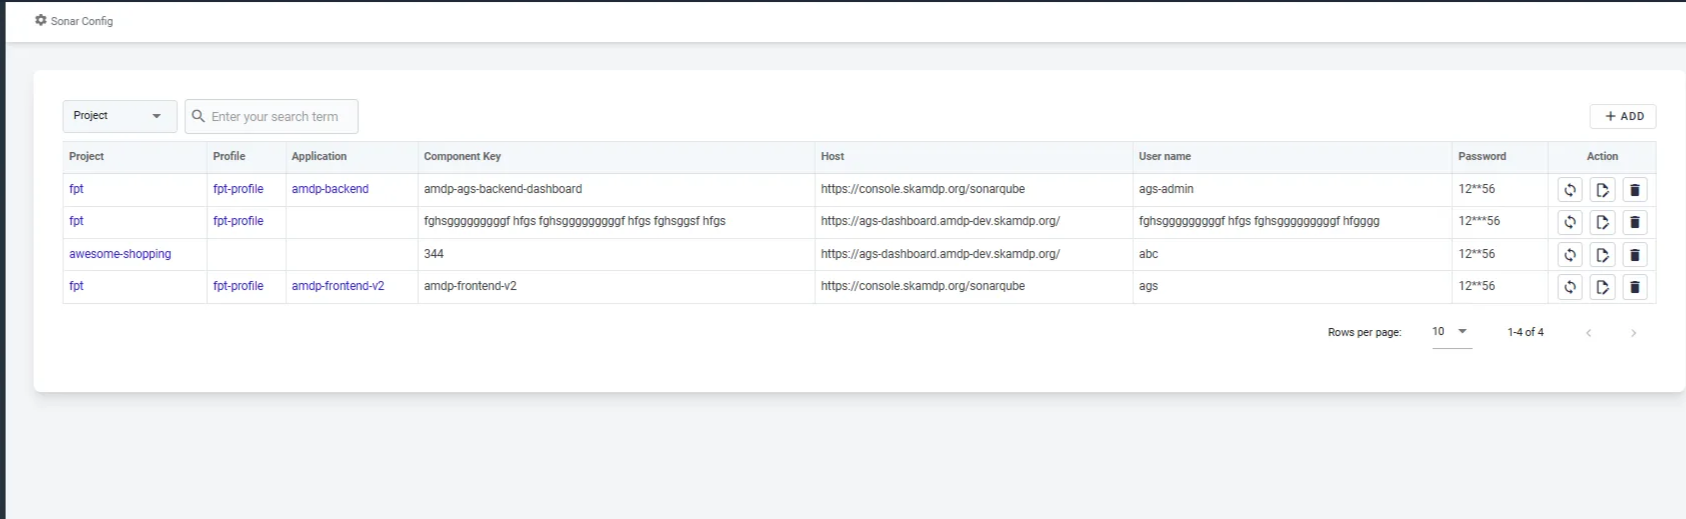
- Configure Sonar:
Allow user to navigate to Sonar Config screen, which allow user to view project detail, profile detail, application detail, create new config, fetch the sync manually, edit config and delete config.
- Customize the displayed report by enable or disable charts/tables
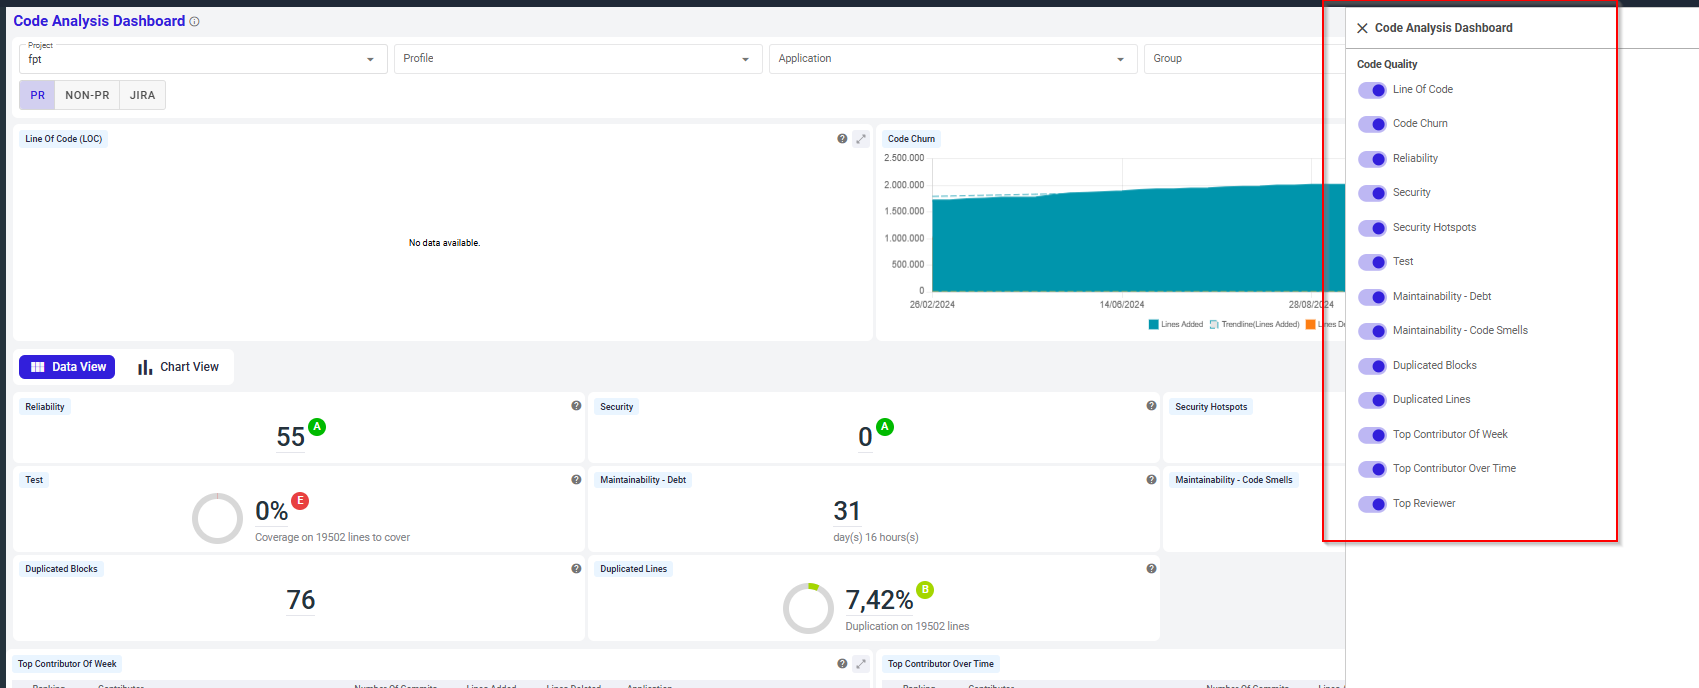
-
Switch the view mode between Data view and Chart view.
-
Expand a specific report chart on Dashboard.
-
Switch between PR (Pull Request) and Non-PR( Non Pull Request) mode:
With mode PR: board illustrates the data of commits from pull request, which are parts of a pull request workflow, typically used for code review before merging into the main branch.
With non PR: board illustrates the data of commits without pull request, these are direct commits (e.g., pushed directly to the main branch or another branch) not associated with any pull request.
By default, dashboard is displayed on PR mode.
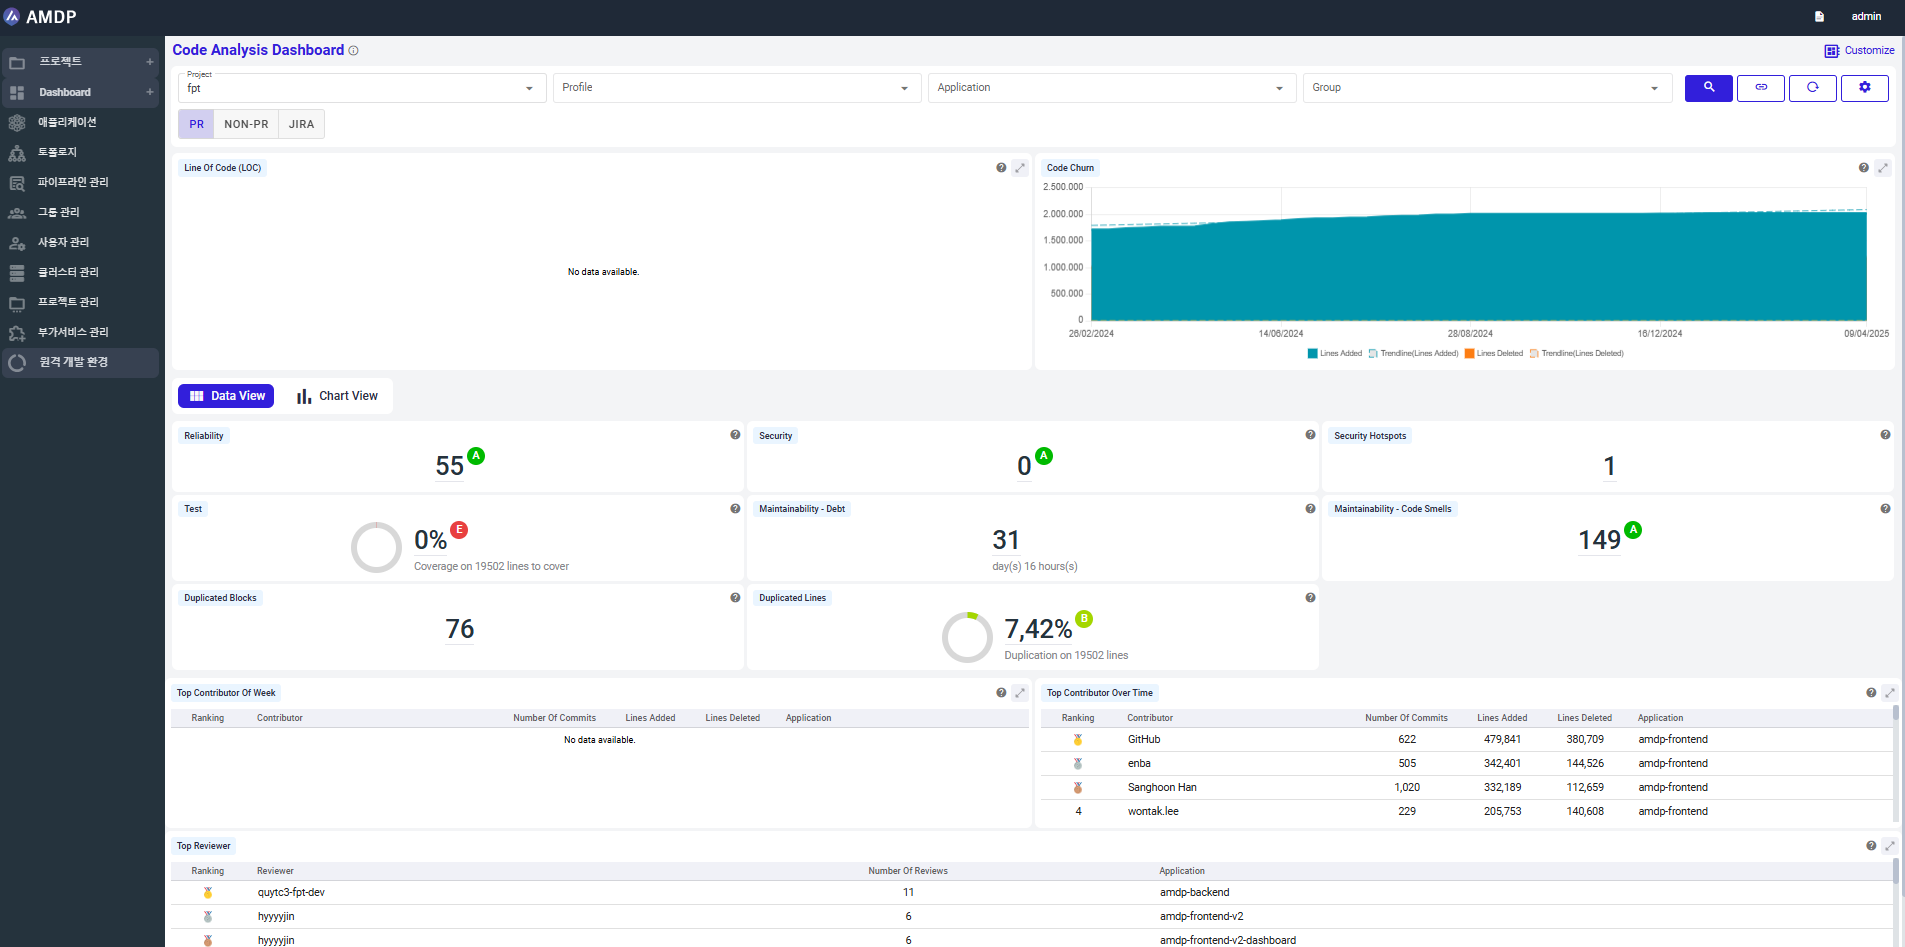
Key components
This dashboard provides key metrics necessary for assessing code quality, allowing developers to evaluate and improve the reliability, security, and maintainability of the codebase. Key components include:
Line of Code (LOC): Visualizes the trend of total lines of code in the codebase, helping monitor code growth.
An increase in LOC reflects the addition of new features or modifications, helping to understand changes in project scope or complexity.
- Y-axis (Lines of Code): Represents the total number of lines of code in the project.
- X-axis (Time): Shows the timeline, indicating the dates when code line measurements were taken.
Code Churn: Displays the lines of code added or deleted over time, indicating the frequency of code changes, in order to evaluate code stability and modification frequency.
High churn may indicate periods of active feature updates or refactoring. Monitoring this graph helps in efforts to maintain code stability.
- Y-axis (Changes): Represents the number of code changes, including additions, deletions, and modifications.
- X-axis (Date): Shows the dates when code changes occurred.
Reliability: Shows the number of bugs detected in the codebase, assessing code reliability.
This metric evaluates code reliability, with a higher bug count indicating lower stability. It helps identify areas in need of quality improvement.
Represents the total number of identified bugs. A decreasing trend in bug count indicates improving code quality.
Test Coverage: Represents the percentage of code that is covered by tests.
Test coverage is crucial for assessing code stability. Higher coverage means more code is tested, reducing the likelihood of unexpected bugs.
Duplicated Blocks: Shows the number of duplicated code blocks in the codebase.
Reducing code duplication improves readability and maintainability.
Security: Displays the number of potential security vulnerabilities, assessing code security.
This metric evaluates security risks, with fewer vulnerabilities indicating enhanced security. A higher vulnerability count implies a greater risk of data breaches or system compromises.
Security Hotspots: Shows the number of areas in the code that require security review
Helps identify potentially vulnerable areas in the code for review and mitigation to enhance security.
Maintainability - Debt: Indicates the estimated time (in days) required for future maintenance of the codebase.
Technical debt reflects long-term maintenance burden, with a higher value indicating more areas needing improvement.
Maintainability - Code Smells: Shows the total number of code smells, which hinder code maintainability.
Reducing code smells improves code quality and eases maintenance.
Duplicated Lines: Displays the percentage of duplicated lines, identifying areas that may need refactoring.
Lower duplication percentage eases maintenance and improves code efficiency.
Top Contributor of Week: Shows the top contributor for the week based on code commits.
Lower duplication percentage eases maintenance and improves code efficiency.
Top Reviewer: Lists the most active reviewers in order of activity.
Code reviews are vital for maintaining and improving code quality; highlighting frequent reviewers encourages contributions to quality control.
Top Contributor Over Time: Shows top contributors over time, helping track changes in contribution trends.
Tracks long-term contributions to identify sustained involvement and encourage performance.