Application CICD Execution Results Inquiry
Application CICD Execution Results Inquiry
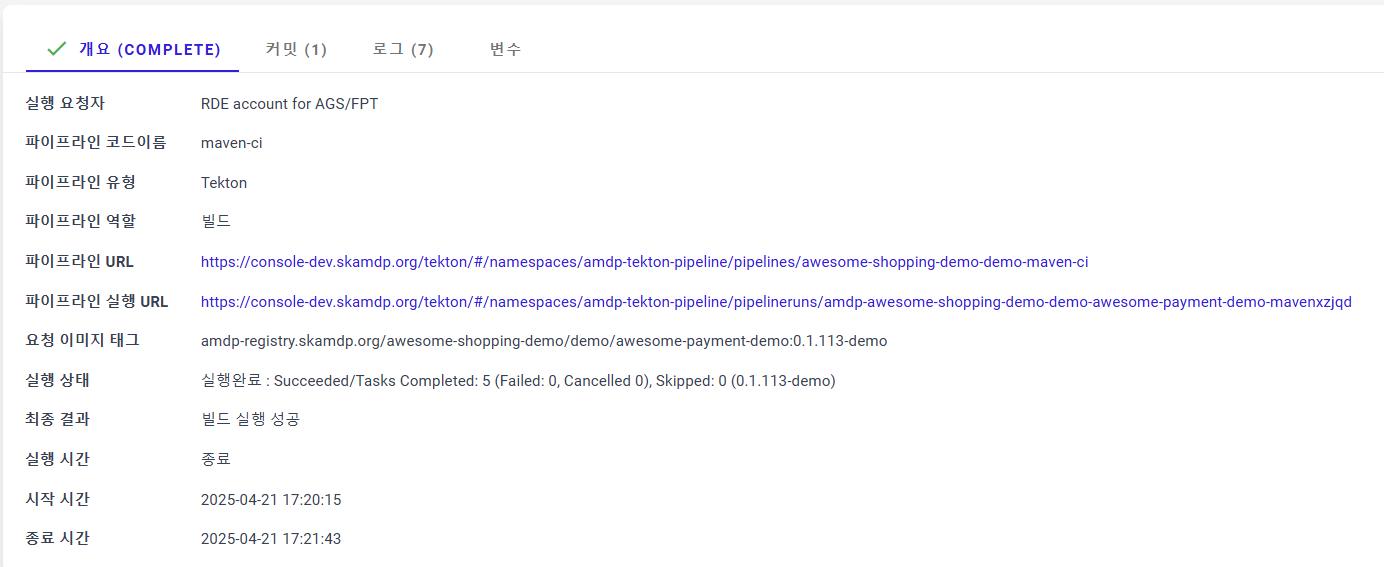
In the pipeline execution screen, clicking the magnifying glass icon allows you to view detailed information about that pipeline execution. For completed pipelines, you can view overall information about the execution process as shown below. You can check success or failure messages and view commits and logs applied to the build by switching tabs.
Pipeline Execution Control
A currently running pipeline execution is displayed as shown below, and users can take additional actions.
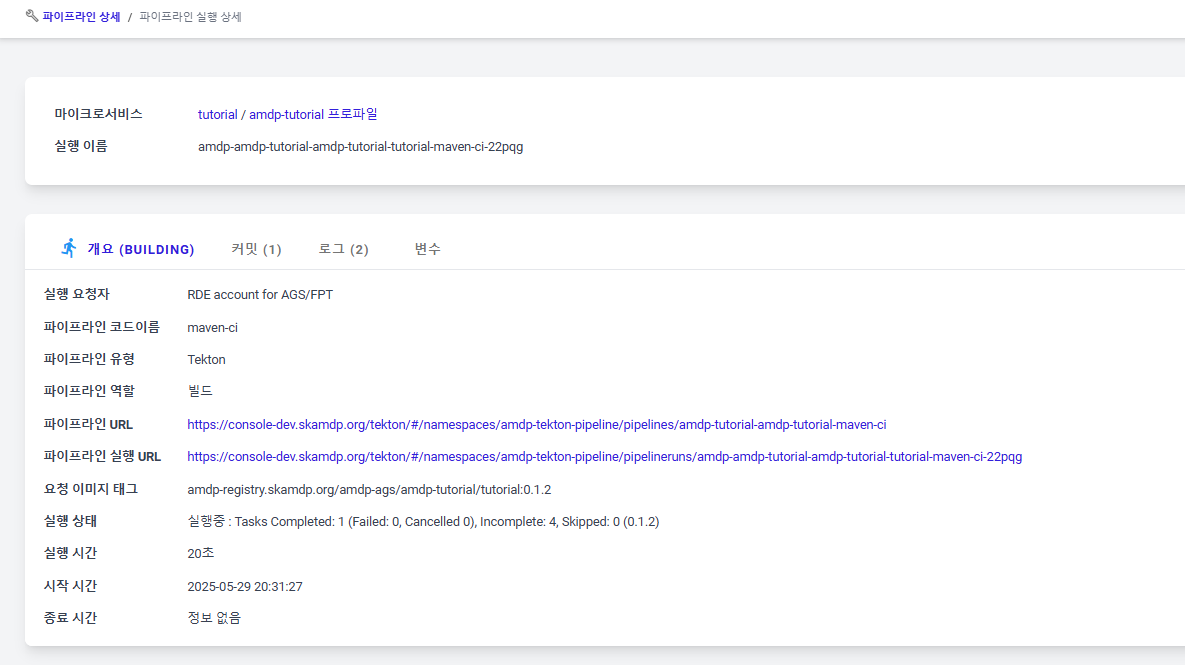
Stop Execution Check Button : Use this when you cannot cancel the execution due to unknown reasons. The pipeline continues to run, but the AMDP system no longer tracks its progress.

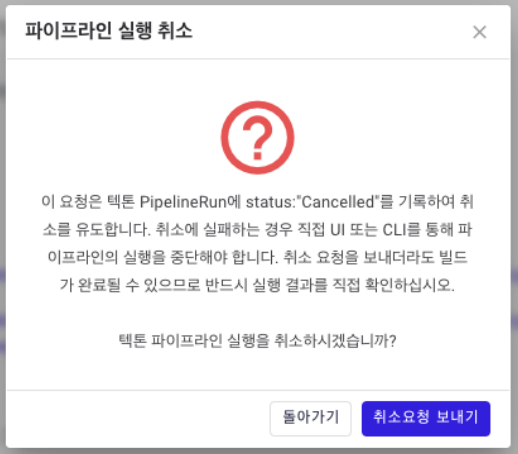
Execution Cancel Button : Requests the pipeline tool (Tekton or Jenkins) to cancel the pipeline execution.
③ Refresh Button : Refreshes the execution status and re-queries the log.
Pipeline Execution Detail - Overview
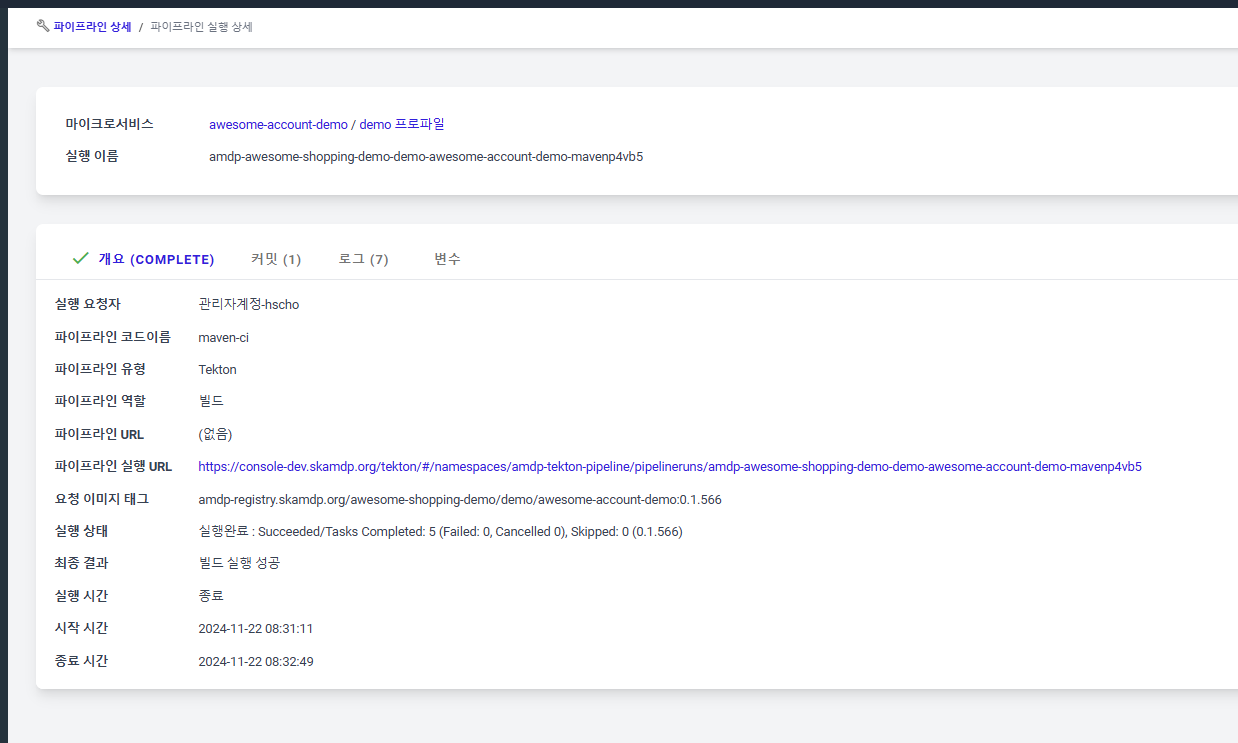
Overview Tab: The Overview tab displays general information about the pipeline execution.
- The top section summarizes information about the pipeline execution steps. It shows the step name, success status, and execution time, which helps identify which step took the most time.
- Execution Requester : Displays the display name of the user who triggered the pipeline or indicates if the execution was triggered by a webhook or a schedule.
- Pipeline Code Name : The name of the pipeline code registered in the application pipeline settings.
- Pipeline Type: Indicates whether it is Tekton, Jenkins, or ArgoCD.
- Pipeline Role: Indicates whether it is a build or deployment pipeline.
- Pipeline URL: A link to the web address of the pipeline itself, if available.
- Pipeline Execution URL: A link to the detailed execution information of the pipeline. It allows you to view detailed logs and execution data provided by the actual pipeline tool.
- Image Tag: The container image value used for the build or deployment.
- Execution Status: Shows whether the pipeline is running or has finished.
- Final Result: Displays when the pipeline has completed, indicating whether the execution was successful or ended with an error during execution.
- Execution Time / Start Time /End Time : Displays the pipeline's execution, start, and end time information.
- Sequential Execution (Follow-up) : Links to the detailed information of the subsequent deployment pipeline executed after the build pipeline and vice versa.
Pipeline Execution Detail - Commit
The Commit tab displays git commit information applied to the build. If the Jira addon is defined, it automatically converts issue keys in commit messages into Jira URLs.

- Commit Hash : Displays the SHA1 hash value of the applied commit.
- Author : Shows the user's name stored in AMDP based on the email information in the git commit.
- Commit Message : Displays the commit message from git. Converts Jira keys to issue links if the Jira add-on service is added.
Pipeline Execution Detail - Log
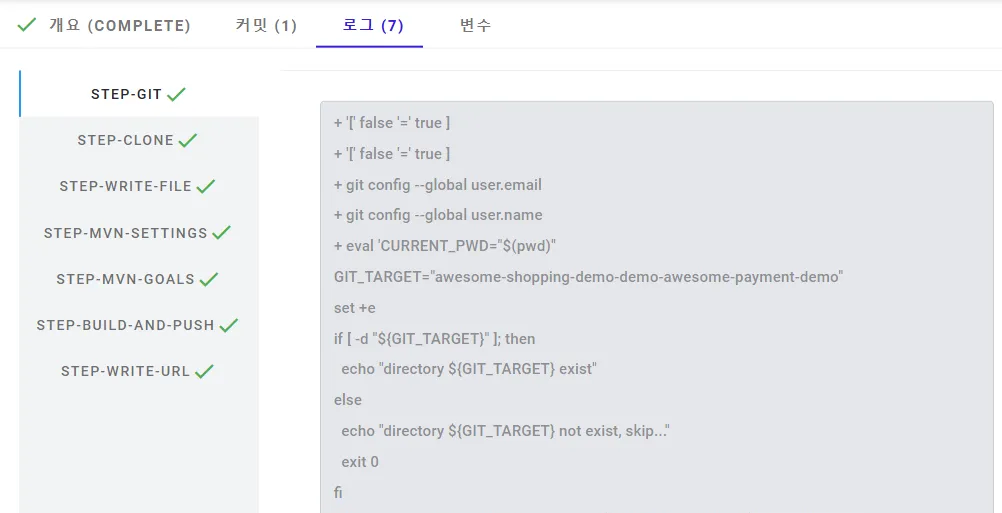
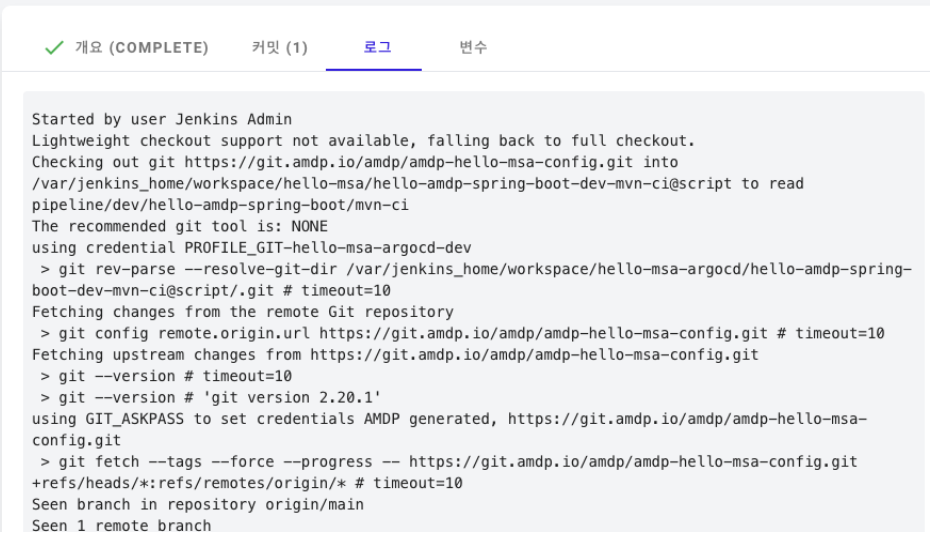
The Log tab allows you to view logs output by the pipeline tool. For more detailed information, use the link in the Overview tab. Tekton logs are separated by step and can be viewed in vertically divided tabs.
Jenkins logs display the entire execution process.
Pipeline Execution Detail - Variables
The Variables tab shows the variable information applied during pipeline execution. Each application pipeline can inject different variables to create a container image for the respective application.
If a variable contains more than one line of text, its value is displayed in a larger box.
