4. Monitoring & Logging
Monitoring Dashboard
Users with project permissions can check information about the containers within the project.
Click the Monitoring button in the left navigation panel.
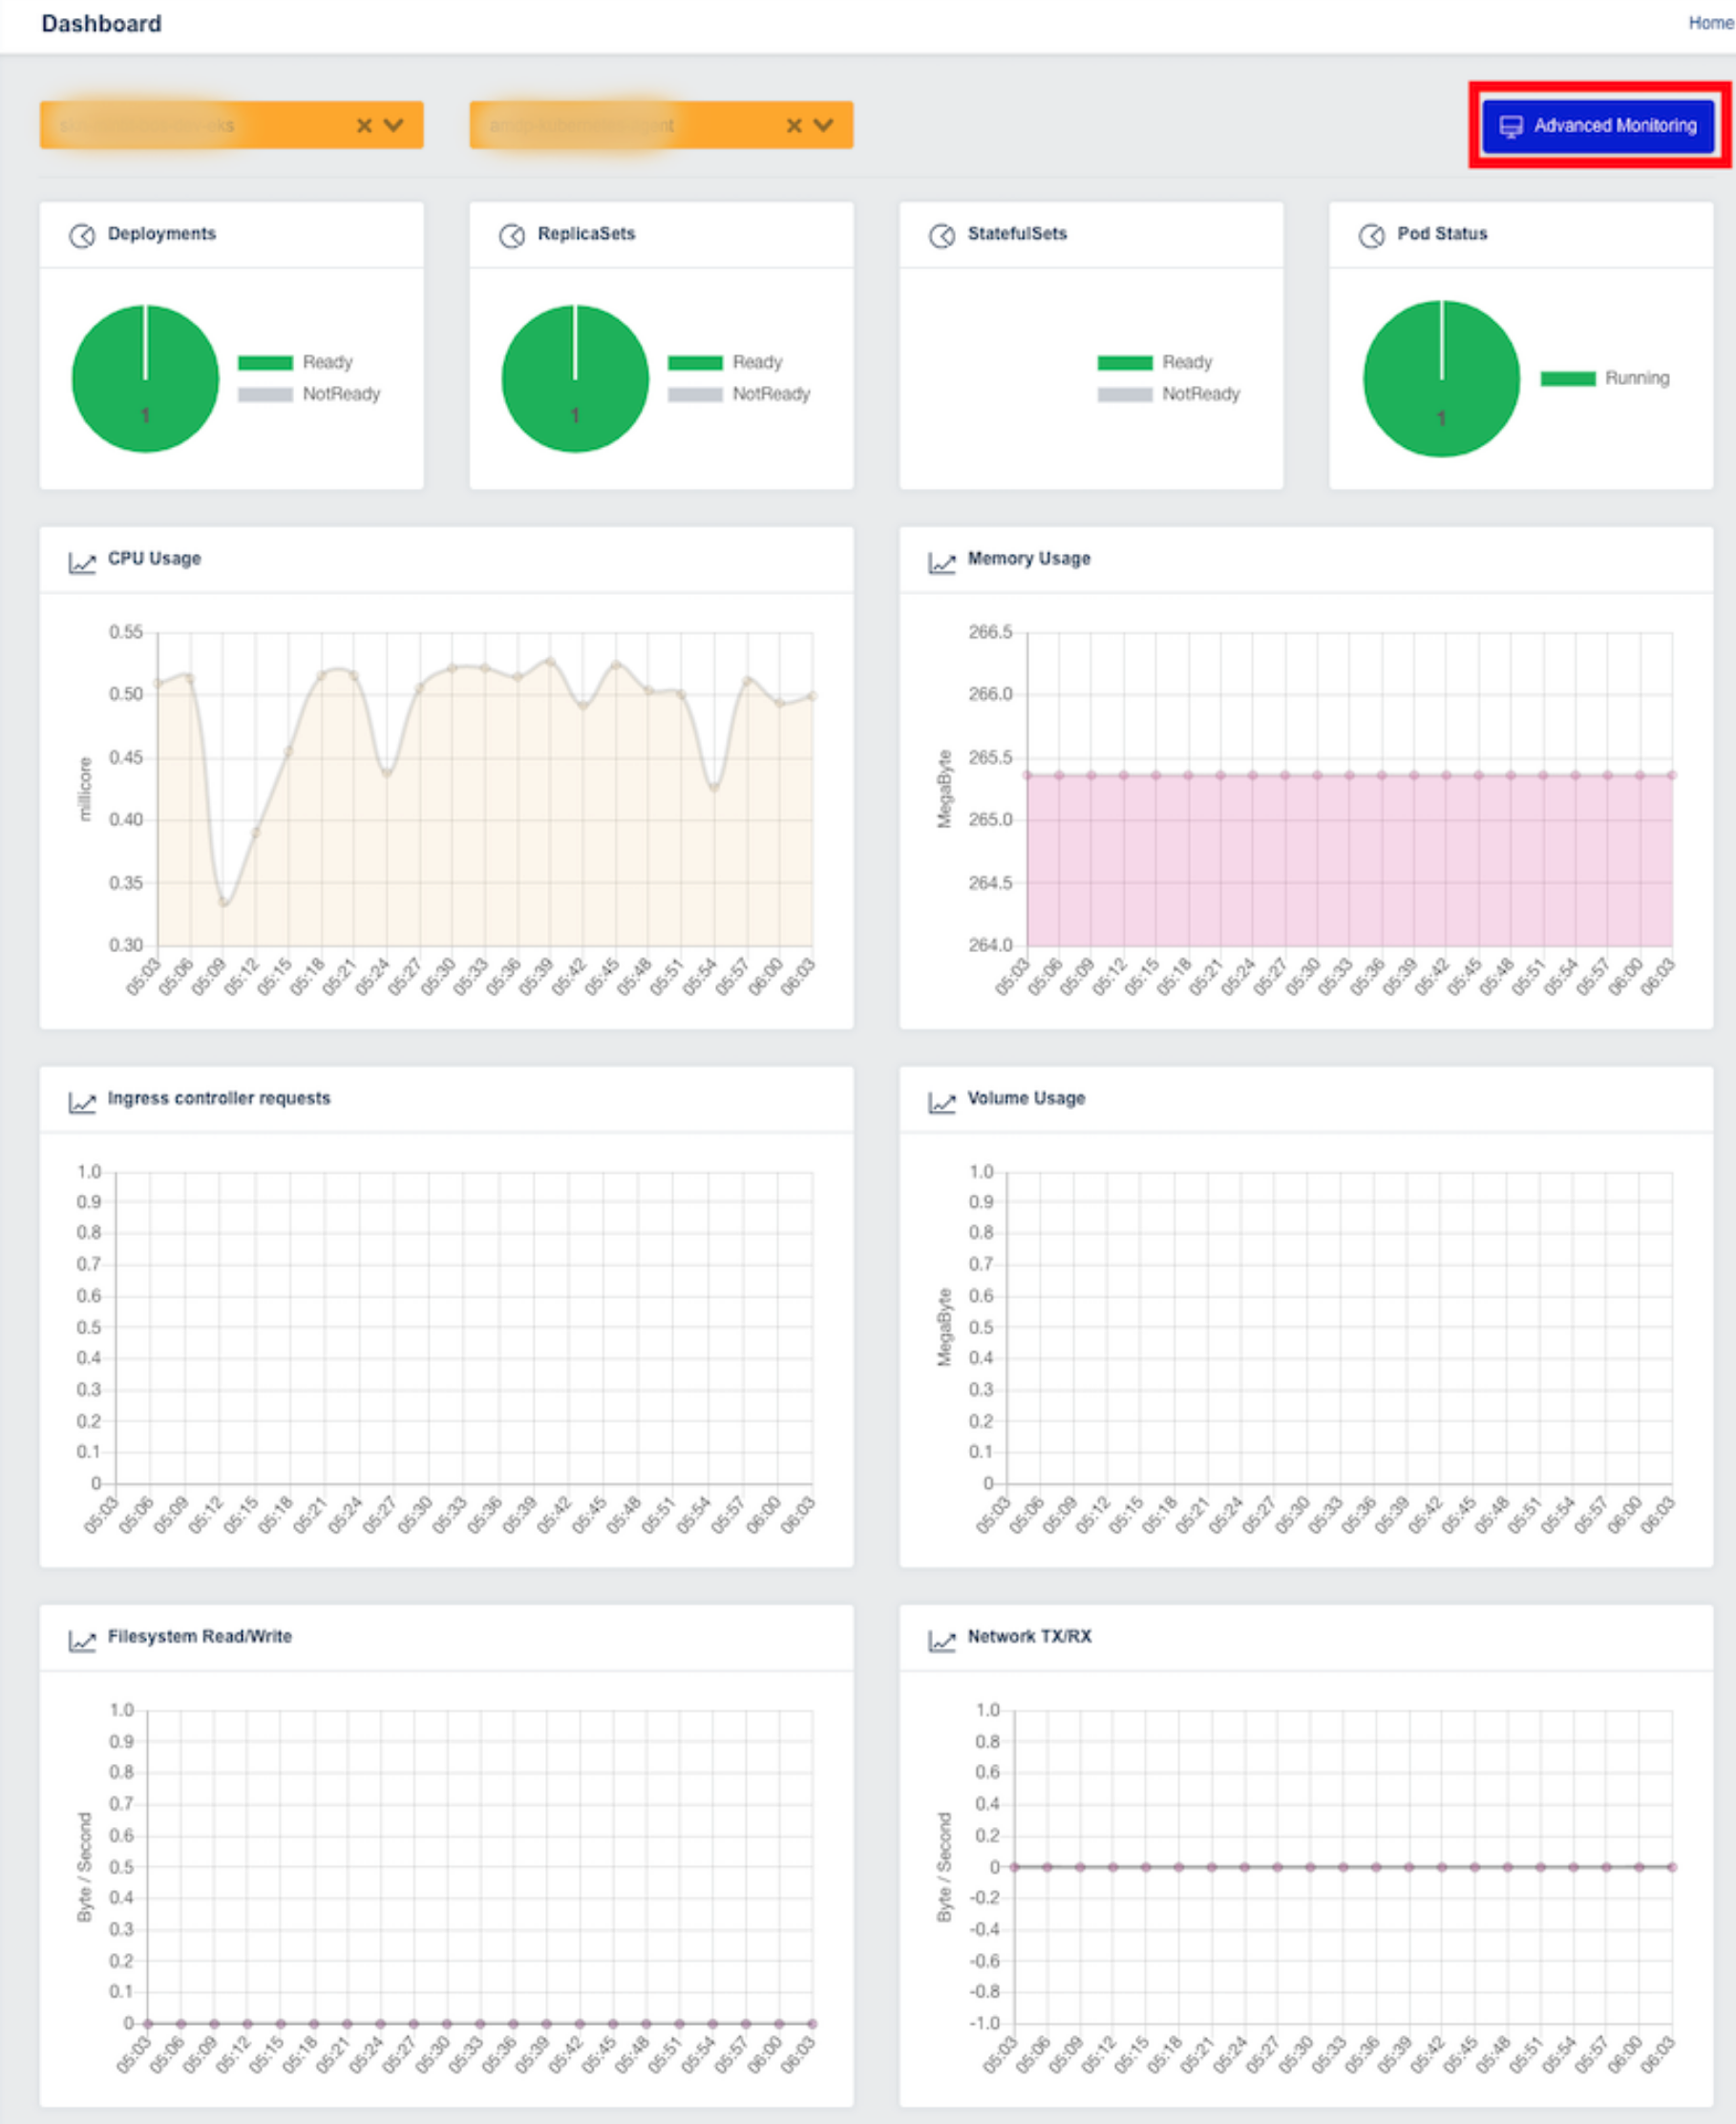
In the Monitoring screen, you can check CPU, Memory usage, File-system, and network I/O, as well as monitor storage usage and the status of Ingress Controller requests through graphical representations.
| Panel | Description |
|---|---|
| Deployment | Number of Available / Unavailable Deployments in the selected Cluster and Namespace |
| ReplicaSets | Number of Ready / NotReady ReplicaSets in the selected Cluster and Namespace |
| StatefulSets | Number of Ready / NotReady StatefulSets in the selected Cluster and Namespace |
| Pod Status | Number of Pods in the selected Cluster and Namespace by status (Failed / Pending / Running / Succeeded) |
| CPU Usage | CPU usage of Containers in the selected Cluster and Namespace |
| Memory Usage | Memory usage of Containers in the selected Cluster and Namespace |
| Ingress controller requests | Number of requests to the Ingress controller in the selected Cluster and Namespace |
| Volume Usage | Usage of PVC (Persistent Volume Claim) in the selected Cluster and Namespace |
| Filesystem Read/Write | Filesystem Read/Write usage in the selected Cluster and Namespace |
| Network TX/RX | Network TX/RX usage in the selected Cluster and Namespace |
For more detailed information, click the Advanced Monitoring button in the top-right corner to access Grafana.
Access Monitoring Metrics on Grafana
When accessing through the Web Console, you will be logged in automatically.
If accessing through a web browser via the Grafana Domain URL, you can log in using the same Cloud Z CP account credentials.
Example URL: https://REALM_NAME-monitoring.REALM_NAME.cloudzcp.net/
Change Organization
Grafana organizations are distinguished by project units registered in the Web Console.
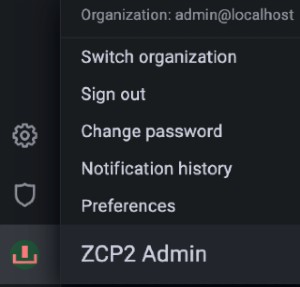
Click the icon in the bottom-left corner of Grafana to see account information and related menus.
Select the Current Org menu to switch organizations.
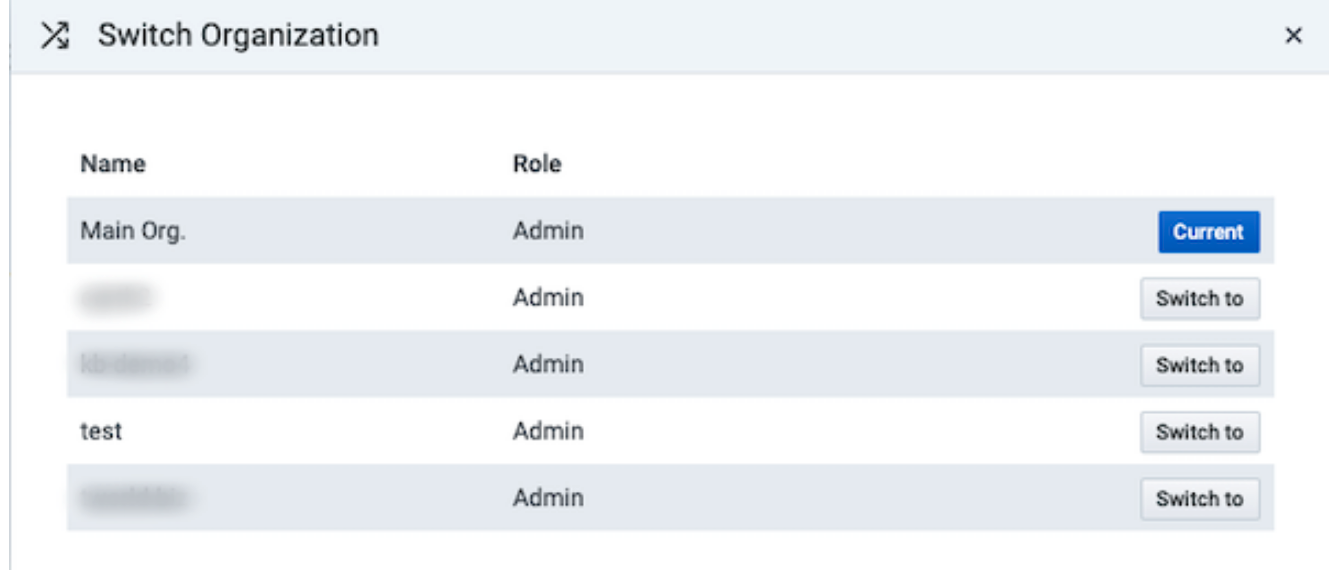
In the Switch Organization popup, the current organization is marked with Current.
Click the Switch to button for the organization you want to switch to.
Dashboard
You can monitor collected metric data through dashboards.
Click the Dashboard icon on the left and go to the Browse tab.
The available dashboards may vary depending on permissions and organization.
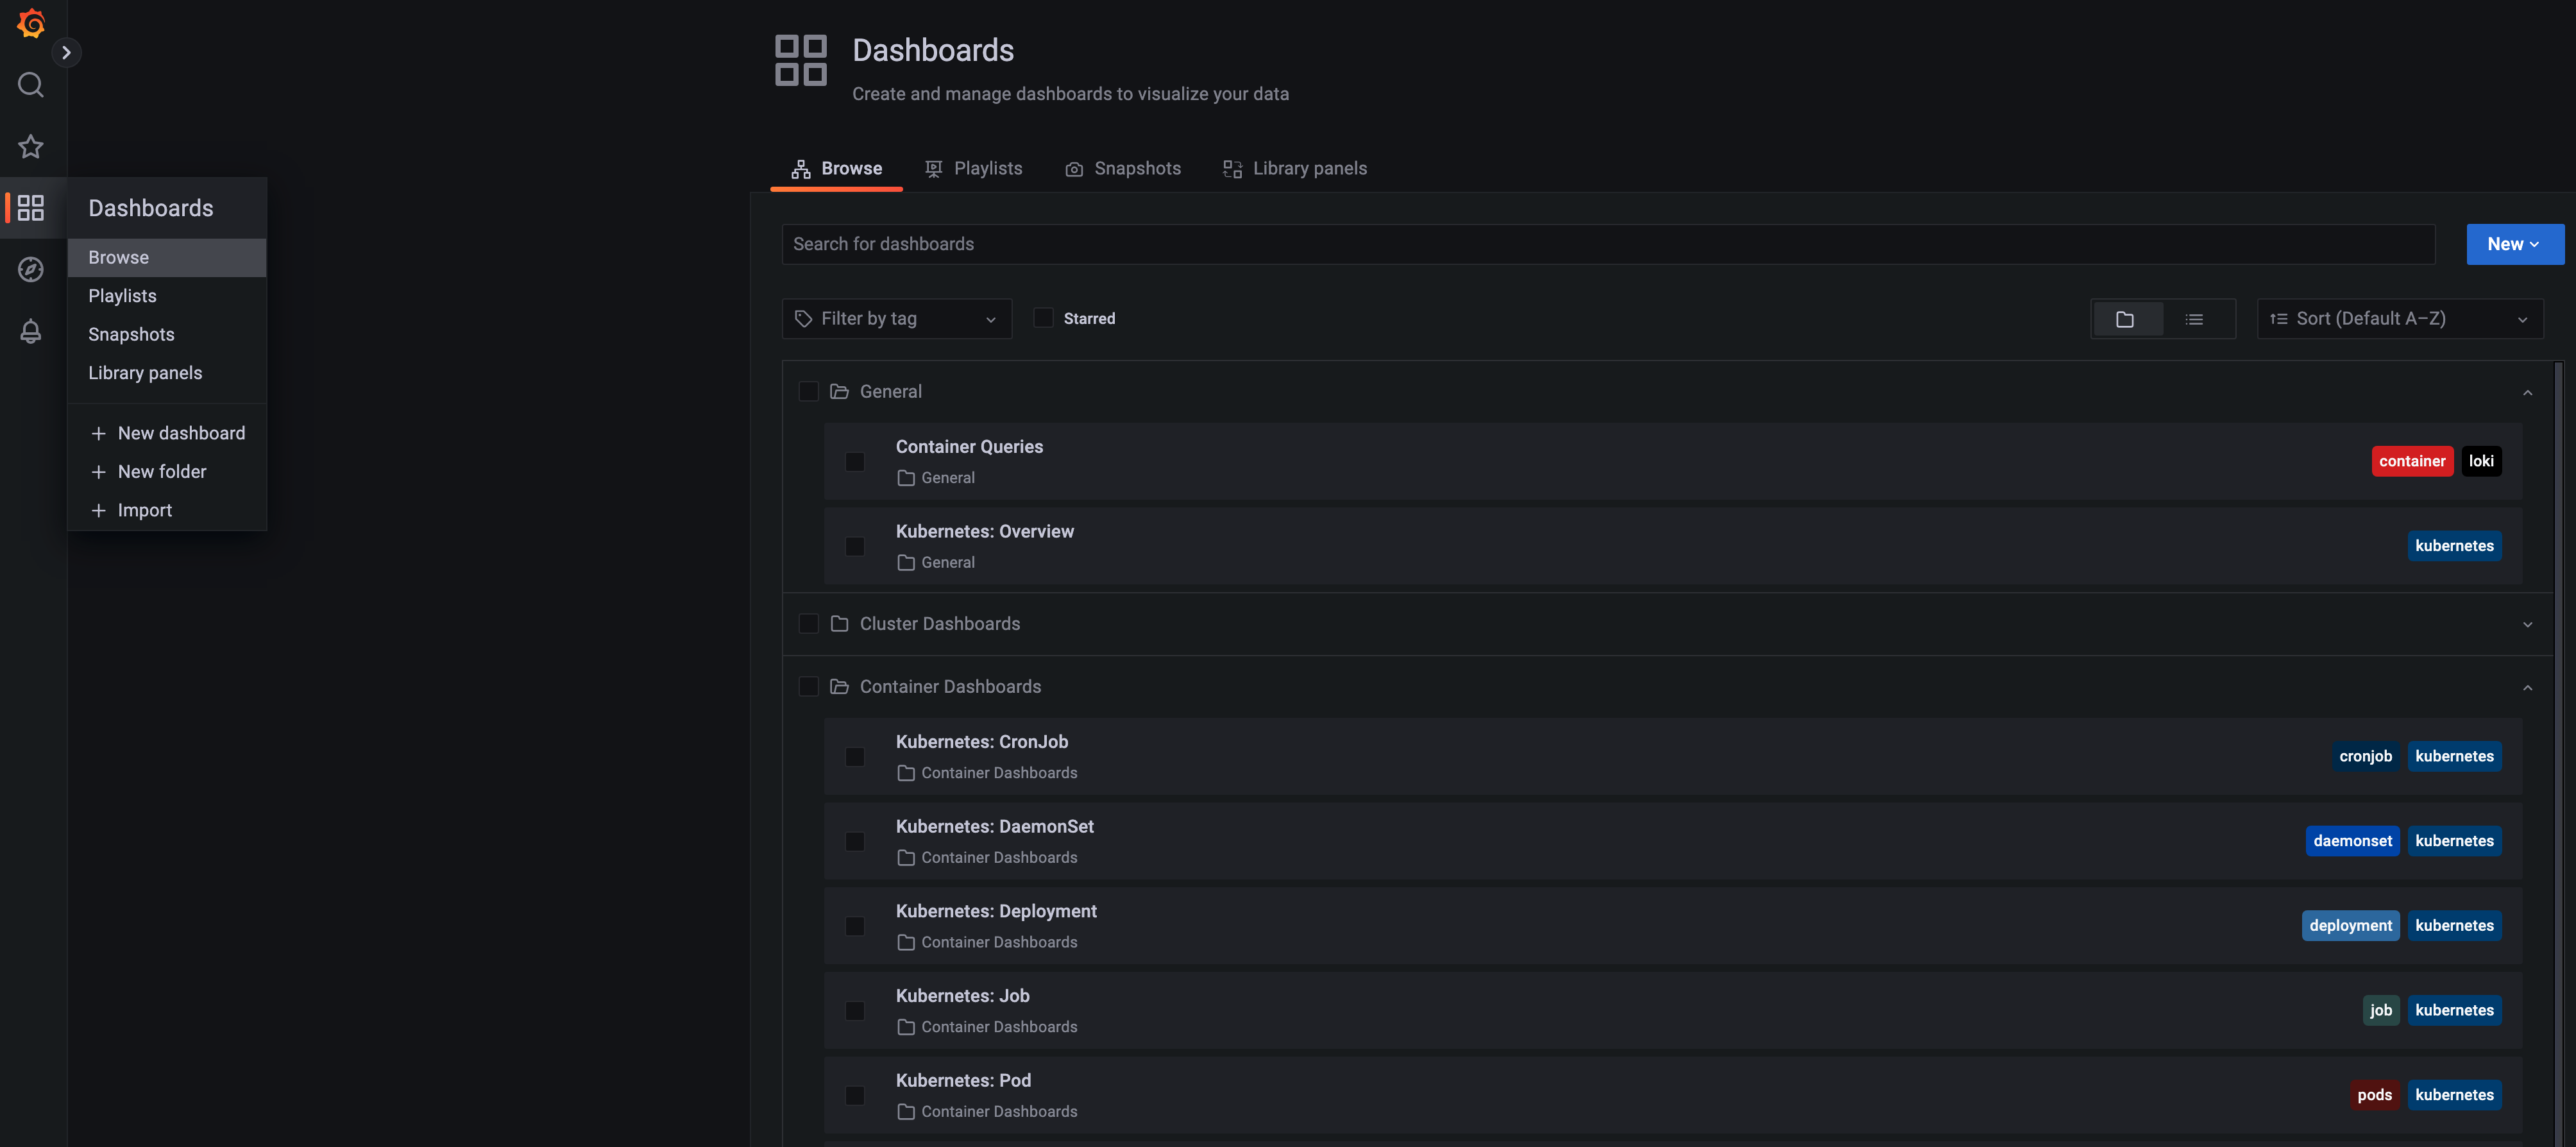
Click on the Kubernetes: Deployment dashboard as an example:
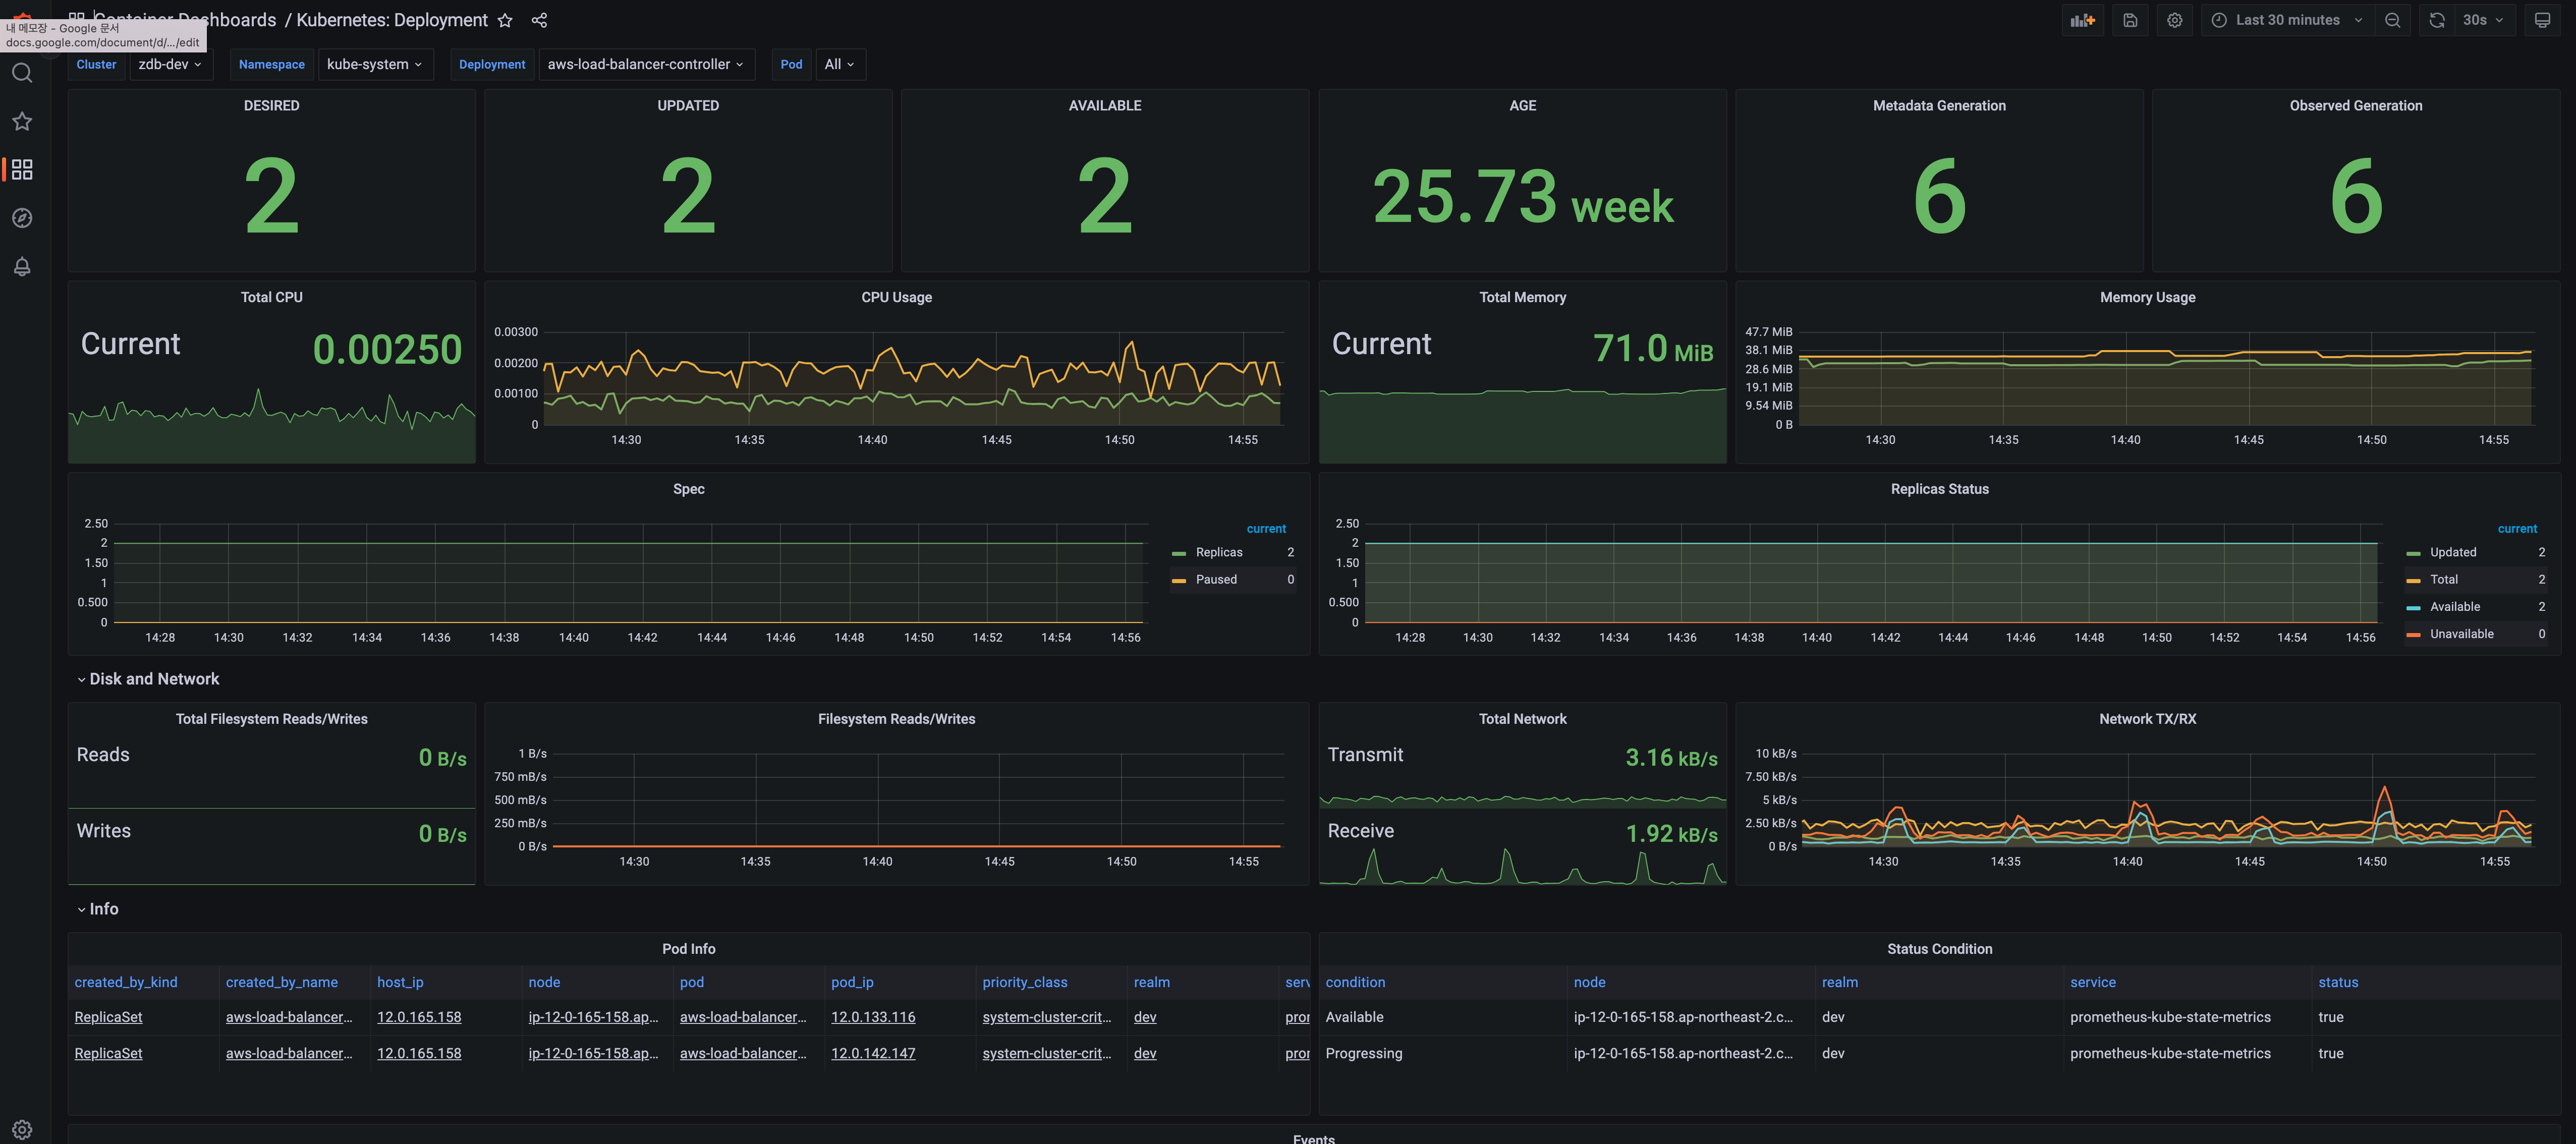
You can set the search period and refresh interval in the top-right corner.
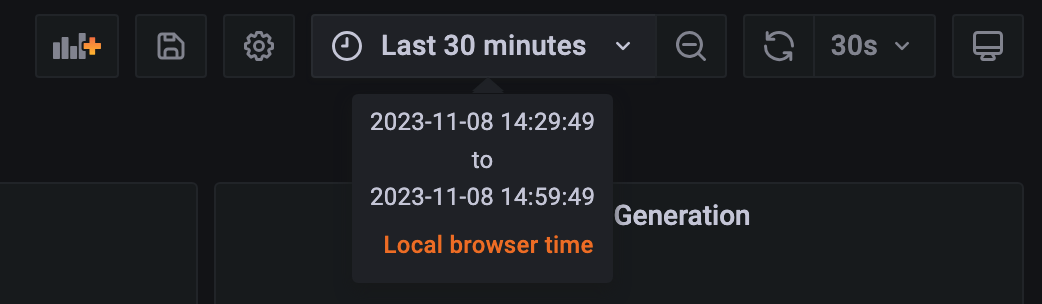
Hover over the time range (default: Last 1 hour) to see the current search period.
Click the time field to open a popup for configuring the search period.
You can choose an Absolute time range or Relative time range.
The field to the right allows you to select the refresh interval.
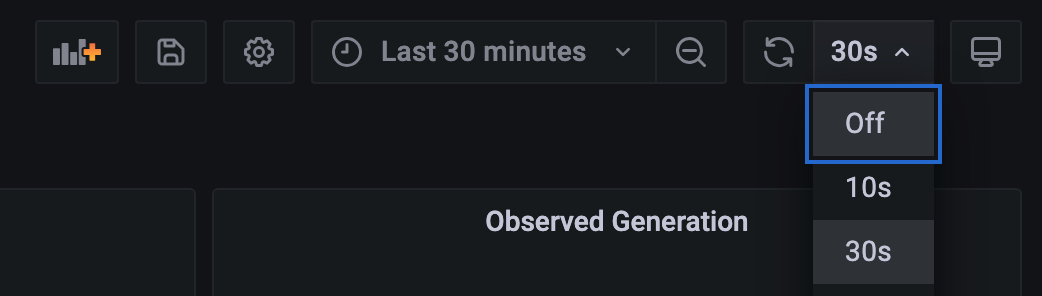
Clicking the refresh icon (default: 10s) lets you set how frequently metrics refresh.
The top option, Off, disables auto-refresh, while other options range from 5 seconds to 1 day.
Selecting a refresh interval applies the chosen setting.
Dashboard Types
For more information about Dashboard Types, please refer to the Grafana Monitoring Dashboards page.
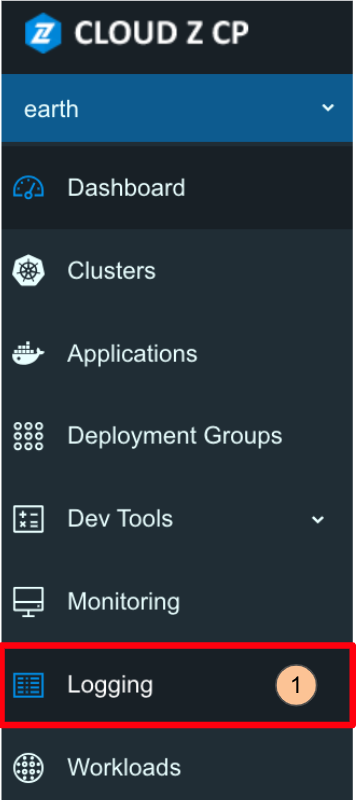
Access Logs on OpenSearch Dashboard
ZCP supports OpenSearch Stack as a logging tool. You can access stored log data by clicking the Logging menu.
Change Tenant
Tenants are categorized by the project units created in the ZCP web console.
Before querying logs, let's change the tenant.
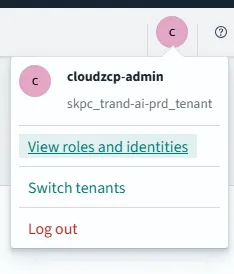
Click the icon in the top-right corner of OpenSearch Dashboards to display information and related menus for the logged-in account.
From these, select the Switch tenants menu to change the tenant.
- Click the icon displayed as
cin the top-right corner (the English text in the captured image may vary depending on the logged-in account) and click the Switch tenants button.
-
Select Choose from custom from the available tenant types.
- global: A public tenant accessible to all users.
- Private: A tenant accessible only to the logged-in user.
- Choose from custom: Allows selecting custom tenants that the logged-in account has access to (Projects accessible by the logged-in account).
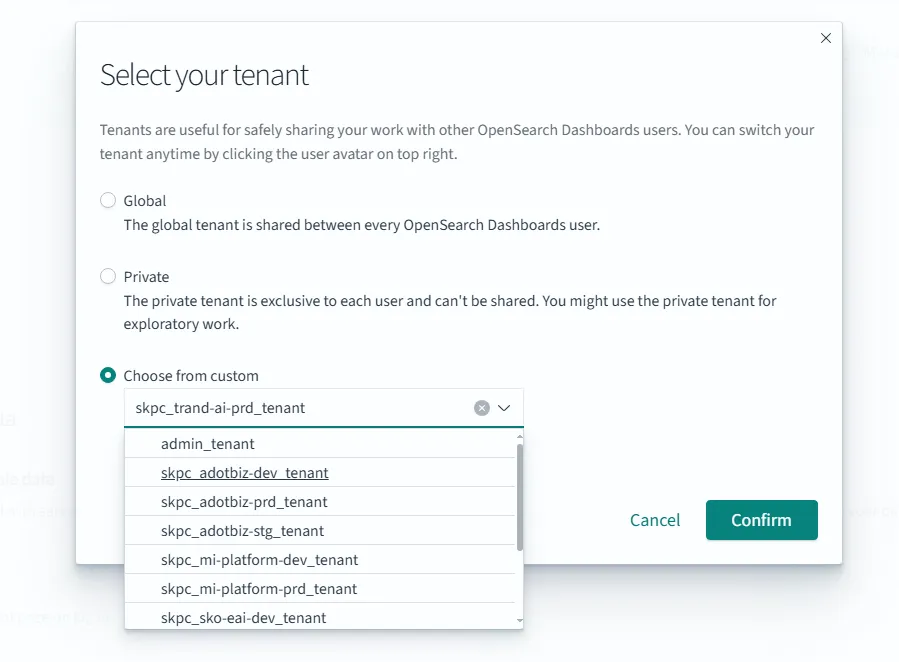
-
Click the previously created project,
dev_demo_tenant(the project name may vary for each user). -
Click Confirm to change the tenant.
Discover
This screen allows you to query logs. You can check the logs of the application deployed in the previous step. (Reference: Discover Guide)
Log storage indexes are created per project:
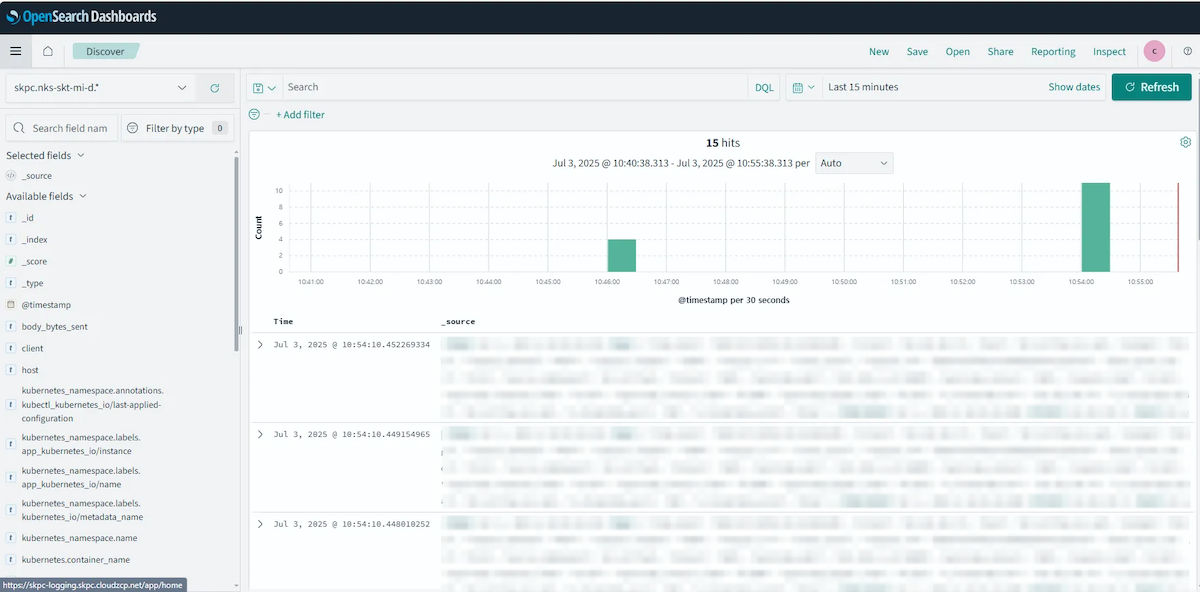
- Search: Enter a search term to filter logs within the specified time range.
- You can search for specific words (e.g., error) or logs containing specific key-value pairs.
- Filter: Filter and view data based on the fields available in Available fields.
- You can specify a time range to query logs.
- To add fields to the summary panel on the right, hover over the desired field in Available fields on the left, and click the Add button.