Grafana Monitoring Dashboards
When accessing Grafana dashboard through the Web Console, you will be logged in automatically.
If accessing through a web browser via the Grafana Domain URL, you can log in using the same Cloud ZCP account credentials.
Example URL: https://REALM_NAME-monitoring.REALM_NAME.cloudzcp.net/
Changing Organization
Grafana organizations are distinguished by project units registered in the Web Console.
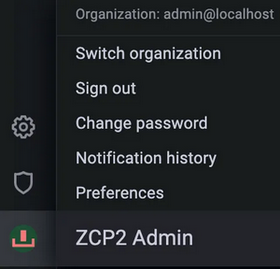
Click the icon in the bottom-left corner of Grafana to see account information and related menus.
Select the Current Org menu to switch organizations.
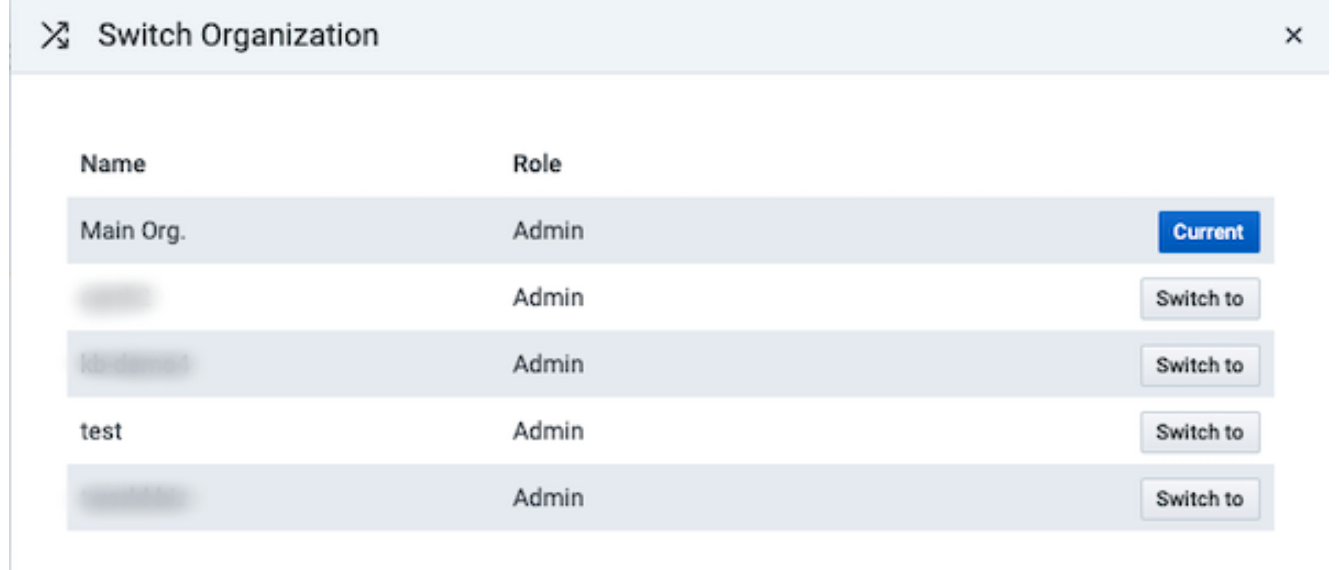
In the Switch Organization popup, the current organization is marked with Current.
Click the Switch to button for the organization you want to switch to.
Dashboard
You can monitor collected metric data through dashboards.
Click the Dashboard icon on the left and go to the Browse tab.
The available dashboards may vary depending on permissions and organization:
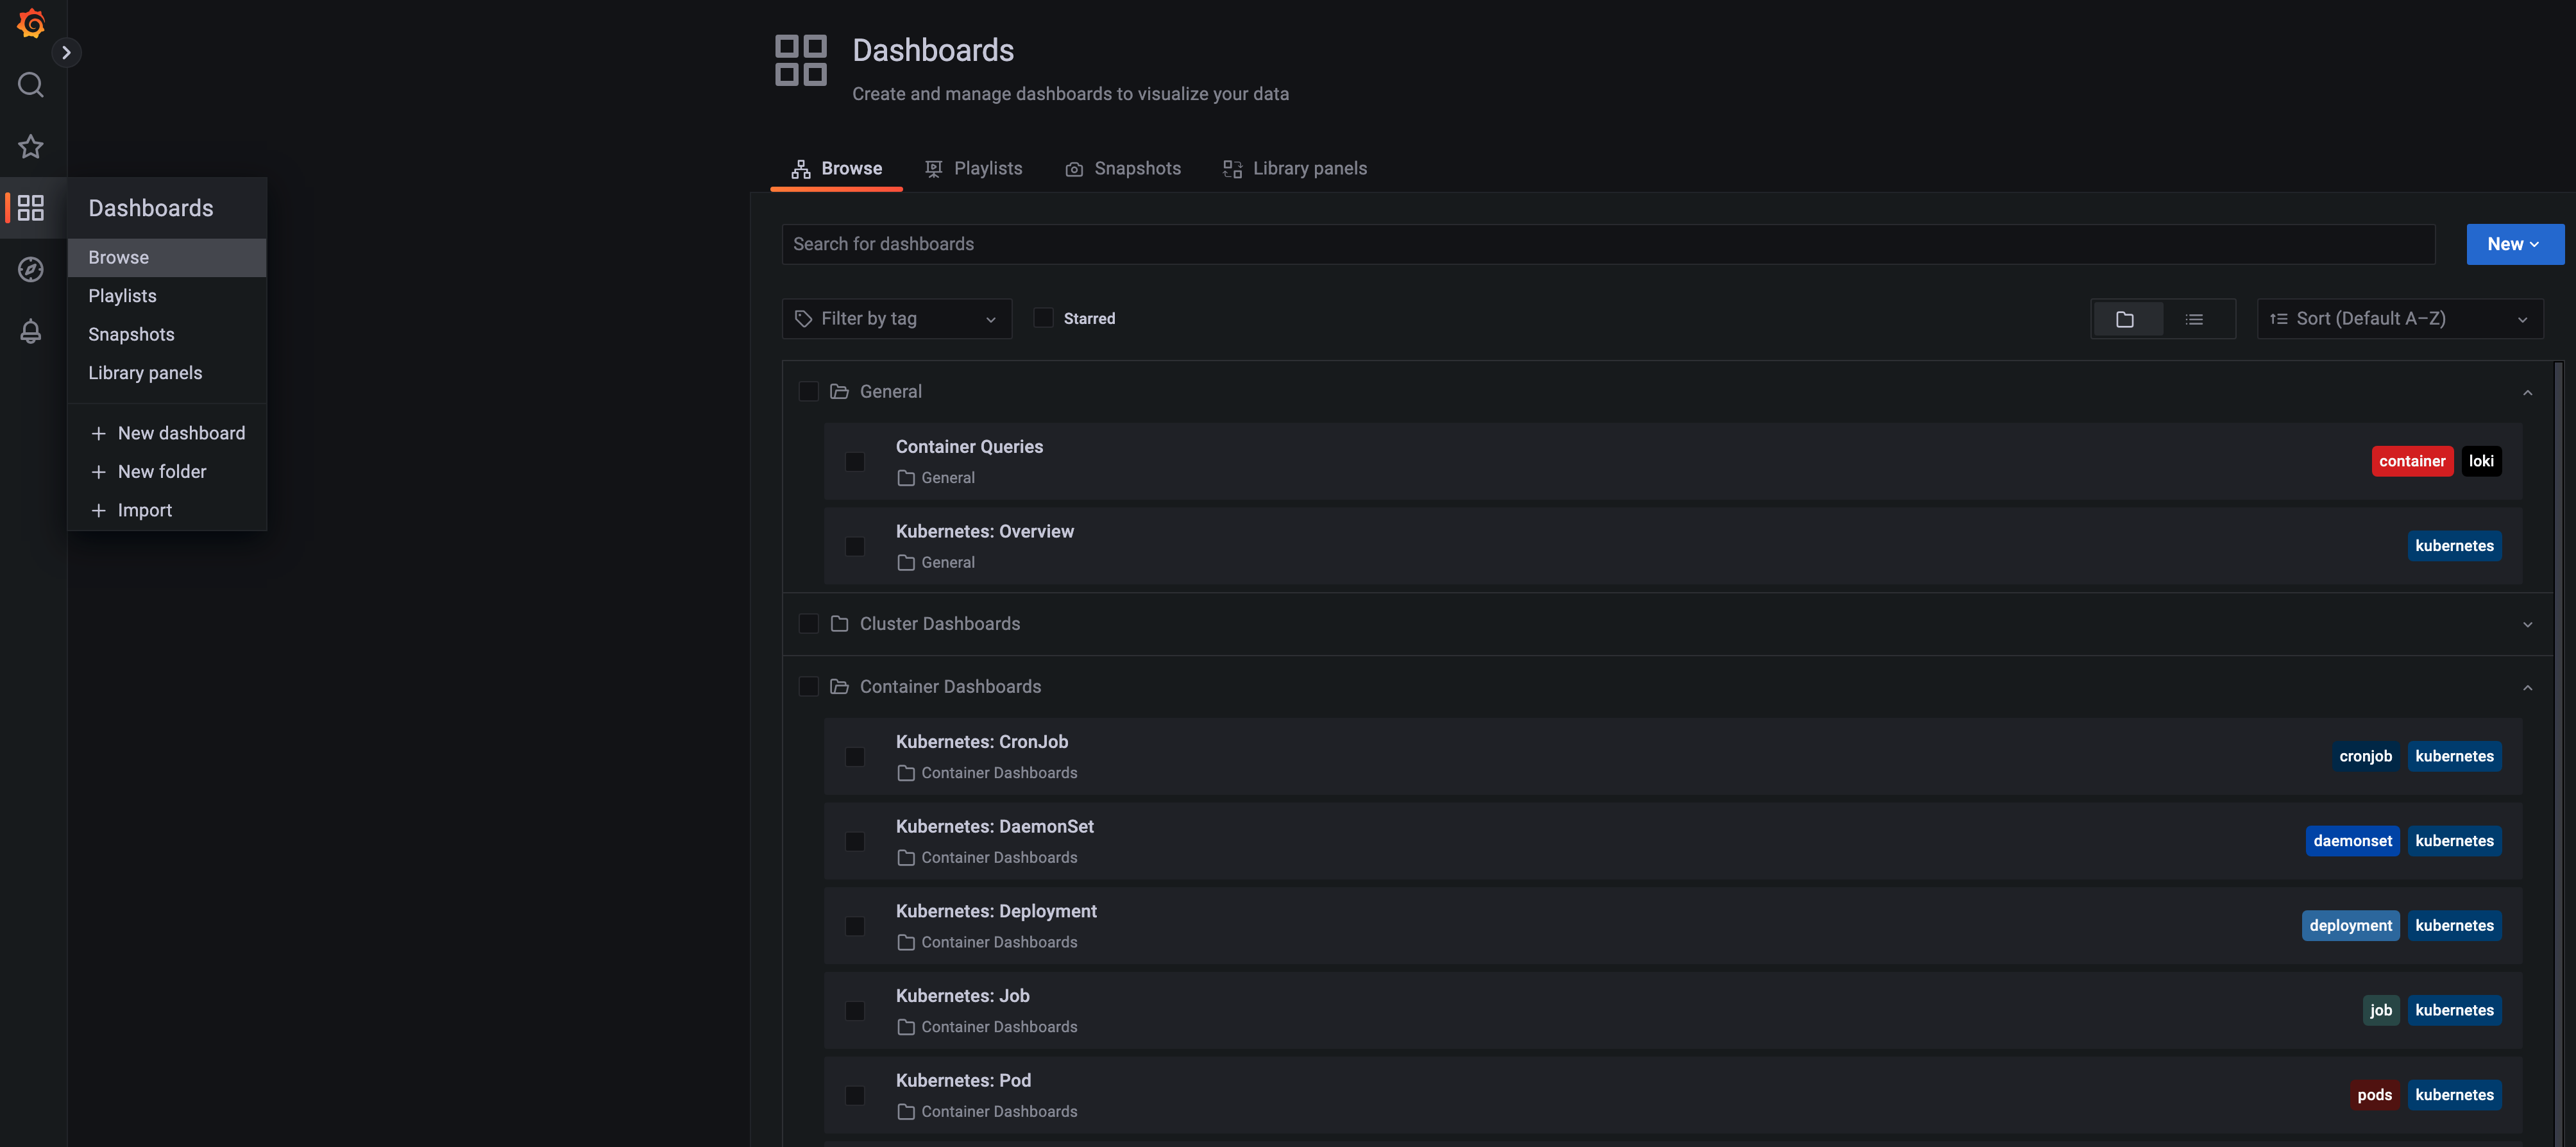
Click on a dashboard, for example, the Kubernetes: Deployment dashboard:
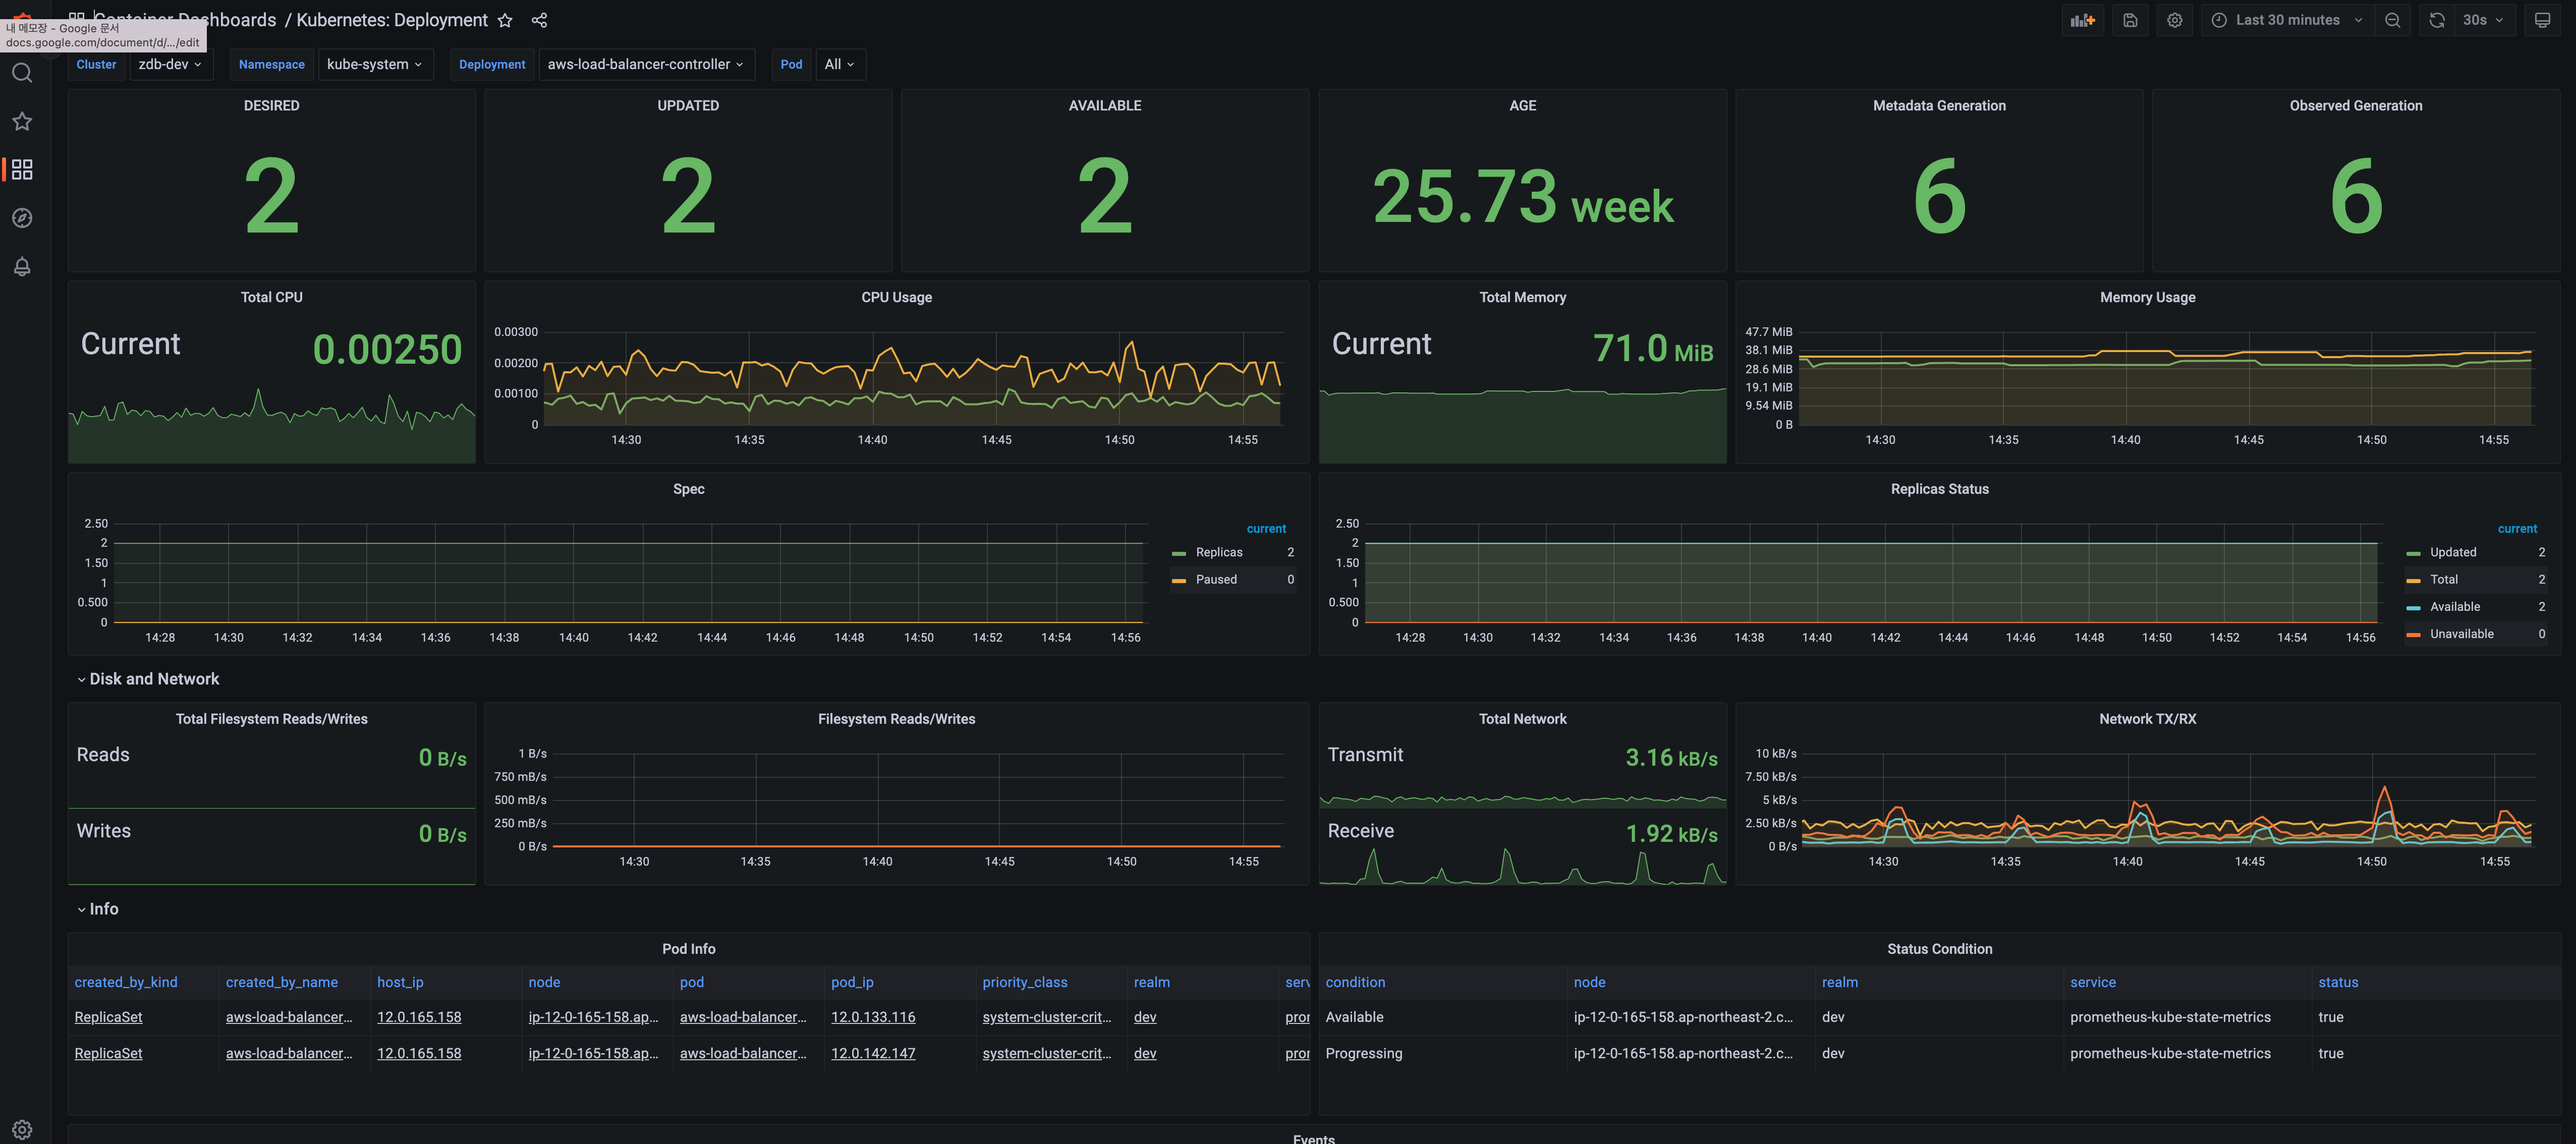
Hover over the time range (default: Last 1 hour) to see the current search period.
Click the time field to open a popup for configuring the search period.
You can choose an Absolute time range or Relative time range.
The field to the right allows you to select the refresh interval.
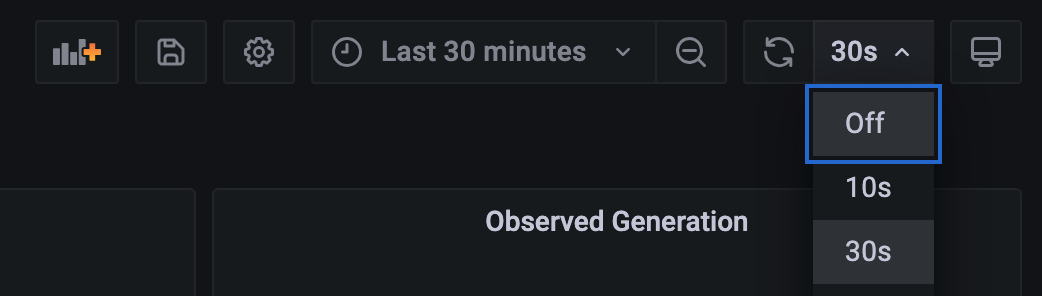
Clicking the refresh icon (default: 10s) lets you set how frequently metrics refresh.
The top option, Off, disables auto-refresh, while other options range from 5 seconds to 1 day.
Selecting a refresh interval applies the chosen setting.
Dashboard Types
Cloud Z CP provides the following default dashboards:
- Kubernetes: CronJob
- Kubernetes: DaemonSet
- Kubernetes: Deployment
- Kubernetes: Job
- Kubernetes: Pod
- Kubernetes: Pod Overview
- Kubernetes: ReplicaSet
- Kubernetes: StatefulSet
- Kubernetes : Workloads
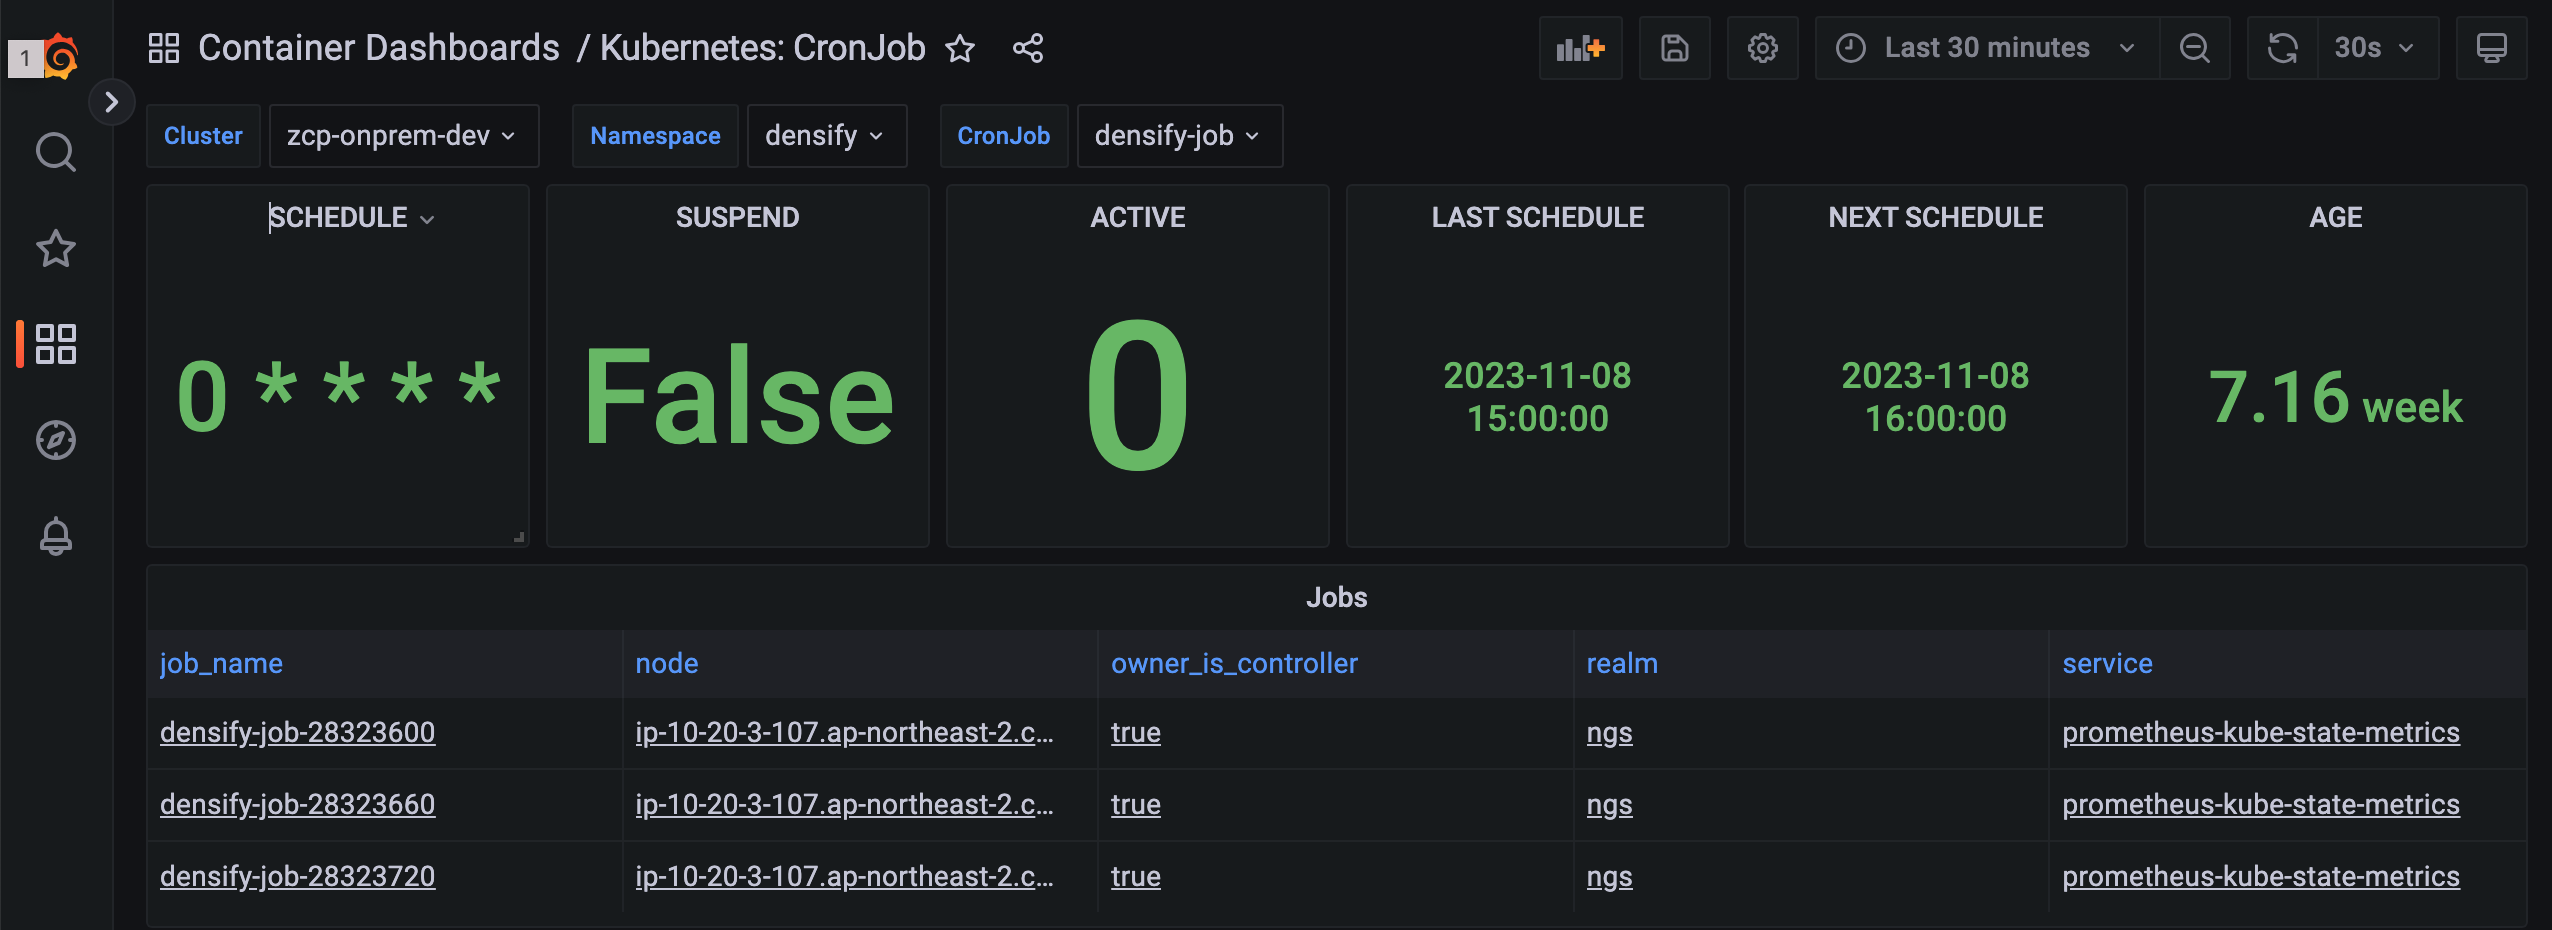
Kubernetes: CronJob
Displays CronJob information such as schedule, active status, and age.
| Panel | Description |
|---|---|
| SCHEDULE | Number of scheduled CronJobs |
| SUSPEND | Number of suspended CronJobs |
| ACTIVE | Number of active CronJobs |
| LAST SCHEDULE | Time of the last executed CronJob schedule |
| NEXT SCHEDULE | Scheduled time for the next CronJob execution |
| AGE | Time elapsed since the oldest CronJob was created |
| Jobs | Information about CronJobs |
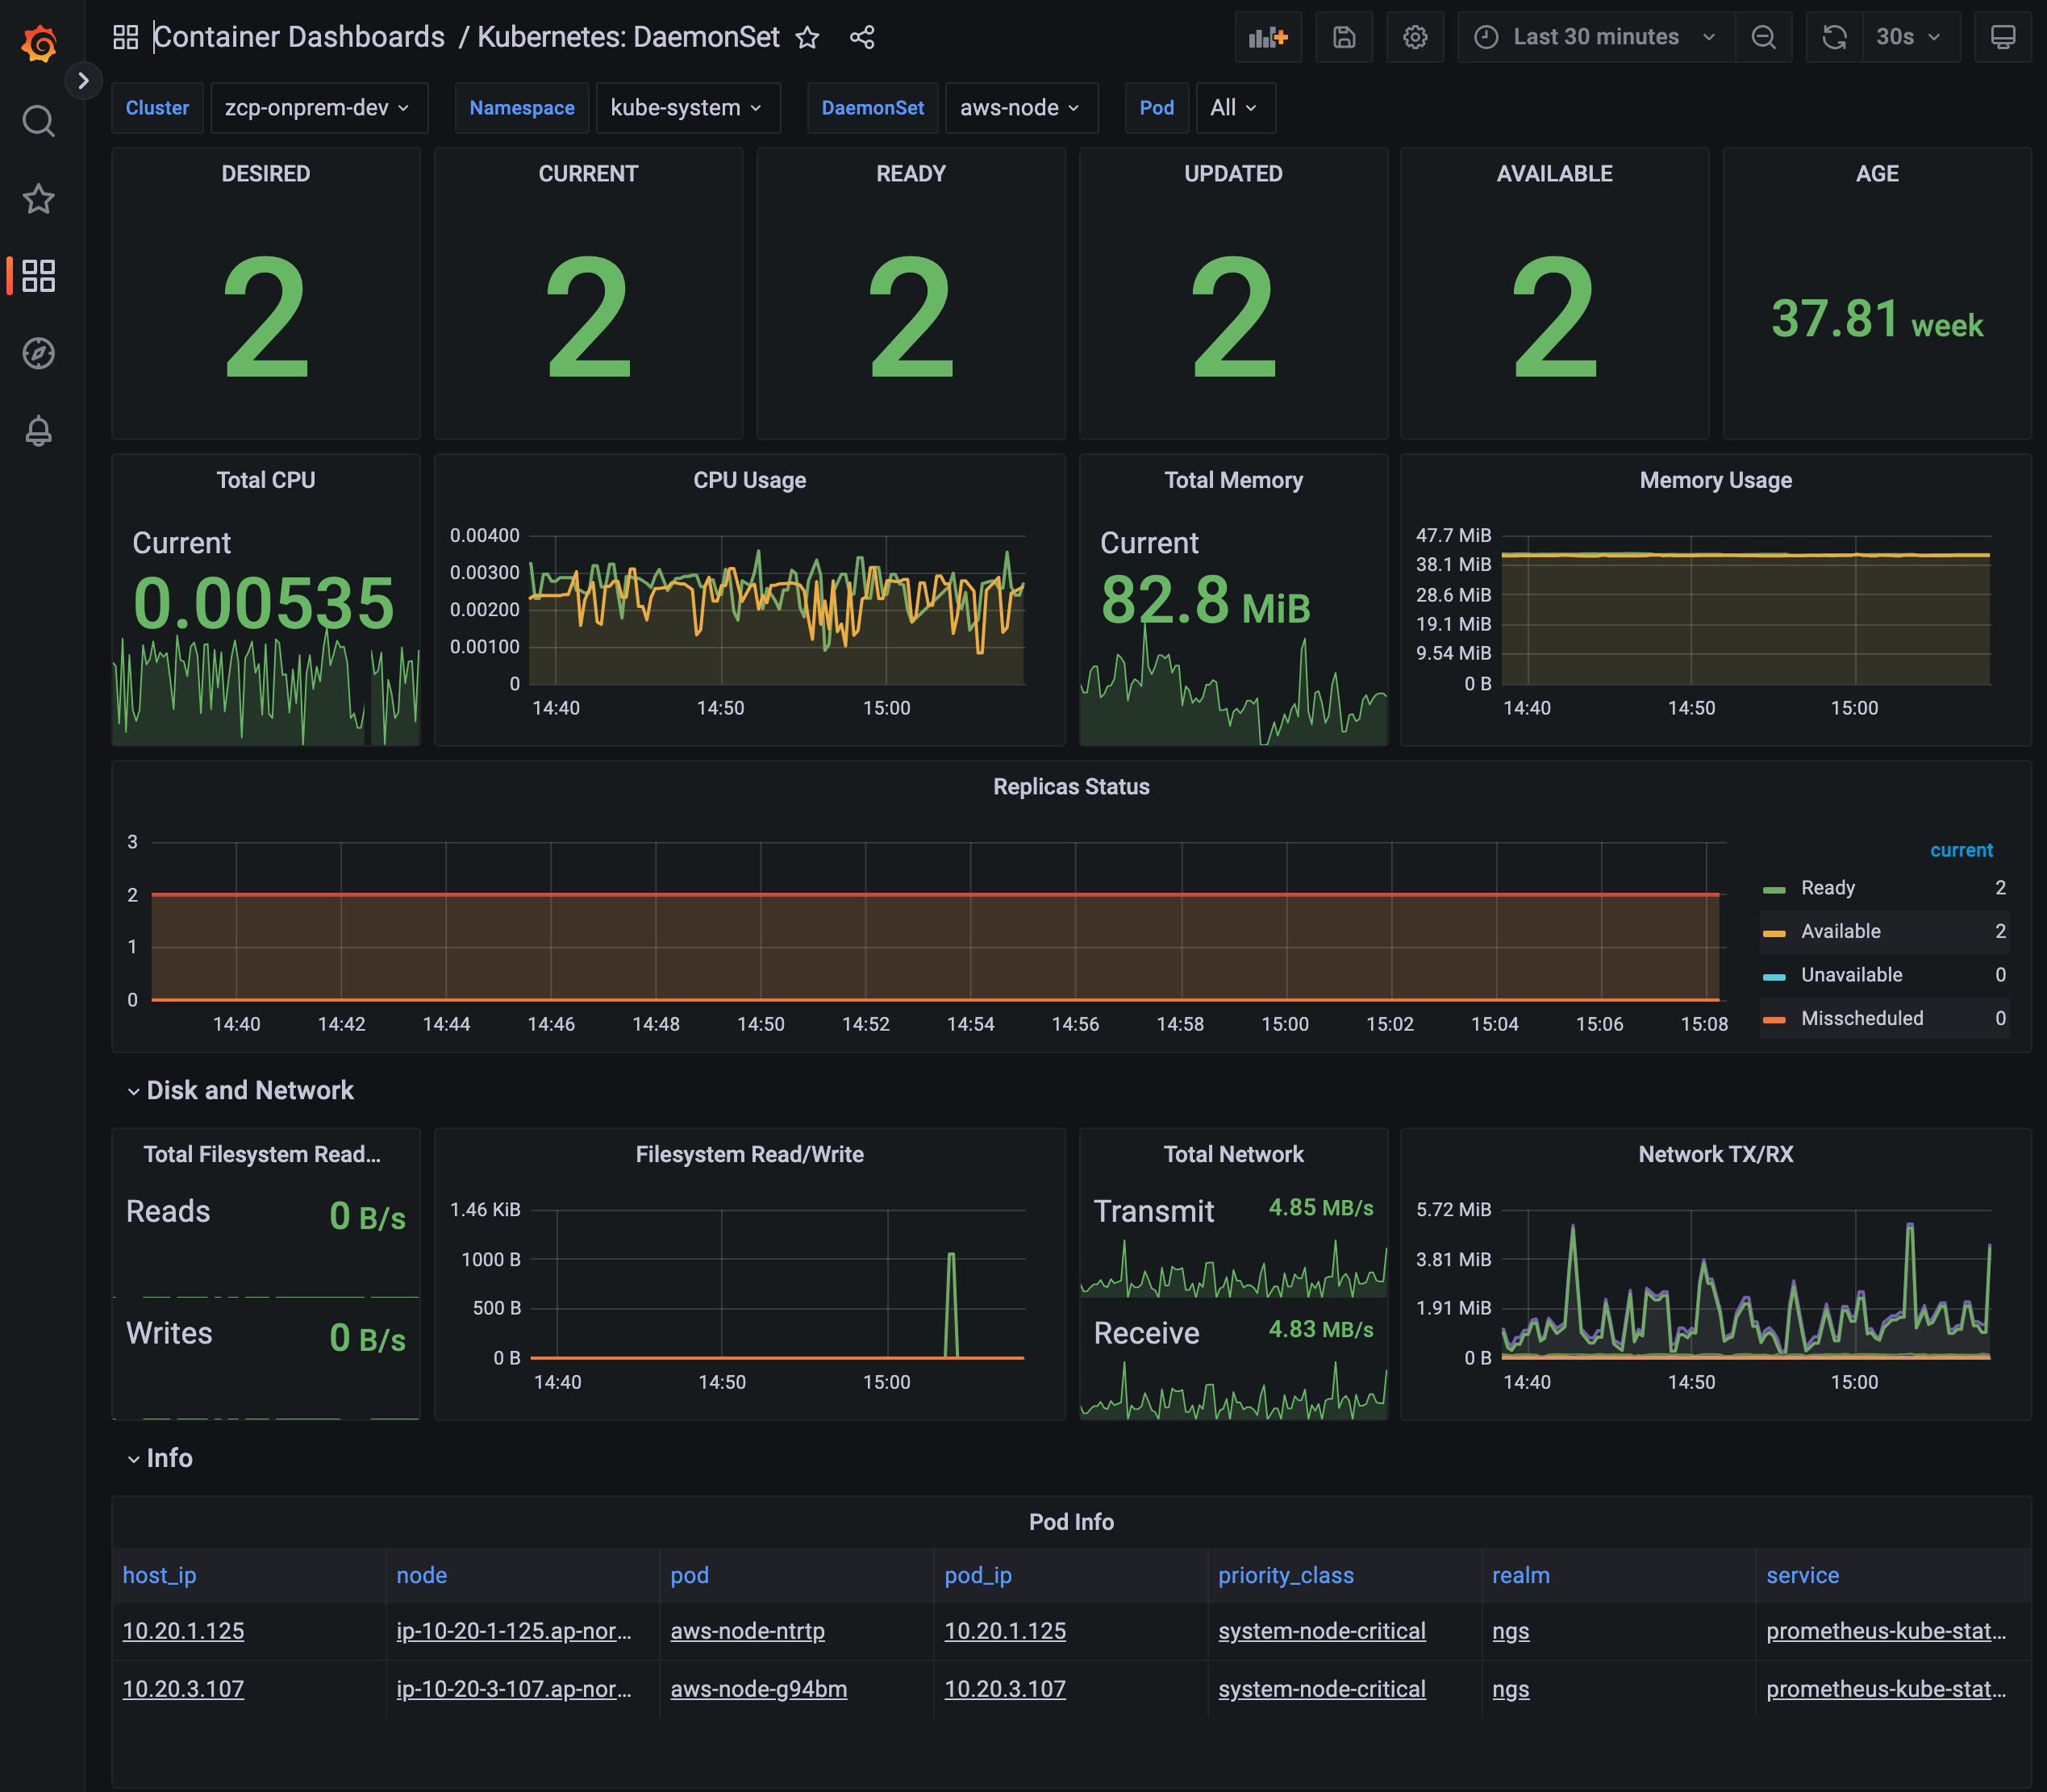
Kubernetes: DaemonSet
This is a dashboard that displays information about DaemonSets (Replicas, CPU/Memory/Network/Filesystem, etc.)
| Panel | Description |
|---|---|
| DESIRED | The number of DaemonSets requested for scheduling |
| CURRENT | The number of DaemonSets currently scheduled |
| READY | The number of DaemonSets that are running and ready |
| UPDATED | The number of updated DaemonSets |
| AVAILABLE | The number of DaemonSets currently running and in use |
| AGE | The duration since the oldest DaemonSet was created |
| Total CPU | The total CPU usage (Core) of containers created by the DaemonSet |
| CPU Usage | The CPU usage of containers created by the DaemonSet |
| Total Memory | The total memory usage (MiB) of containers created by the DaemonSet |
| Memory Usage | The memory usage of containers created by the DaemonSet |
| Replicas Status | The status of DaemonSet replicas (Ready / Available / Unavailable / Misscheduled / Scheduled) |
| Total Network | The total network usage (MBps) of containers created by the DaemonSet |
| Total Filesystem Read/Write | The total filesystem read/write usage of containers created by the DaemonSet |
| Filesystem Read/Write | The filesystem read/write usage of containers created by the DaemonSet |
| Total Network TX/RX | The total network TX/RX usage of containers created by the DaemonSet |
| Network TX/RX | The network TX/RX usage of containers created by the DaemonSet |
| Pod Info | Information about DaemonSet pods. Clicking an item will navigate to Container Dashboards / Kubernetes: Pod |
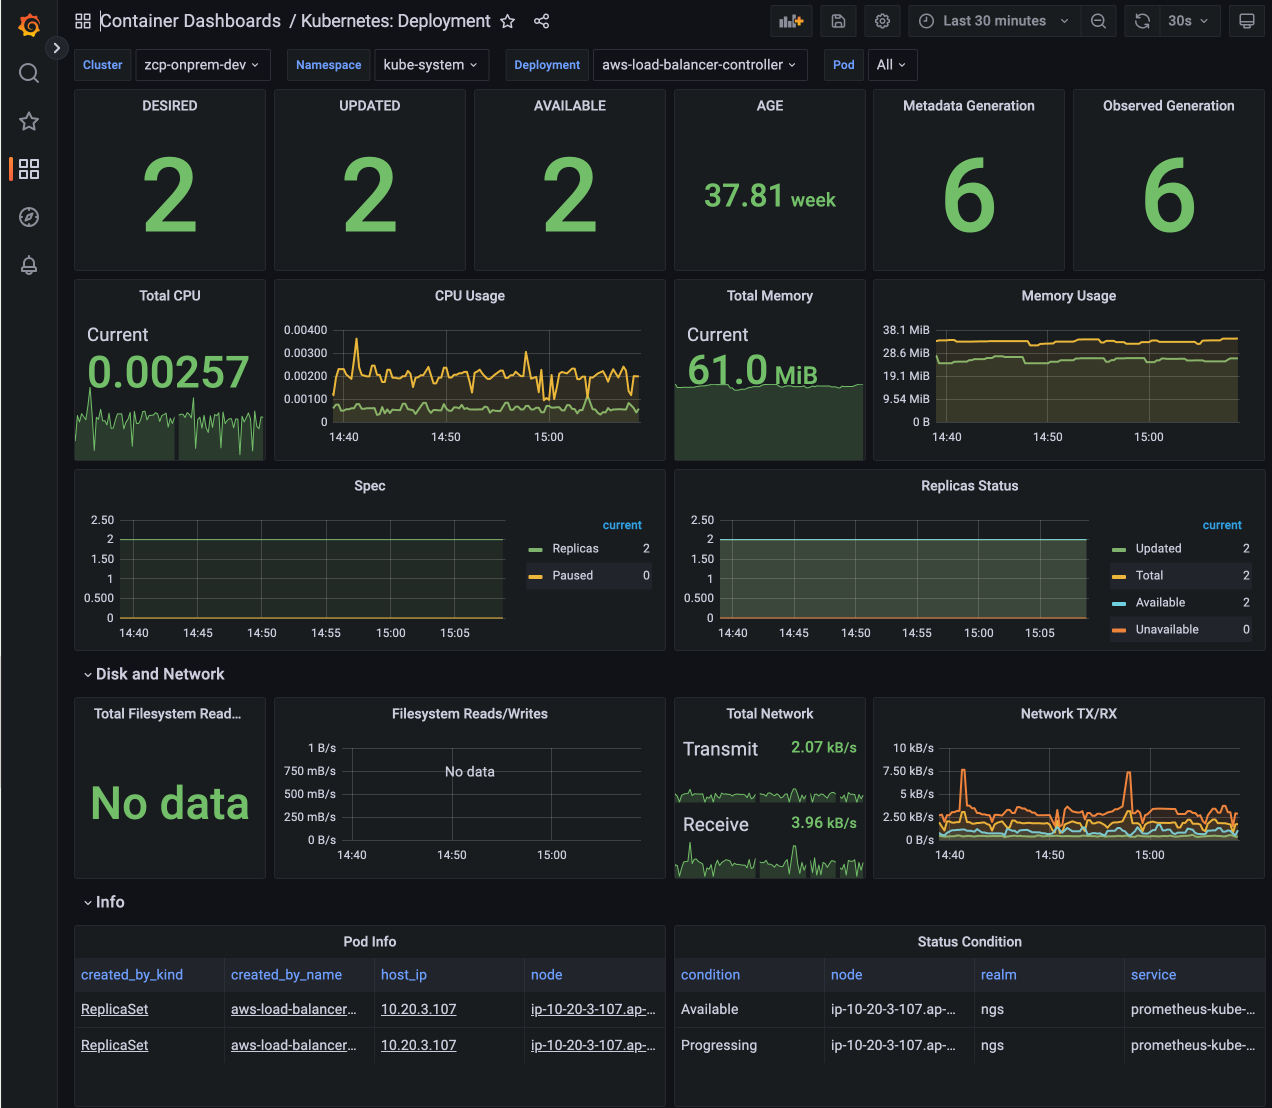
Kubernetes: Deployment
This is a dashboard that displays information about Deployments (Replicas, CPU/Memory/Network/Filesystem, etc.)
| Panel | Description |
|---|---|
| DESIRED | The number of Deployment replicas requested for scheduling |
| UPDATED | The number of updated Deployment replicas |
| AVAILABLE | The number of Deployment replicas currently running and in use |
| AGE | The duration since the oldest Deployment was created |
| Metadata Generation | The number of Deployments created by metadata |
| Observed Generation | The number of Deployments created by observation |
| Total CPU | The total CPU usage (Core) of containers created by the Deployment |
| CPU Usage | The CPU usage of containers created by the Deployment |
| Total Memory | The total memory usage (MiB) of containers created by the Deployment |
| Memory Usage | The memory usage of containers created by the Deployment |
| Spec | The number of Deployment replicas and paused replicas |
| Replicas Status | The status of Deployment replicas (Ready / Available / Unavailable / Misscheduled / Scheduled) |
| Total Network | The total network usage (MBps) of containers created by the Deployment |
| Total Filesystem Read/Write | The total filesystem read/write usage of containers created by the Deployment |
| Filesystem Read/Write | The filesystem read/write usage of containers created by the Deployment |
| Total Network TX/RX | The total network TX/RX usage of containers created by the Deployment |
| Network TX/RX | The network TX/RX usage of containers created by the Deployment |
| Pod Info | Information about pods created by the Deployment. Clicking an item will navigate to "Container Dashboards / Kubernetes: Pod`` |
| Status Condition | The status of pods created by the Deployment |
| Events | Event information of Deployments |
| Pod Events | Event information of Deployment pods |
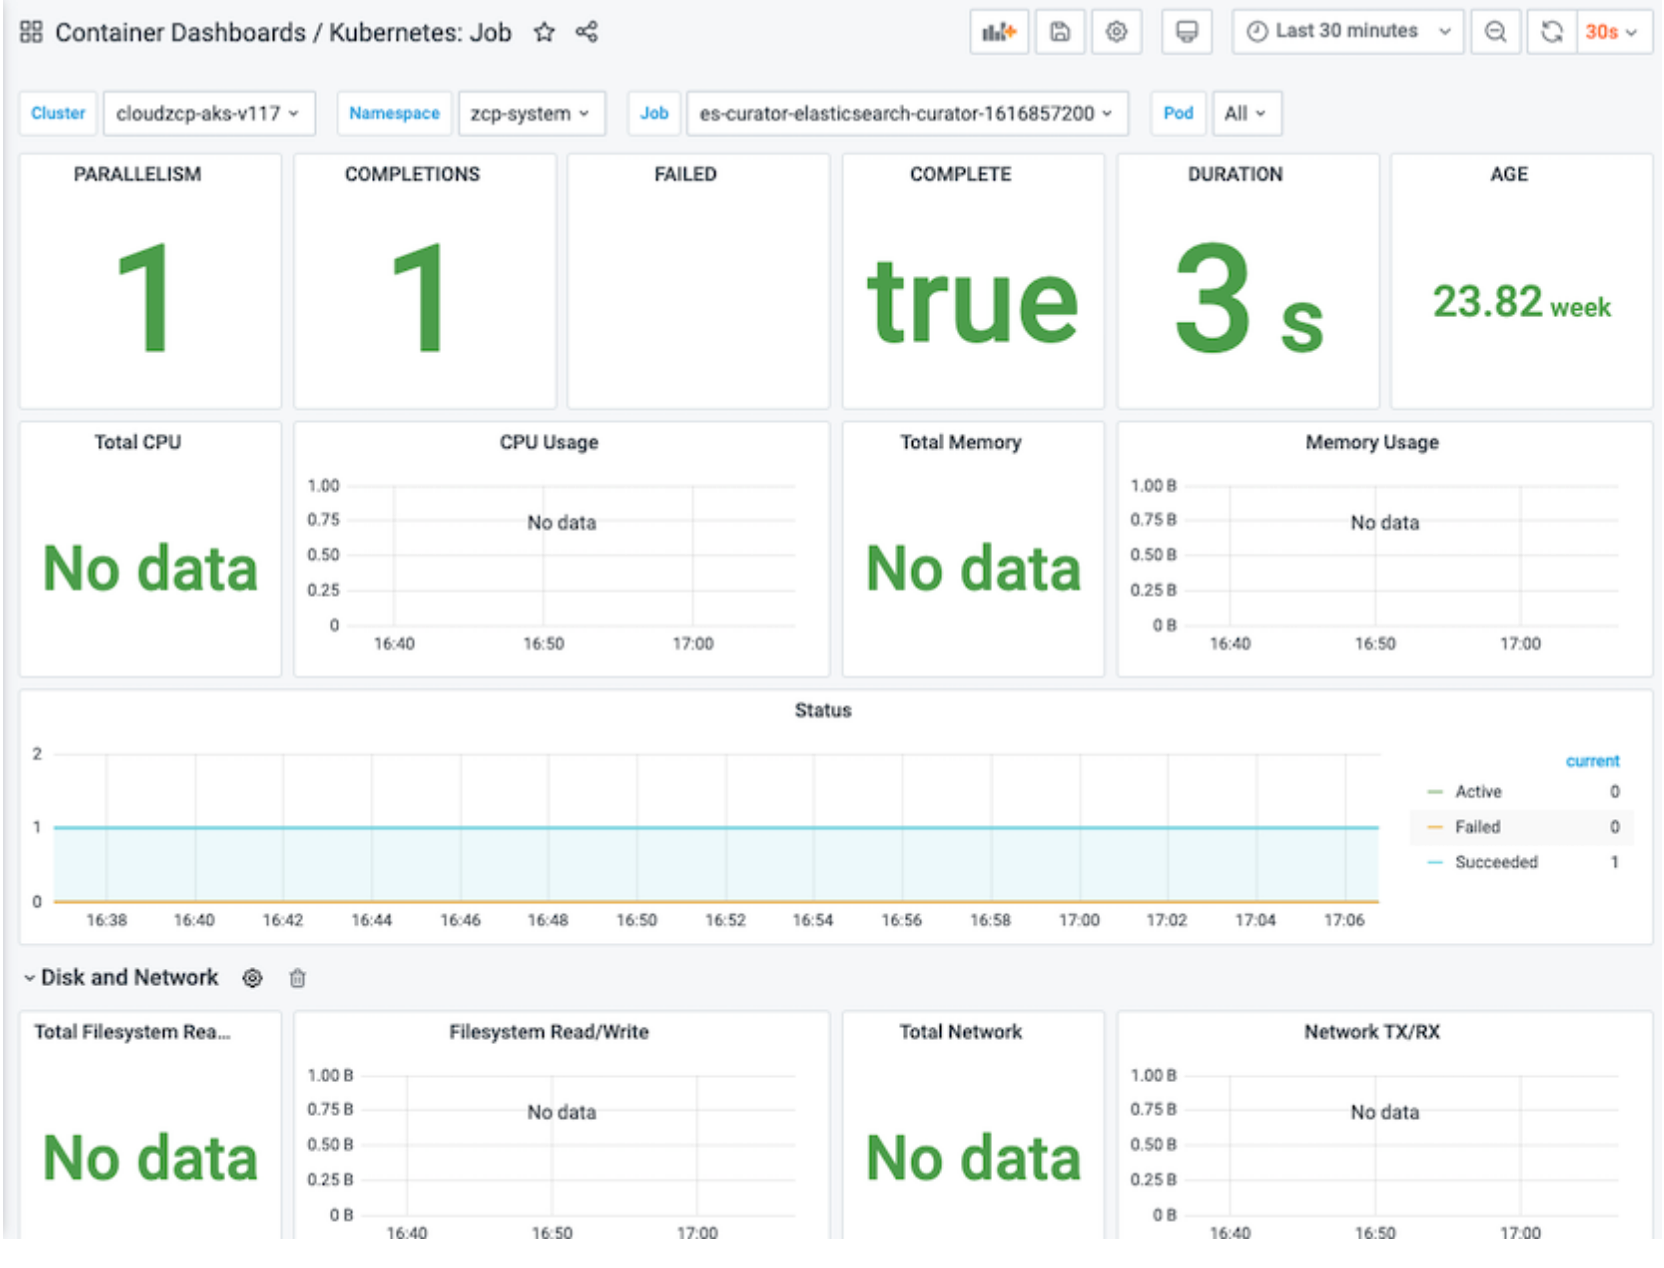
Kubernetes: Job
This is a dashboard that displays information about Jobs (Replicas, CPU/Memory/Network/Filesystem, etc.)
| Panel | Description |
|---|---|
| PARALLELISM | The number of Jobs in the Parallelism state |
| COMPLETIONS | The number of Jobs in the Completion state |
| FAILED | The number of failed Jobs |
| COMPLETE | The number of completed Jobs |
| DURATION | The duration from Job start to completion |
| AGE | The duration since the oldest Job was created |
| Total CPU | The total CPU usage (Core) of containers created by the Job |
| CPU Usage | The CPU usage of containers created by the Job |
| Total Memory | The total memory usage (MiB) of containers created by the Job |
| Memory Usage | The memory usage of containers created by the Job |
| Status | The status of Jobs (Active / Failed / Succeeded) |
| Total Network | The total network usage (MBps) of containers created by the Job |
| Total Filesystem Read/Write | The total filesystem read/write usage of containers created by the Job |
| Filesystem Read/Write | The filesystem read/write usage of containers created by the Job |
| Total Network TX/RX | The total network TX/RX usage of containers created by the Job |
| Network TX/RX | The network TX/RX usage of containers created by the Job |
| Pod Info | Information about pods created by the Job. Clicking an item will navigate to Container Dashboards / Kubernetes: Pod |
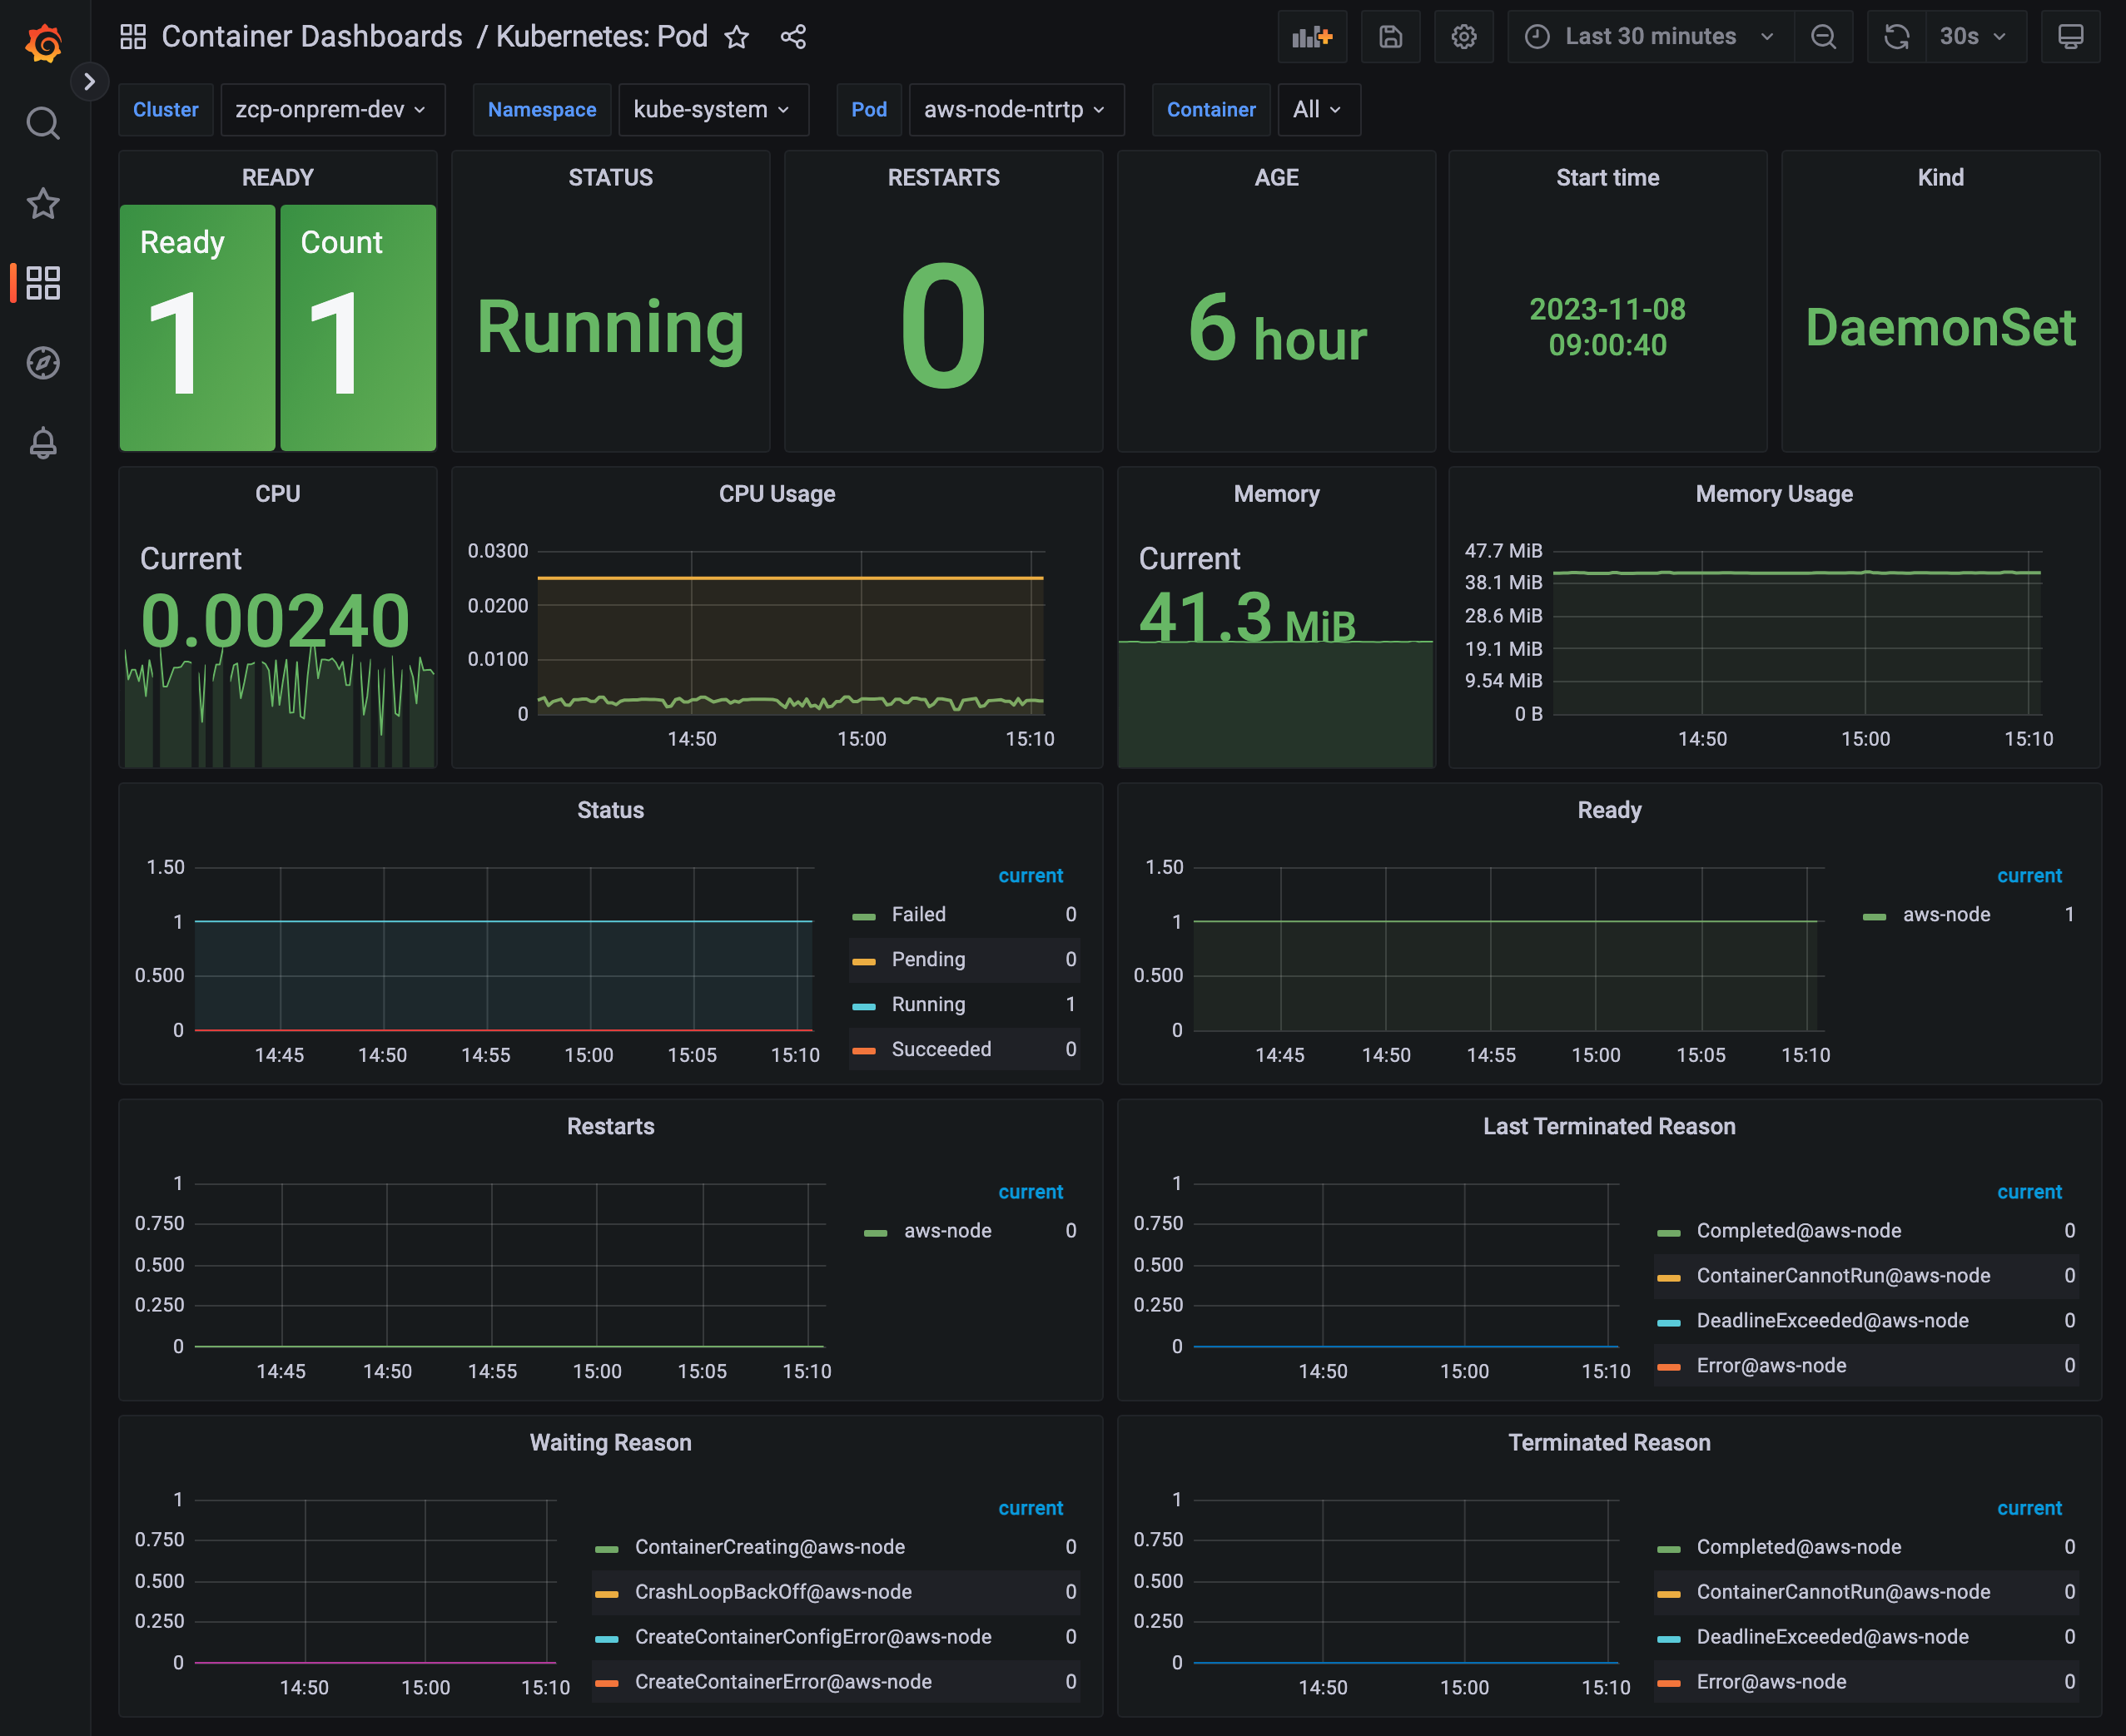
Kubernetes: Pod
This is a dashboard that displays summary information about Pods (Replicas, CPU/Memory/Network/Filesystem, etc.)
| Panel | Description |
|---|---|
| READY | The number of Pods with Containers in a Ready/Normal state |
| STATUS | The status of the Pod |
| RESTARTS | The total number of restarted Pods |
| AGE | The duration since the oldest Pod was created |
| Start time | The creation date and time of the oldest Pod |
| Kind | The type of Pod |
| Total CPU | The total CPU usage (Core) of containers created by the Pod |
| CPU Usage | The CPU usage of containers created by the Pod |
| Total Memory | The total memory usage (MiB) of containers created by the Pod |
| Memory Usage | The memory usage of containers created by the Pod |
| Status | The status of the Pod (Failed / Pending / Running / Succeeded) |
| Ready | The number of Containers in a Ready state in the Pod |
| Restarts | The number of Containers in a Restart state in the Pod |
| Last Terminated Reason | The reason for the last termination of the Pod |
| Waiting Reason | The reason why the Pod is in a Waiting state |
| Terminated Reason | The reason for Pod termination |
| Total Volume | The total volume size of Persistent Volume Claims (PVC) attached to the Pod |
| Volume | The volume size of PVCs attached to the Pod |
| Total Network TX/RX | The total network TX/RX usage of containers created by the Pod |
| Network TX/RX | The network TX/RX usage of containers created by the Pod |
| Total Filesystem Read/Write | The total filesystem read/write usage of containers created by the Pod |
| Filesystem Read/Write | The filesystem read/write usage of containers created by the Pod |
| Pod Info | Information about Pods |
| Container Info | Information about Containers |
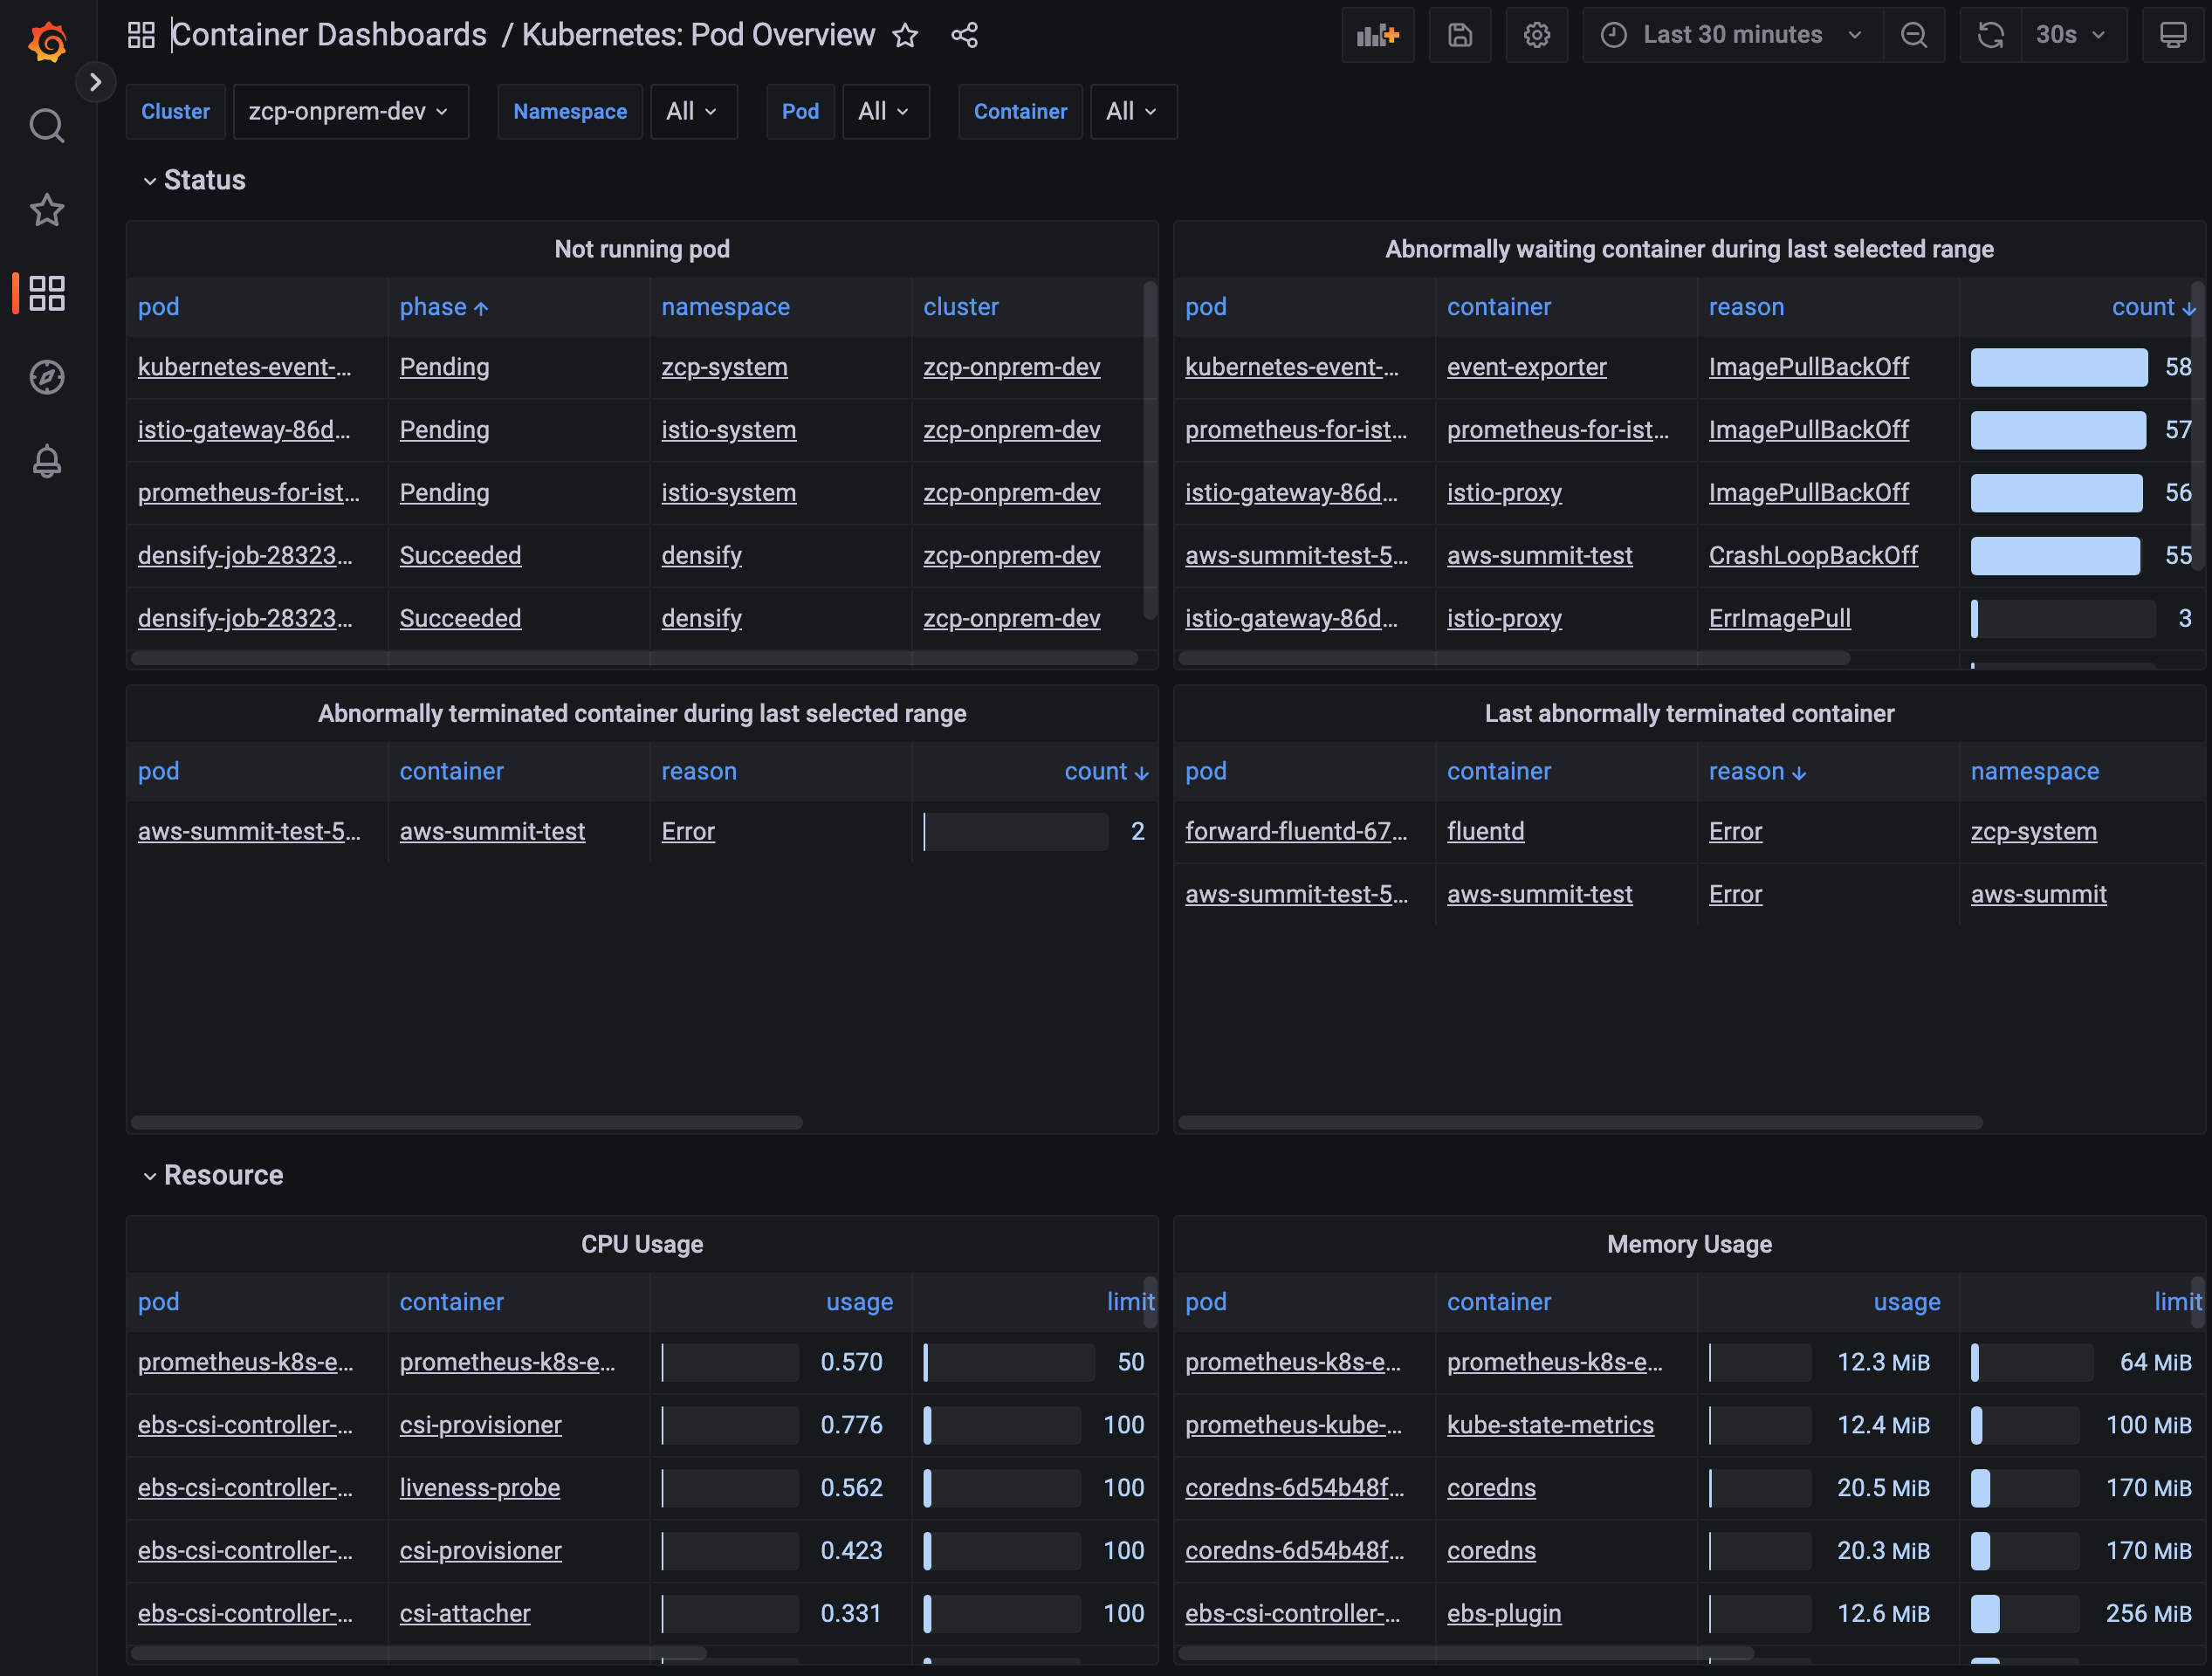
Kubernetes: Pod Overview
This is a dashboard that displays summary information about Pods (Pod status, restart count, CPU/Memory/Network/Volume/Filesystem usage, etc.)
| Panel | Description |
|---|---|
| Not running pod | The total number of non-running Pods |
| Abnormally waiting container during last selected range | Information about Containers that were abnormally in a waiting state, including the number of occurrences and reasons. Clicking an item navigates to Container Dashboards / Kubernetes: Pod |
| Abnormally terminated container during last selected range | Information about Containers that were abnormally in a terminated state, including the number of occurrences and reasons. Clicking an item navigates to Container Dashboards / Kubernetes: Pod |
| Last abnormally terminated container | Information about the last Container that was in a terminated state, including the reason. Clicking an item navigates to Container Dashboards / Kubernetes: Pod |
| CPU Usage | The CPU usage of Containers created by the Pod. Clicking an item navigates to Container Dashboards / Kubernetes: Pod |
| Memory Usage | The memory usage of Containers created by the Pod. Clicking an item navigates to Container Dashboards / Kubernetes: Pod |
| Volume Usage | The PVC (Persistent Volume Claim) usage of Containers created by the Pod |
Kubernetes: ReplicaSet
This is a dashboard that displays information about ReplicaSets (Replicas, CPU/Memory/Network/Filesystem, etc.)
| Panel | Description |
|---|---|
| DESIRED | The number of ReplicaSets requested for scheduling |
| UPDATED | The number of updated ReplicaSets |
| AVAILABLE | The number of ReplicaSets currently running and in use |
| AGE | The duration since the oldest ReplicaSet was created |
| Metadata Generation | The number of ReplicaSets created by metadata |
| Observed Generation | The number of ReplicaSets created by observation |
| Total CPU | The total CPU usage (Core) of containers created by the ReplicaSet |
| CPU Usage | The CPU usage of containers created by the ReplicaSet |
| Total Memory | The total memory usage (MiB) of containers created by the ReplicaSet |
| Memory Usage | The memory usage of containers created by the ReplicaSet |
| Replicas Status | The status of ReplicaSet replicas (Ready / Fully_labeled / Unavailable) |
| Total Network | The total network usage (MBps) of containers created by the ReplicaSet |
| Total Filesystem Read/Write | The total filesystem read/write usage of containers created by the ReplicaSet |
| Filesystem Read/Write | The filesystem read/write usage of containers created by the ReplicaSet |
| Total Network TX/RX | The total network TX/RX usage of containers created by the ReplicaSet |
| Network TX/RX | The network TX/RX usage of containers created by the ReplicaSet |
| Pod Info | Information about Pods created by the ReplicaSet. Clicking an item navigates to Container Dashboards / Kubernetes: Pod |
| Events | Event information of ReplicaSets |
| Pod Events | Event information of Pods created by the ReplicaSet |
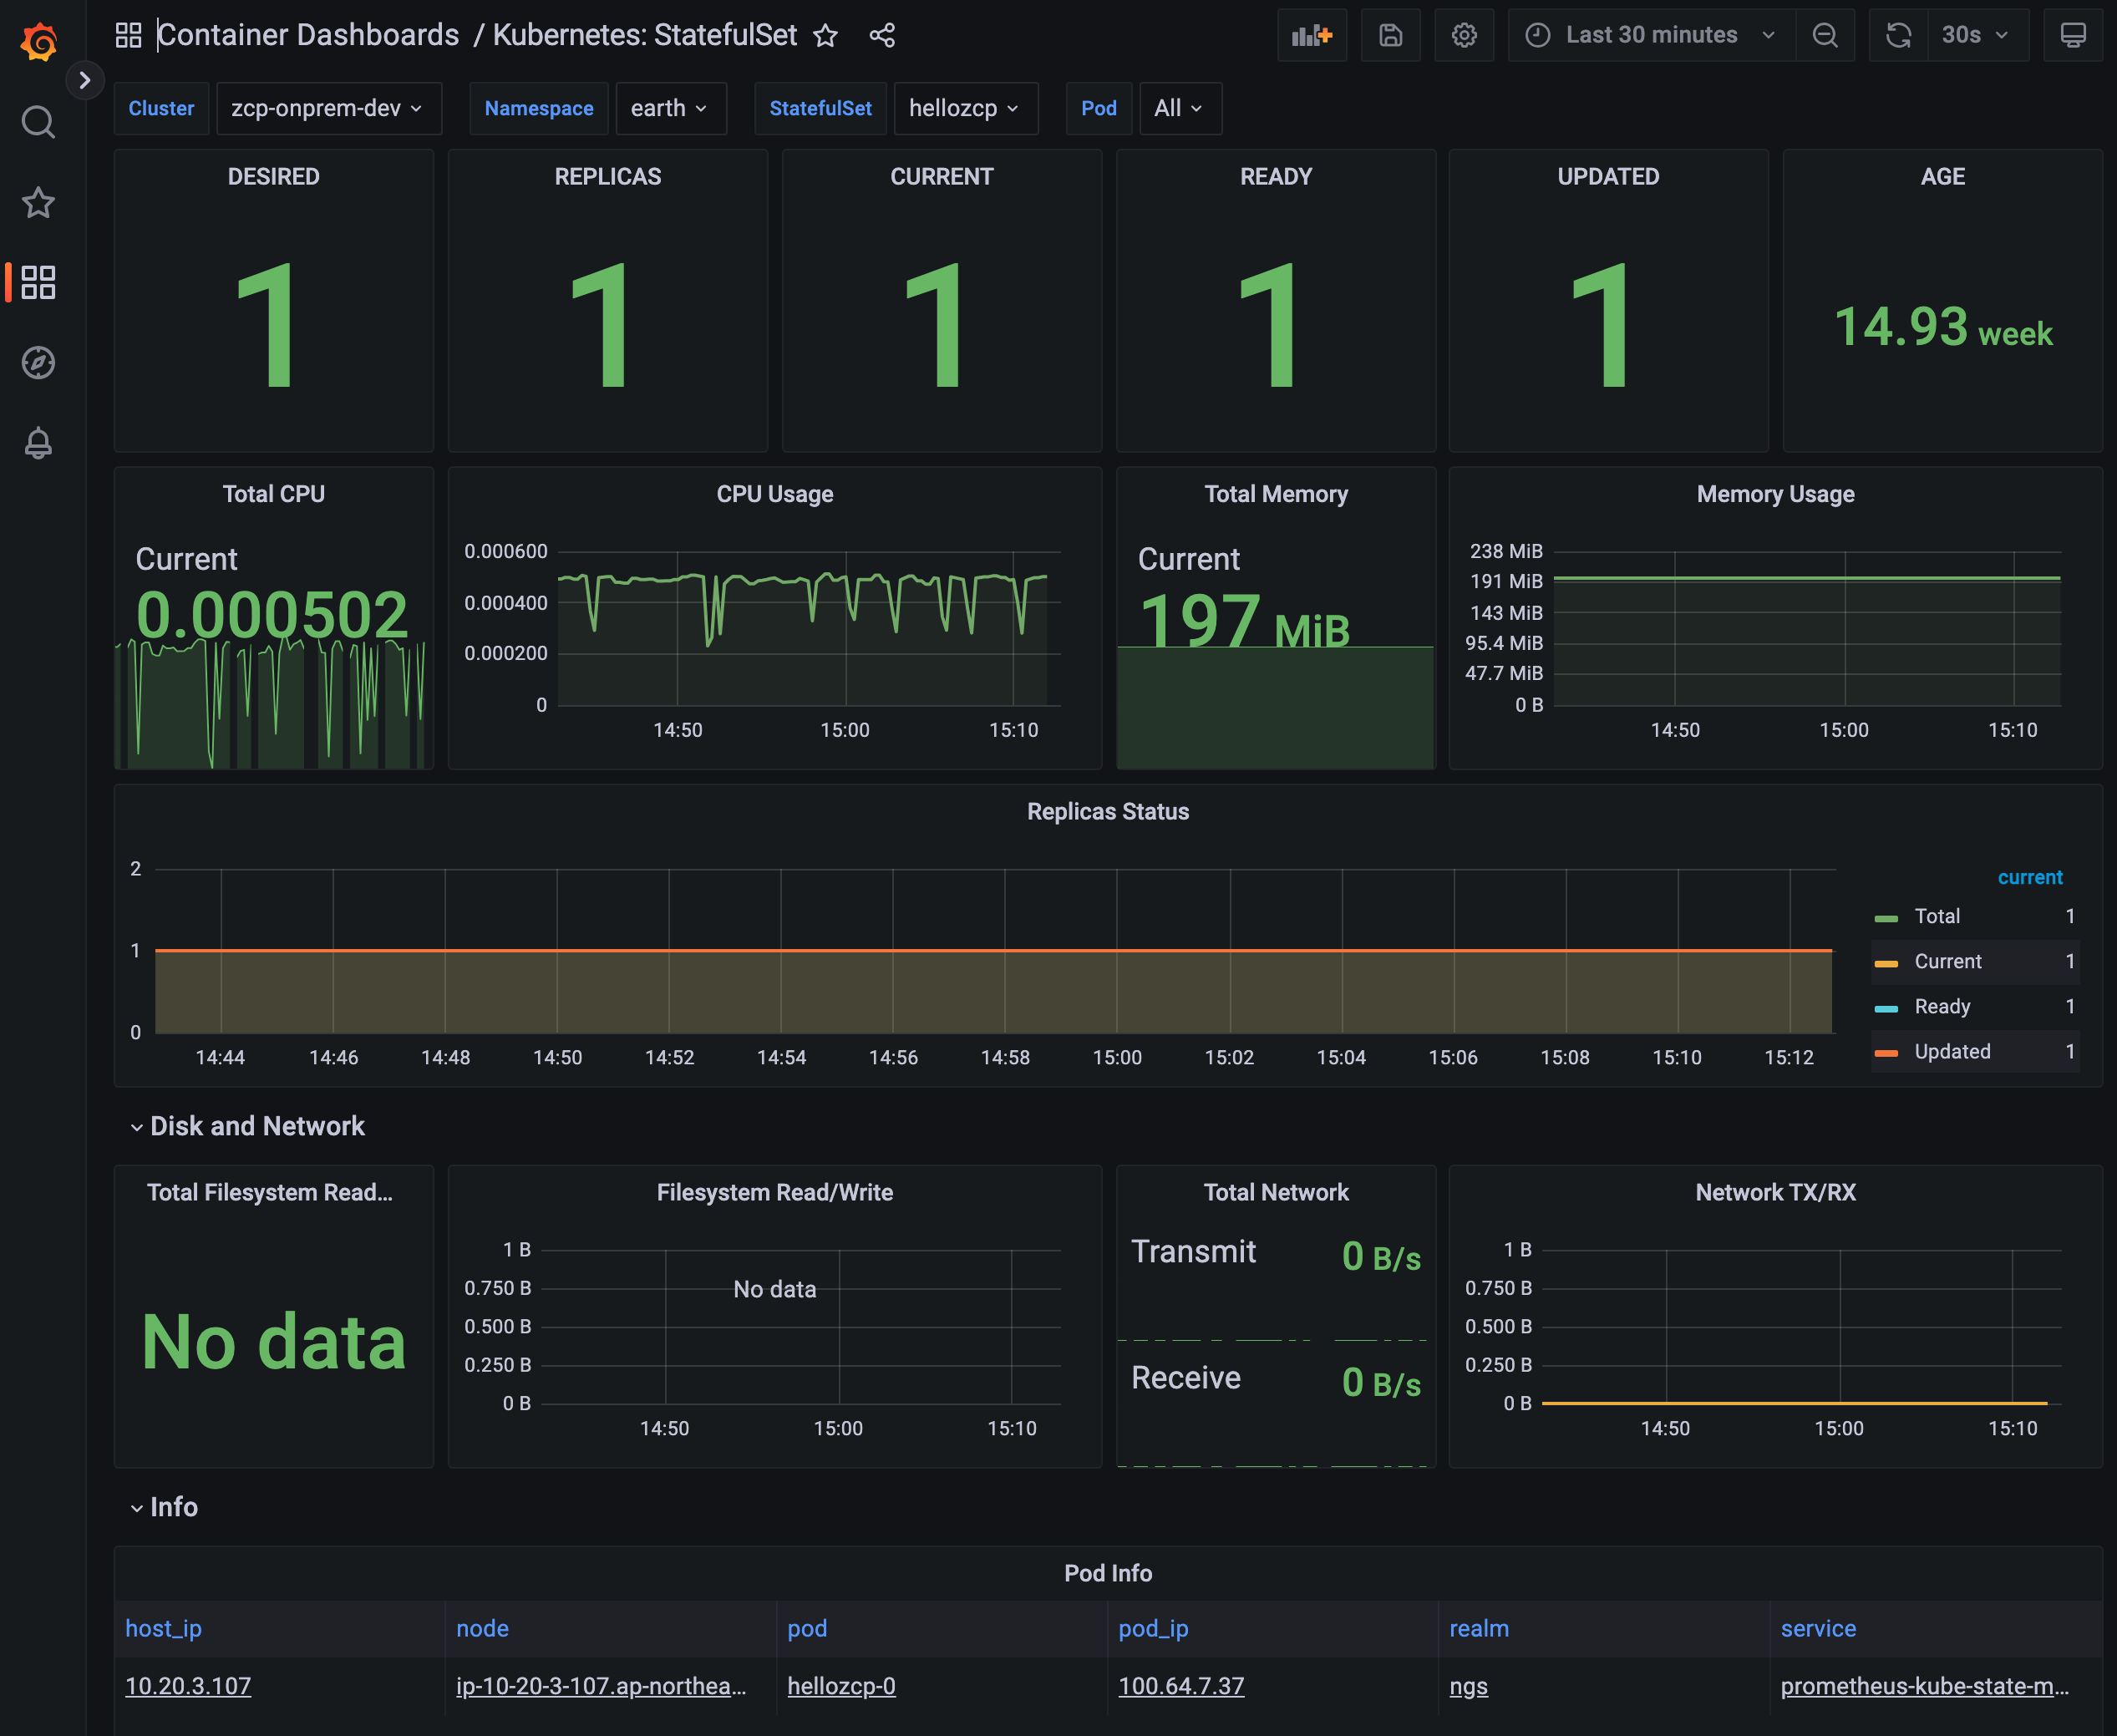
Kubernetes: StatefulSet
This is a dashboard that displays information about StatefulSets (Replicas, CPU/Memory/Network/Filesystem, etc.)
| Panel | Description |
|---|---|
| DESIRED | The number of StatefulSet replicas requested for scheduling |
| REPLICAS | The number of StatefulSet replicas |
| CURRENT | The current number of StatefulSet replicas |
| READY | The number of ready StatefulSet replicas |
| UPDATED | The number of updated StatefulSet replicas |
| AGE | The duration since the oldest StatefulSet replica was created |
| Total CPU | The total CPU usage (Core) of containers created by the StatefulSet replicas |
| CPU Usage | The CPU usage of containers created by the StatefulSet replicas |
| Total Memory | The total memory usage (MiB) of containers created by the StatefulSet replicas |
| Memory Usage | The memory usage of containers created by the StatefulSet replicas |
| Replicas Status | The status of StatefulSet replicas (Total / Current / Ready / Updated) |
| Total Network | The total network usage (MBps) of containers created by the StatefulSet replicas |
| Total Filesystem Read/Write | The total filesystem read/write usage of containers created by the StatefulSet replicas |
| Filesystem Read/Write | The filesystem read/write usage of containers created by the StatefulSet replicas |
| Total Network TX/RX | The total network TX/RX usage of containers created by the StatefulSet replicas |
| Network TX/RX | The network TX/RX usage of containers created by the StatefulSet replicas |
| Pod Info | Information about Pods created by the StatefulSet. Clicking an item navigates to Container Dashboards / Kubernetes: Pod |
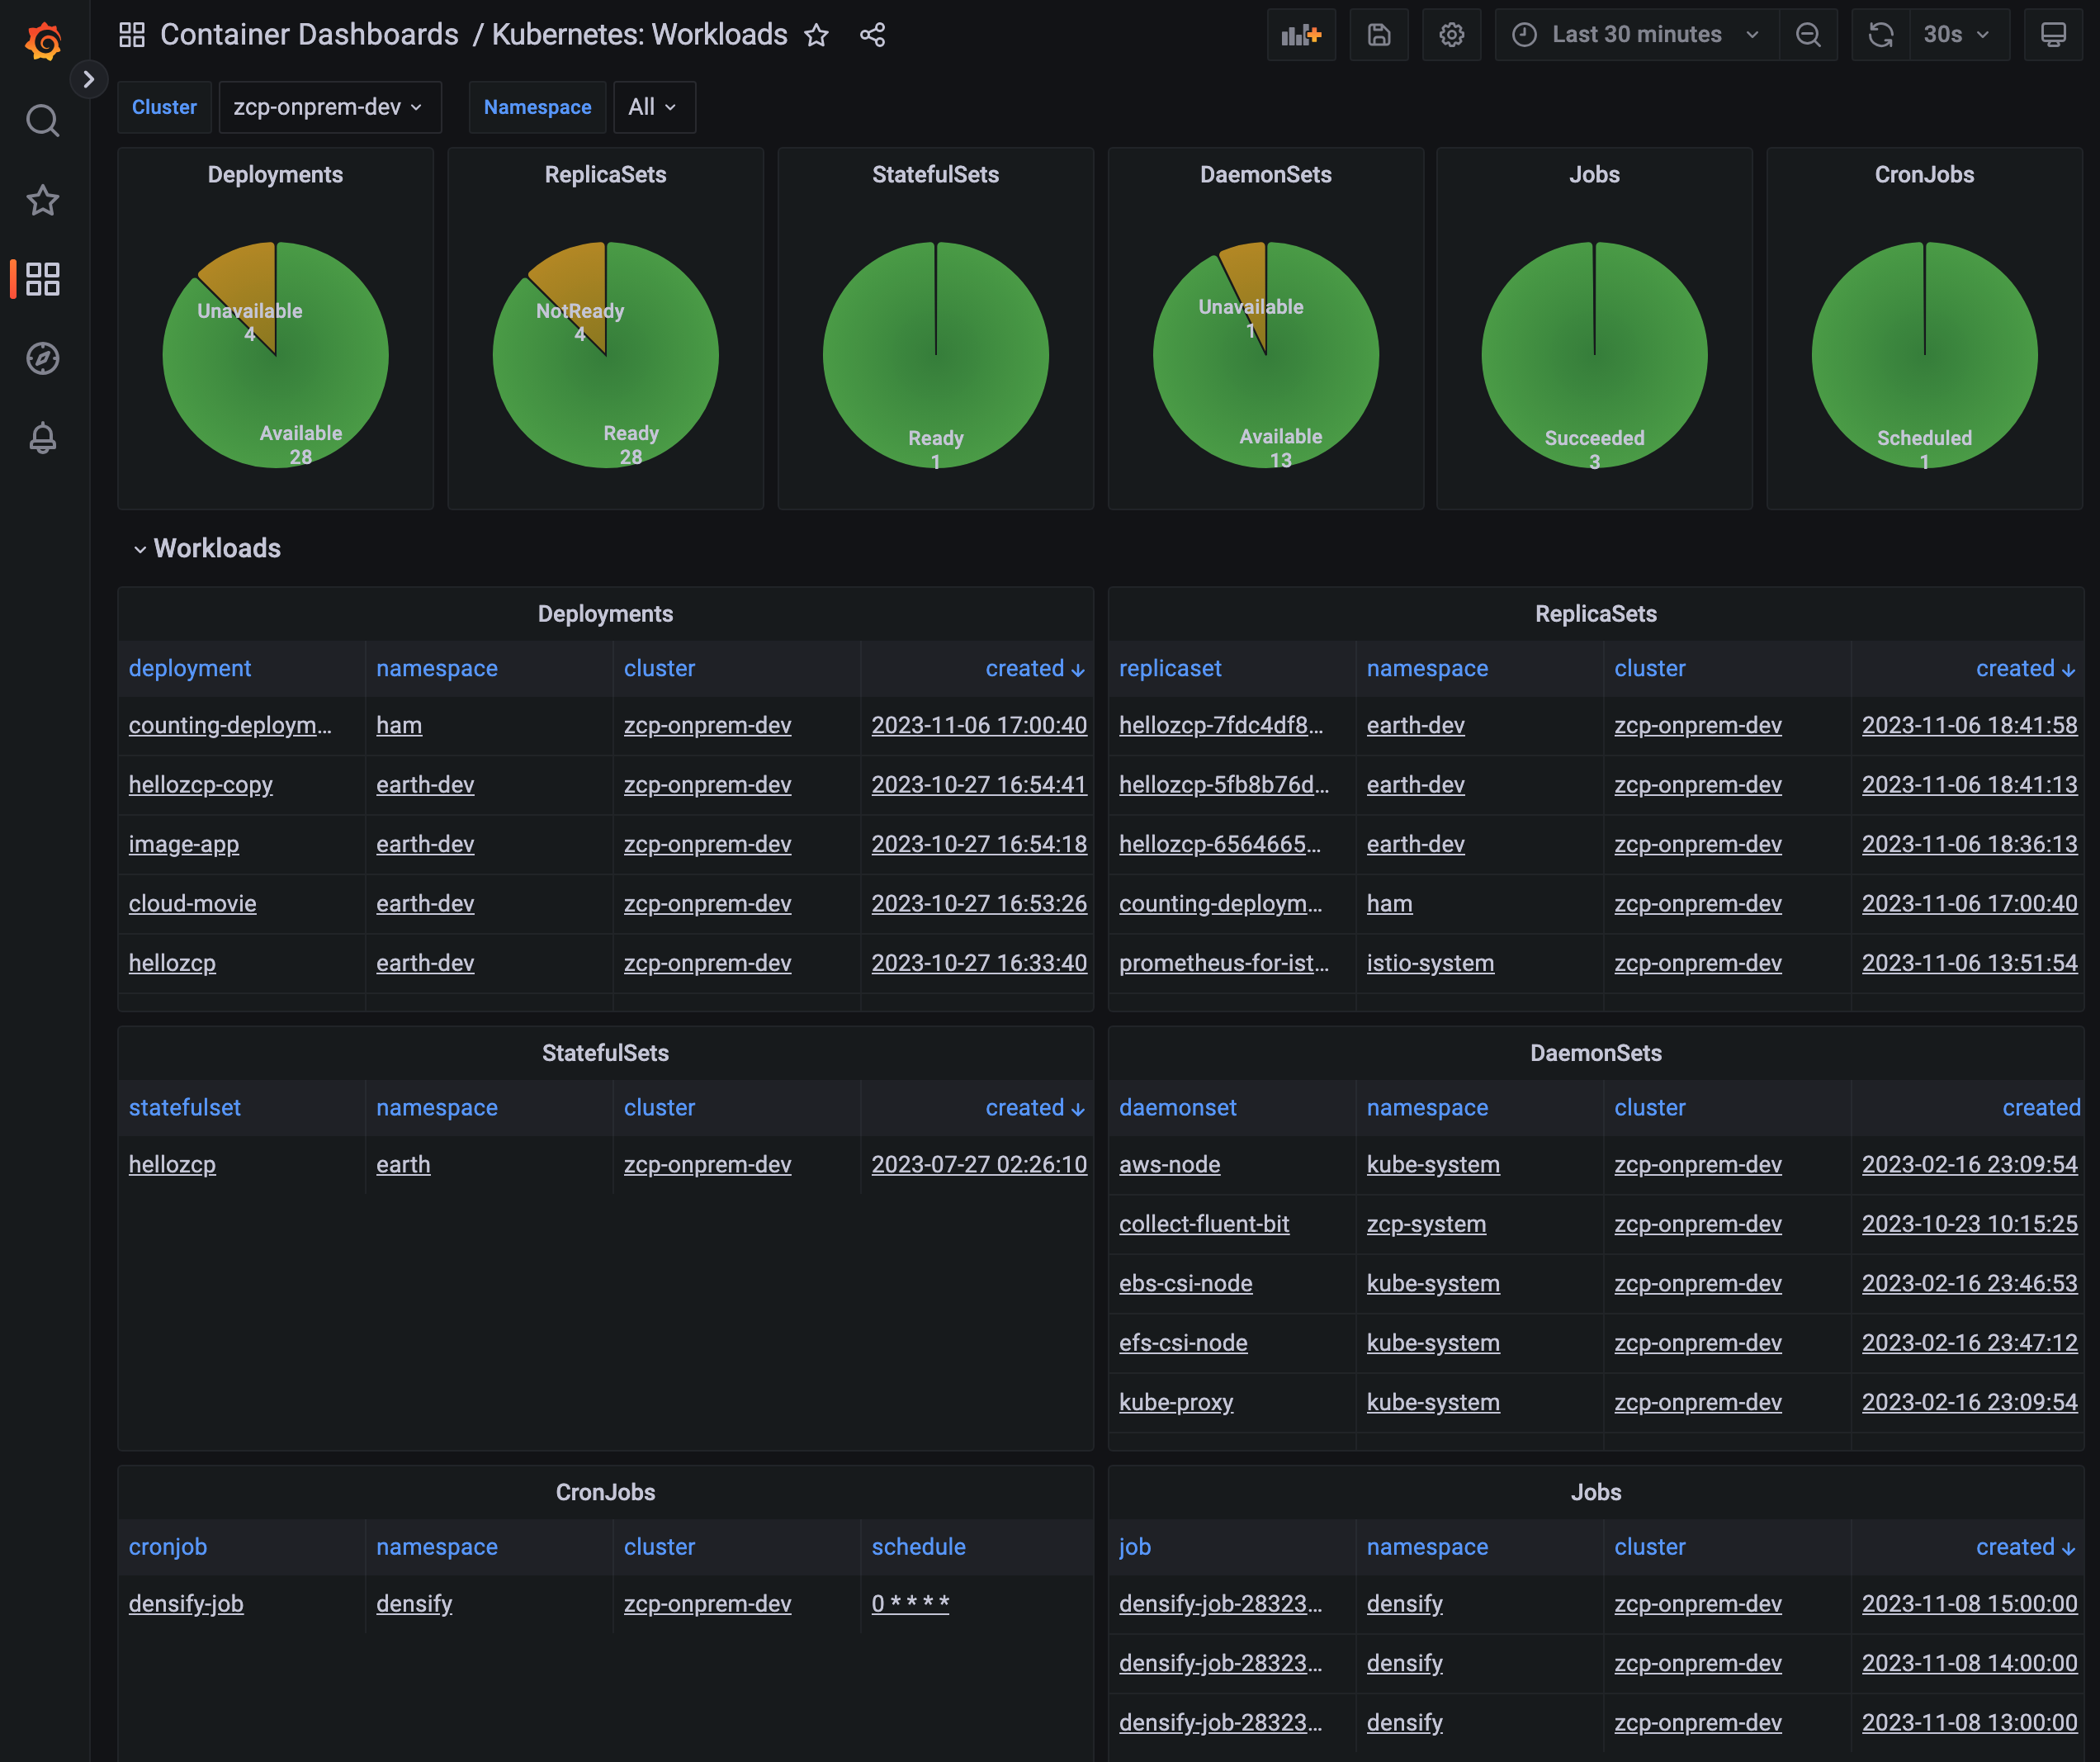
Kubernetes: Workloads
This is a dashboard that displays information about Workloads (Deployments, ReplicaSets, StatefulSets, DaemonSets, Jobs, CronJobs).
| Panel | Description |
|---|---|
| Deployment | The number of Deployments in Available / Unavailable state |
| ReplicaSets | The number of ReplicaSets in Ready / NotReady state |
| StatefulSets | The number of StatefulSets in Ready / NotReady state |
| DaemonSets | The number of DaemonSets in Available / Unavailable state |
| Jobs | The number of Jobs in Succeeded / Active / Failed state |
| CronJobs | The number of CronJobs in Suspend True / False state |
| Deployments | Information about Deployments. Clicking an item navigates to Container Dashboards / Kubernetes: Deployment |
| ReplicaSets | Information about ReplicaSets. Clicking an item navigates to Container Dashboards / Kubernetes: ReplicaSet |
| StatefulSets | Information about StatefulSets. Clicking an item navigates to Container Dashboards / Kubernetes: StatefulSet |
| DaemonSets | Information about DaemonSets. Clicking an item navigates to Container Dashboards / Kubernetes: DaemonSet |
| CronJobs | Information about CronJobs. Clicking an item navigates to Container Dashboards / Kubernetes: CronJob |
| Jobs | Information about Jobs. Clicking an item navigates to Container Dashboards / Kubernetes: Job |