4. Monitoring & Logging
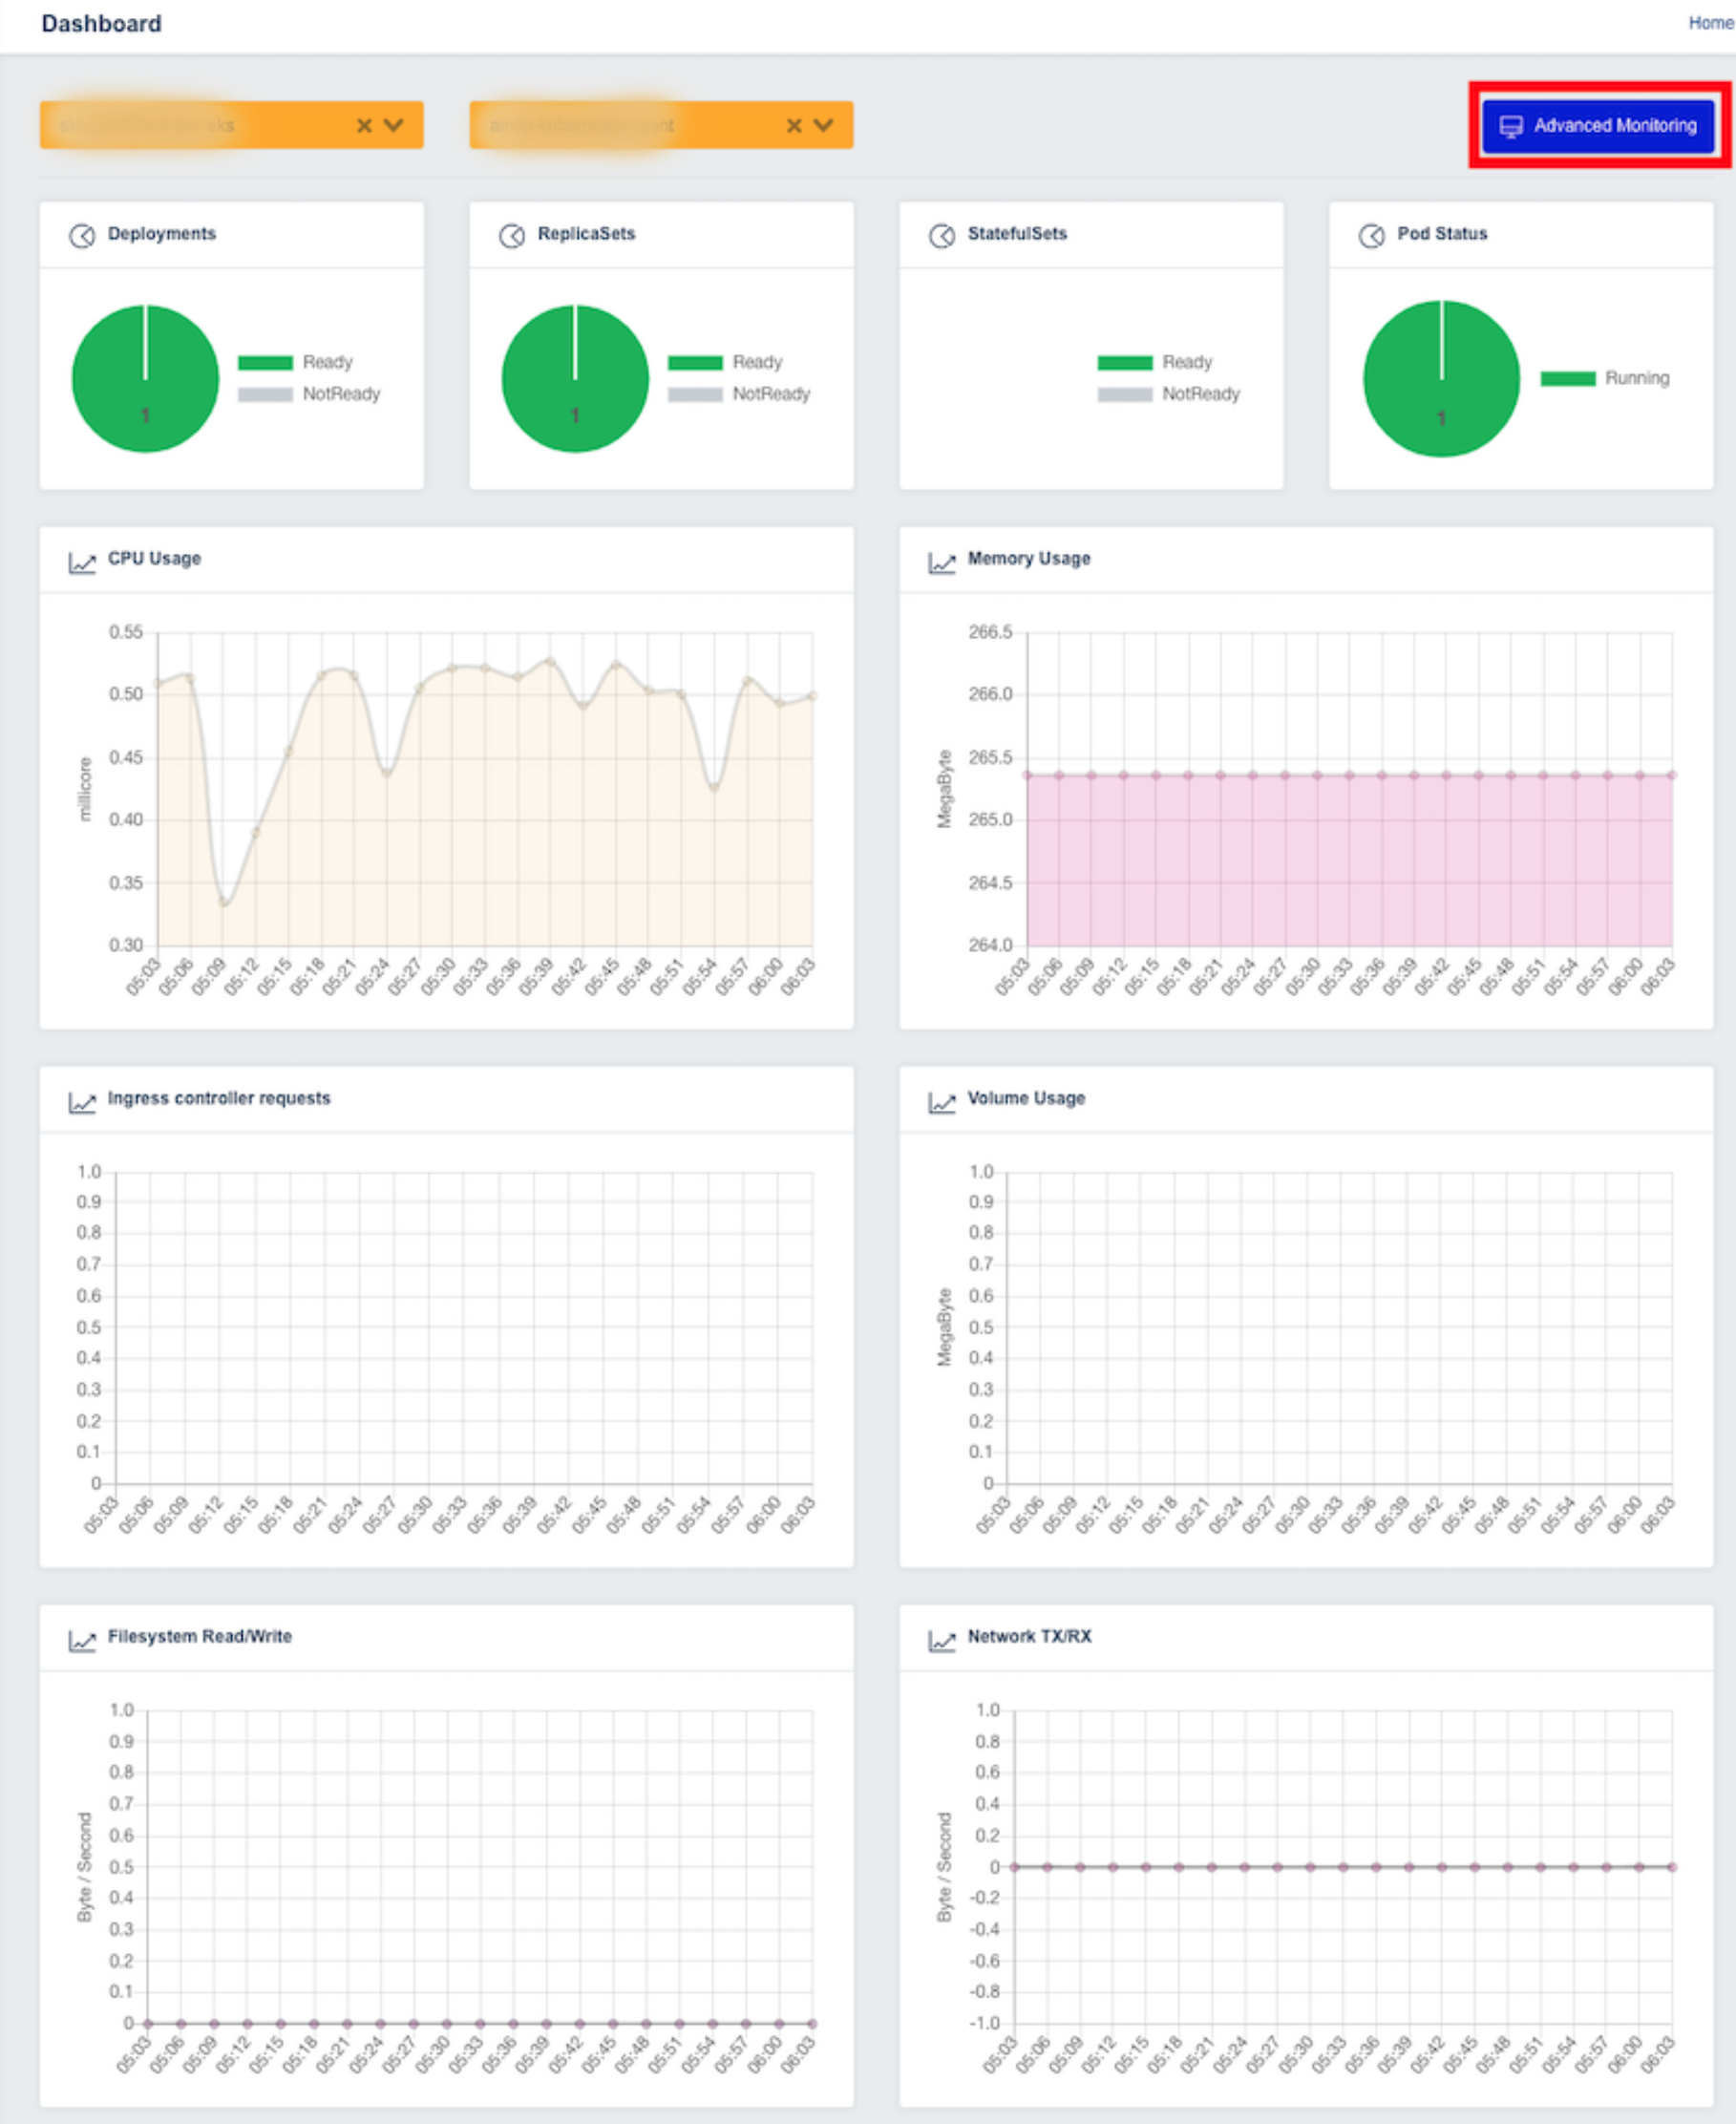
モニタリングダッシュボード
プロジェクトの権限を持つユーザーは、プロジェクト内のコンテナに関する情報を確認できます。
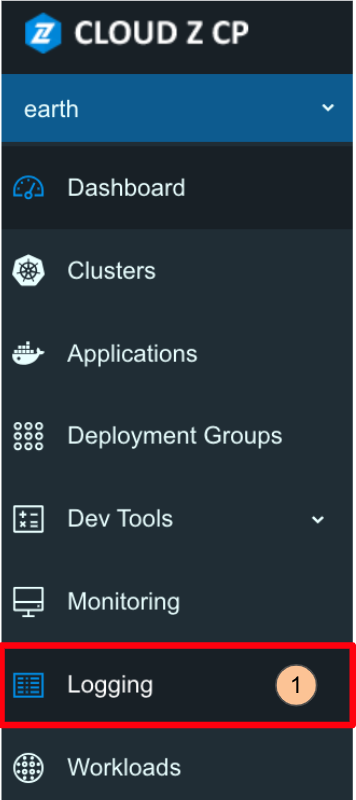
左側のナビゲーションパネルで Monitoring ボタンをクリックしてください。
モニタリング画面では、CPU、メモリ使用量、ファイルシステム、ネットワークI/Oを確認でき、ストレージ使用量やIngressコントローラーのリクエストのステータスをグラフィカルに表示して監視できます。
| Panel | Description |
|---|---|
| Deployment | 選択したクラスターとネームスペース内の利用可能/利用不可のデプロイメントの数 |
| ReplicaSets | 選択したクラスターとネームスペース内の準備完了/未準備のレプリカセットの数 |
| StatefulSets | 選択したクラスターとネームスペース内の準備完了/未準備のステートフルセットの数 |
| Pod Status | 選択したクラスターとネームスペース内のポッドの数(失敗/保留/実行中/成功) |
| CPU Usage | 選択したクラスターとネームスペース内のコンテナのCPU使用量 |
| Memory Usage | 選択したクラスターとネームスペース内のコンテナのメモリ使用量 |
| Ingress controller requests | 選択したクラスターとネームスペース内のIngressコントローラーへのリクエストの数 |
| Volume Usage | 選択したクラスターとネームスペース内のPVC(永続ボリュームクレーム)の使用状況 |
| Filesystem Read/Write | 選択したクラスターとネームスペース内のファイルシステムの読み書き使用状況 |
| Network TX/RX | 選択したクラスターとネームスペース内のネットワークTX/RX使用状況 |
詳細情報については、右上隅の Advanced Monitoring ボタンをクリックしてGrafanaにアクセスしてください。
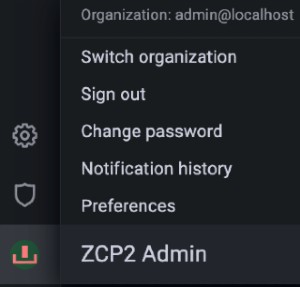
Grafanaでのモニタリングメトリクスへのアクセス
Webコンソールを通じてアクセスすると、自動的にログインされます。 ウェブブラウザを介してGrafanaドメインURLにアクセスする場合、同じCloud Z CPアカウントの資格情報を使用してログインできます。
例のURL: https://REALM_NAME-monitoring.REALM_NAME.cloudzcp.net/
組織の変更
Grafanaの組織は、Webコンソールに登録されたプロジェクトユニットによって区別されます。
Grafanaの左下隅にあるアイコンをクリックして、アカウント情報と関連メニューを表示します。
Current Orgメニューを選択して、組織を切り替えます。
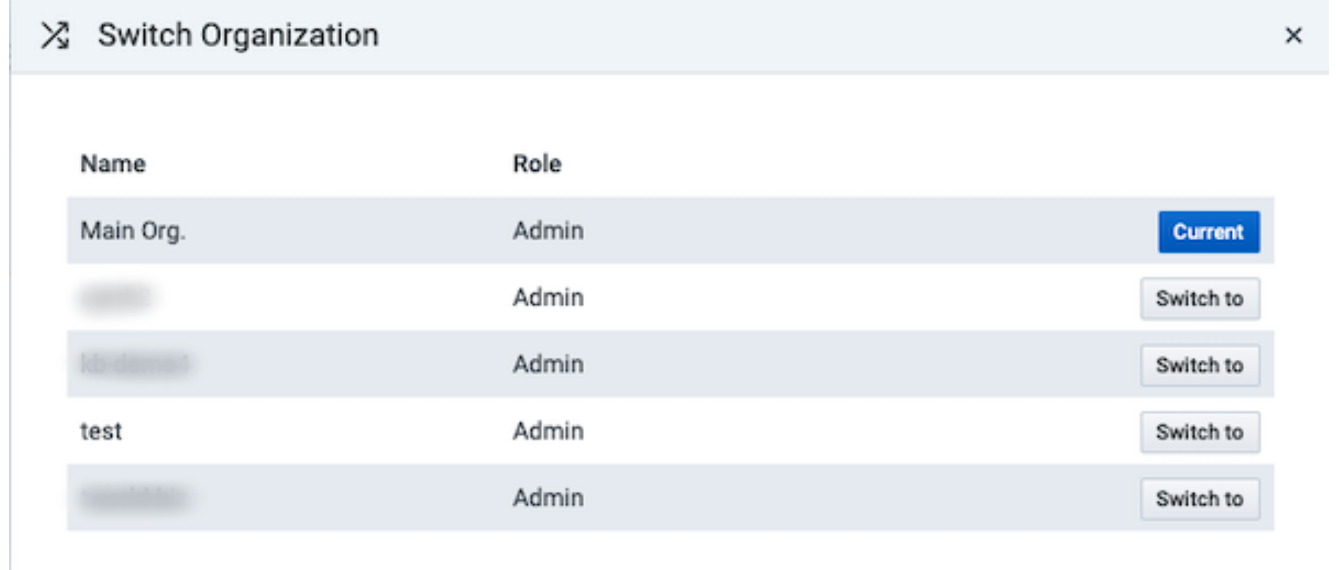
組織切り替えポップアップでは、現在の組織がCurrentでマークされています。
切り替えたい組織のSwitch toボタンをクリックします。
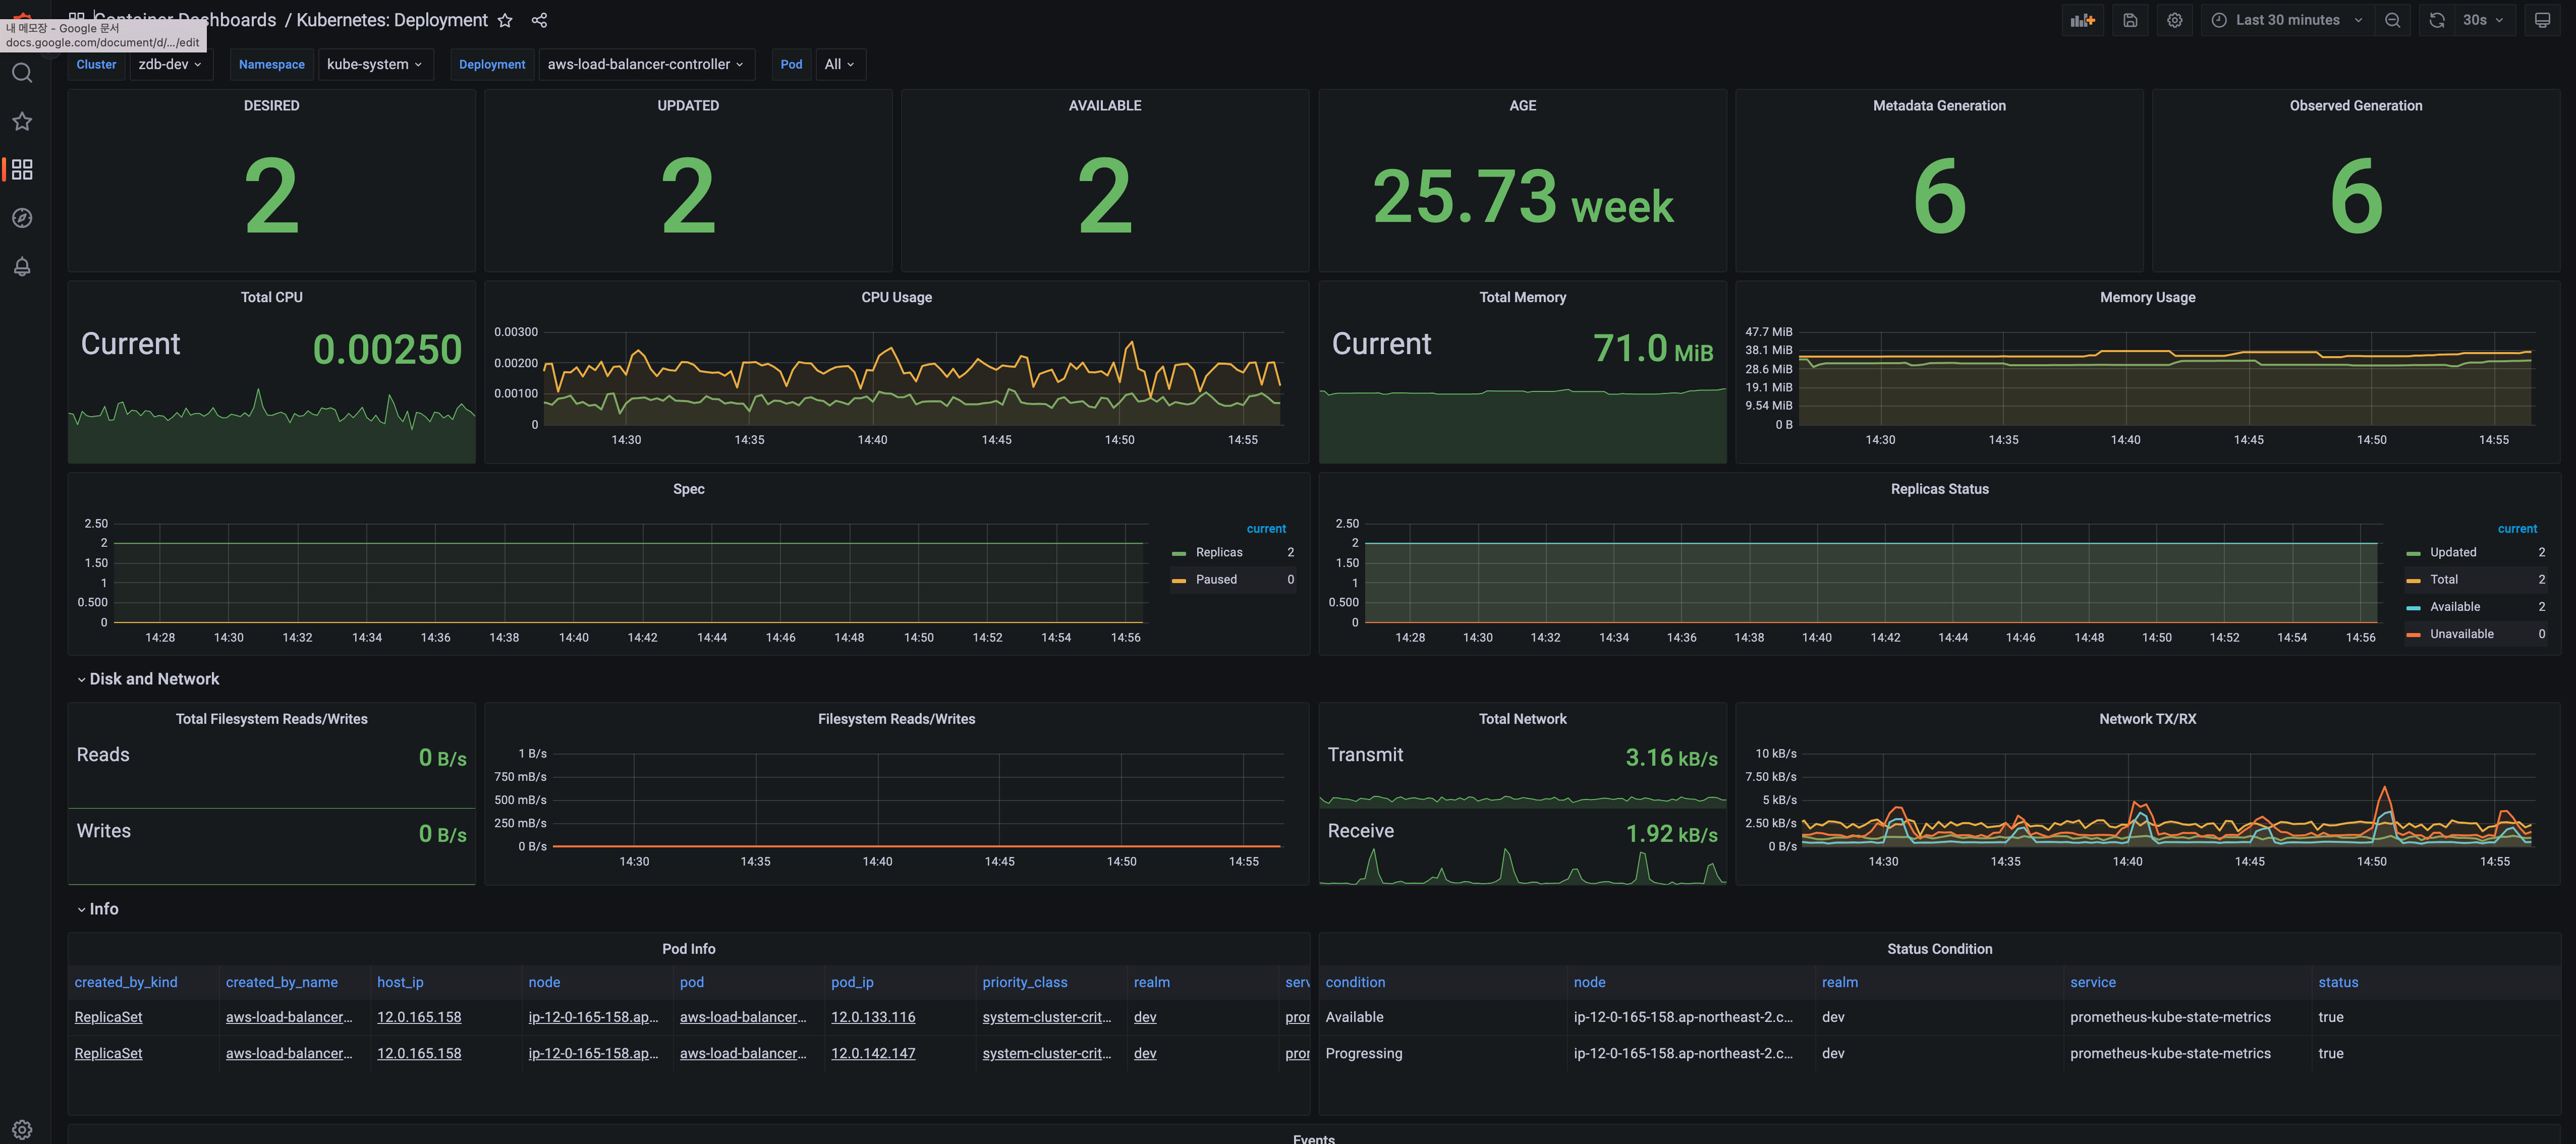
ダッシュボード
収集したメトリックデータをダッシュボードを通じて監視できます。
左側のDashboardアイコンをクリックし、Browseタブに移動します。
利用可能なダッシュボードは、権限や組織によって異なる場合があります。
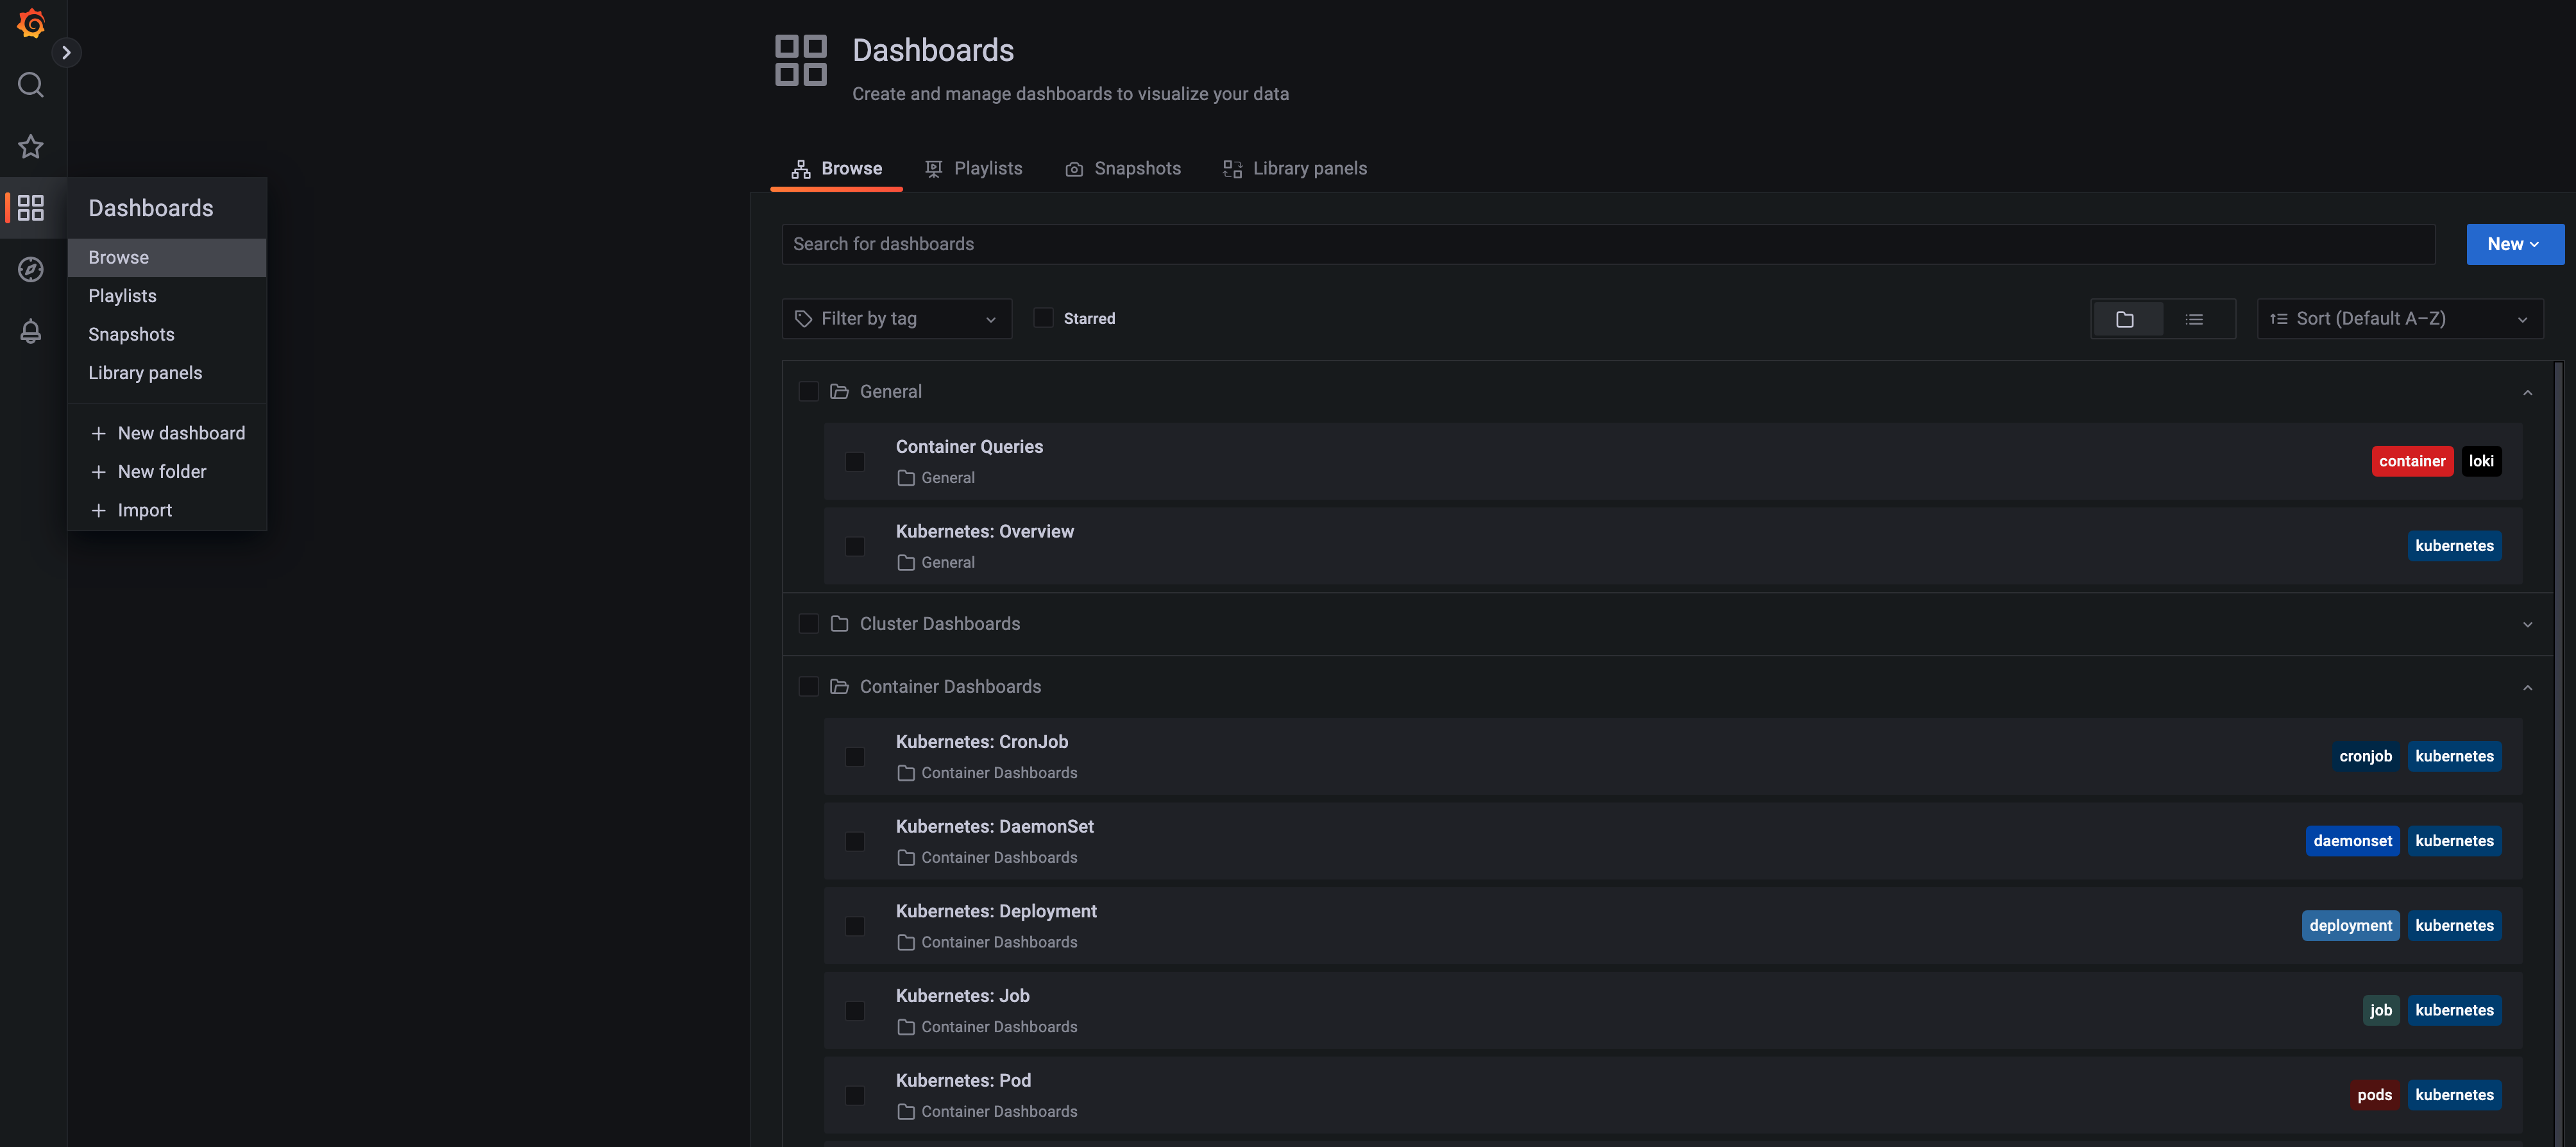
例としてKubernetes: Deploymentダッシュボードをクリックします:
右上隅でsearch periodとrefresh intervalを設定できます。
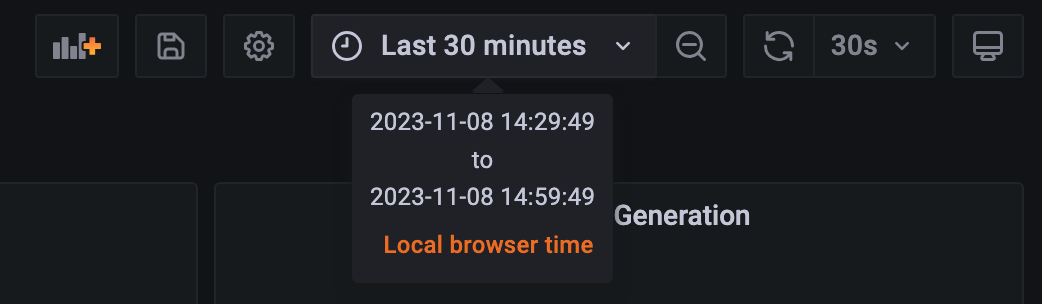
time range(デフォルト: 最後の1時間)にカーソルを合わせると、現在の検索期間が表示されます。
時間フィールドをクリックして、検索期間を設定するためのポップアップを開きます。
Absolute time rangeまたはRelative time rangeを選択できます。
右側のフィールドでは、refresh intervalを選択できます。
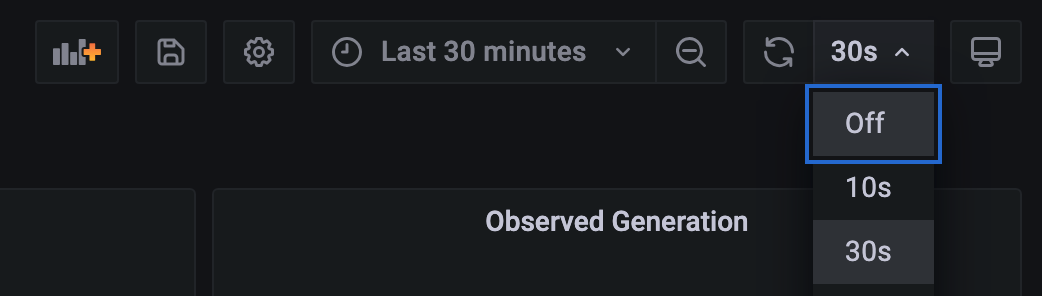
refresh icon(デフォルト: 10秒)をクリックすると、メトリックの更新頻度を設定できます。
上部のオプション Off は自動更新を無効にし、他のオプションは5秒から1日までの範囲です。
リフレッシュ間隔を選択すると、選択した設定が適用されます。
ダッシュボードの種類
ダッシュボードの種類に関する詳細は、Grafana Monitoring Dashboards ページを参照してください。
OpenSearch ダッシュボードのアクセスログ
ZCPはログツールとしてOpenSearch Stackをサポートしています。 Logging メニューをクリックすることで、保存されたログデータにアクセスできます。
テナントの変更
テナントは、ZCPウェブコンソールで作成されたプロジェクトユニットによって分類されます。
ログをクエリする前に、テナントを変更しましょう。
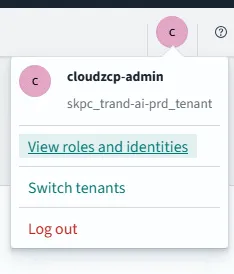
OpenSearch Dashboardsの右上隅にあるアイコンをクリックして、ログイン中のアカウントに関する情報と関連メニューを表示します。
そこから、テナントを変更するために Switch tenants メニューを選択します。
- 右上隅に表示されている
cと表示されたアイコンをクリックし(キャプチャされた画像の英語のテキストは、ログイン中のアカウントによって異なる場合があります)、Switch tenants ボタンをクリックします。
-
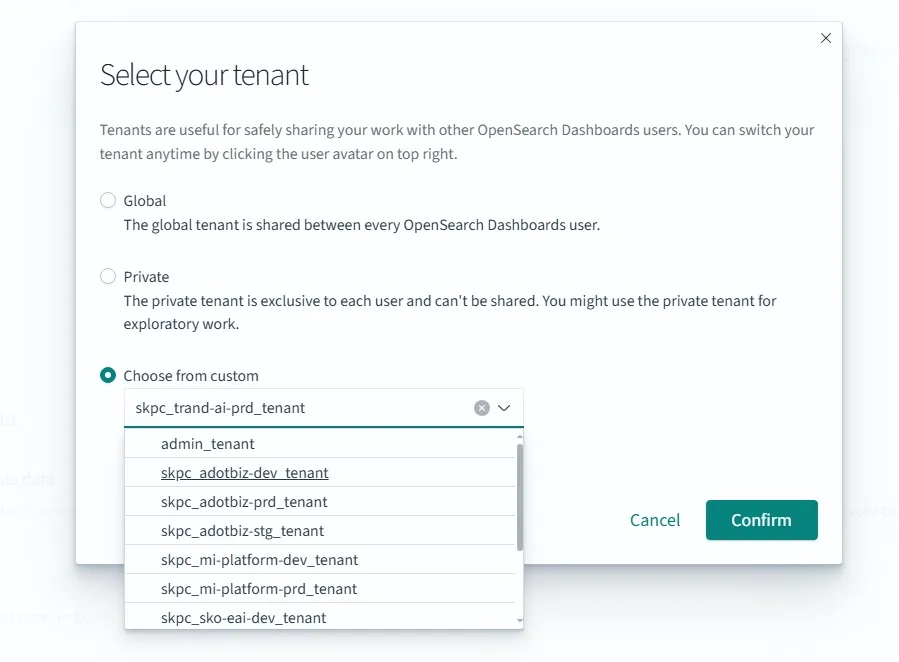
利用可能なテナントタイプから Choose from custom を選択します。
- global: すべてのユーザーがアクセスできるパブリックテナント。
- Private: ログイン中のユーザーのみがアクセスできるテナント。
- Choose from custom: ログイン中のアカウントがアクセスできるカスタムテナントを選択できる(ログイン中のアカウントがアクセスできるプロジェクト)。
-
以前に作成したプロジェクト
dev_demo_tenantをクリックします(プロジェクト名はユーザーごとに異なる場合があります)。 -
テナントを変更するために Confirm をクリックします。
発見
この画面では、ログをクエリすることができます。前のステップでデプロイされたアプリケーションのログを確認できます。(参照: Discover Guide)
ログストレージインデックスはプロジェクトごとに作成されます:
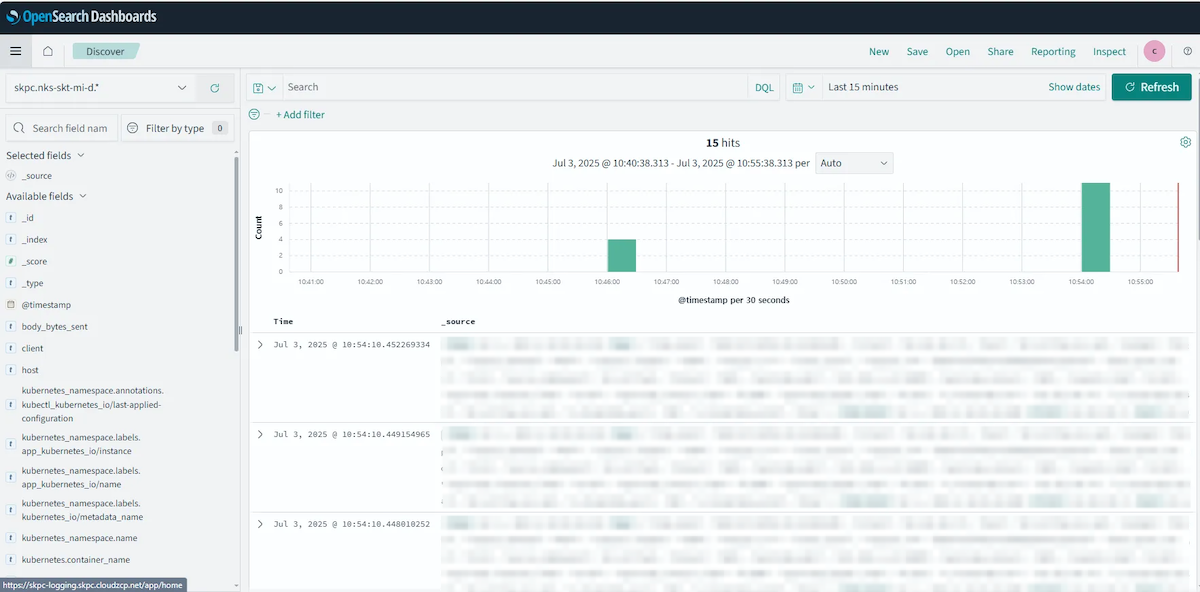
- Search: 指定された時間範囲内でログをフィルタリングするための検索語を入力します。
- 特定の単語(例: error)や特定の key-value ペアを含むログを検索できます。
- Filter: Available fields で利用可能なフィールドに基づいてデータをフィルタリングして表示します。
- ログをクエリするための時間範囲を指定できます。
- 右側のサマリーパネルにフィールドを追加するには、左側の Available fields で目的のフィールドにカーソルを合わせ、Add ボタンをクリックします。