GPU Overview
Accessing the GPU Overview Page
Scheduler > GPU Overview
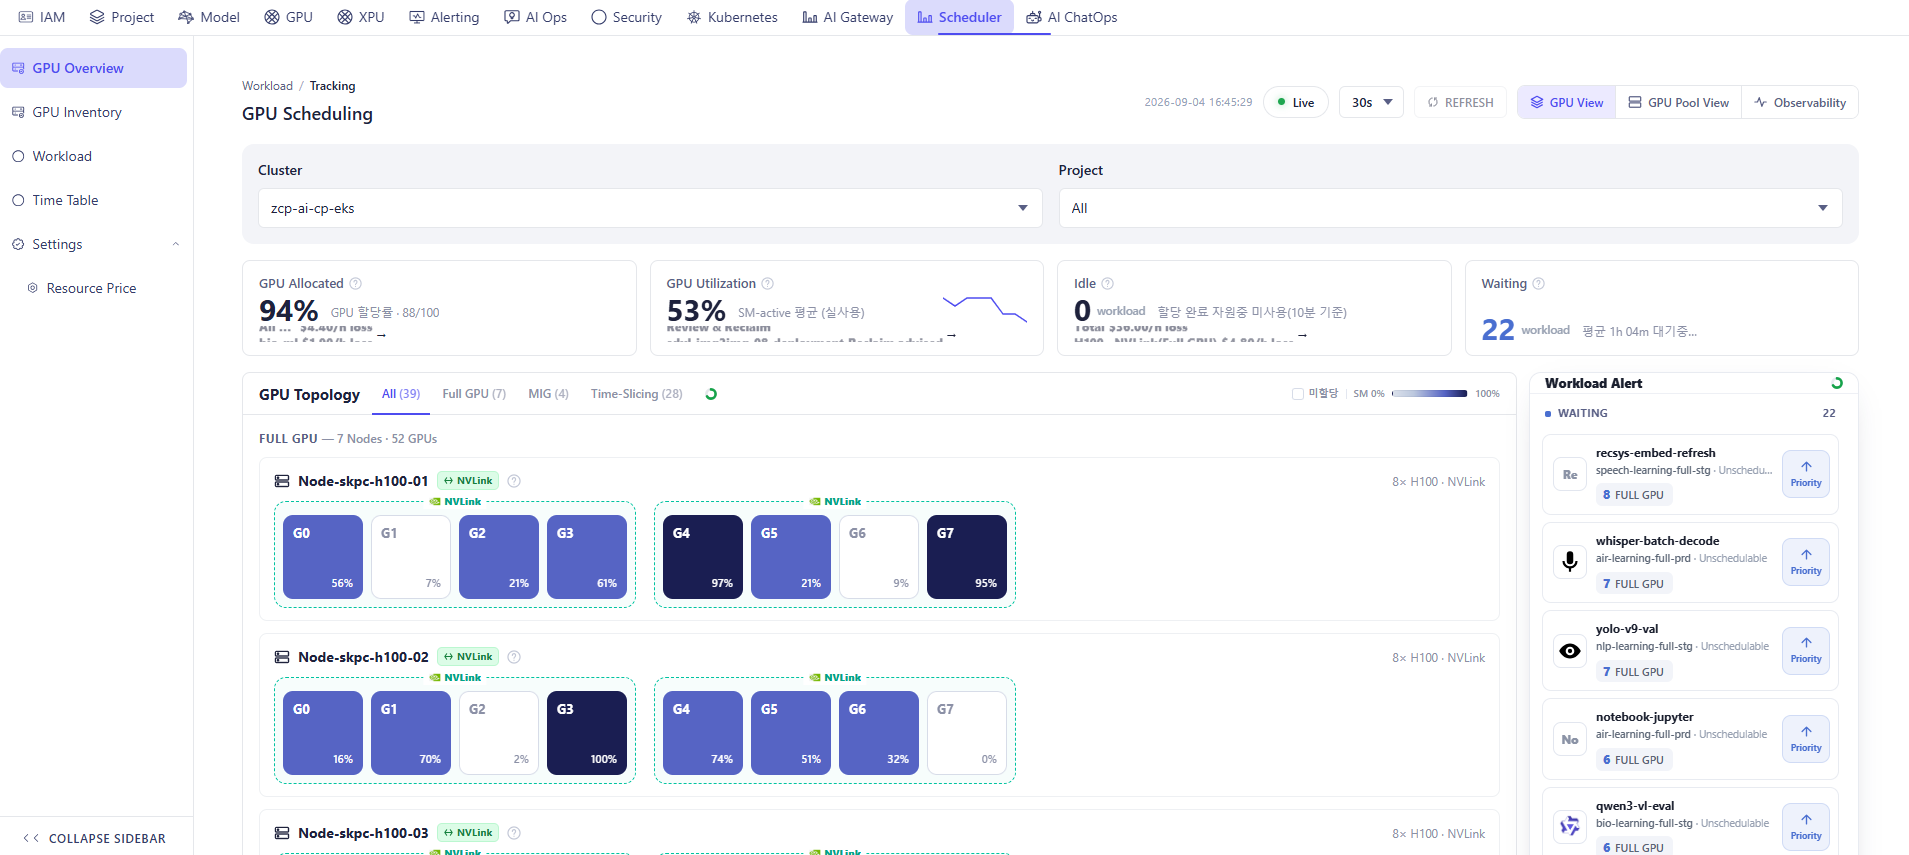
1. Page Header

| Element | Description |
|---|---|
| Live indicator | Green dot + "Live" label when auto-polling is active; shows "Paused" when polling is suspended, with a timestamp of the last successful fetch next to it. |
| Polling interval selector | Dropdown to choose the auto-refresh cadence: 5s / 10s / 15s / 30s / 60s |
| REFRESH button | Manually triggers an immediate refresh of the page's data without a full reload |
2. Scope Filters
Located directly below the page header, shared by both view modes. Filters narrow the data shown in the KPI cards, GPU Topology / GPU Pool cards, and Workload Alert panel simultaneously.
| Filter | Description |
|---|---|
| Cluster | Select a specific cluster, or view all clusters aggregated ("All"). |
| Project | Limit the view to GPU pools assigned to a specific project ("All" = every project). In project-scoped entry points this is locked to the current project |
3. KPI Cards
3.1 GPU Allocated

- Purpose: share of total GPU capacity (Full GPU / MIG slice / Time-Slicing) occupied by at least one workload pod, regardless of whether it is actually computing.
- Calculation: (GPU units with ≥ 1 pod occupant) ÷ (total GPU units) × 100.
- Action: click the value to navigate to GPU Inventory filtered to unallocated (free) GPUs; click the ticker/action link at the bottom of the card to open the Idle Resource Loss — Details modal
- Interpretation: high Allocated + low Utilization means GPUs are reserved but not computing — the most cost-effective reclamation targets.
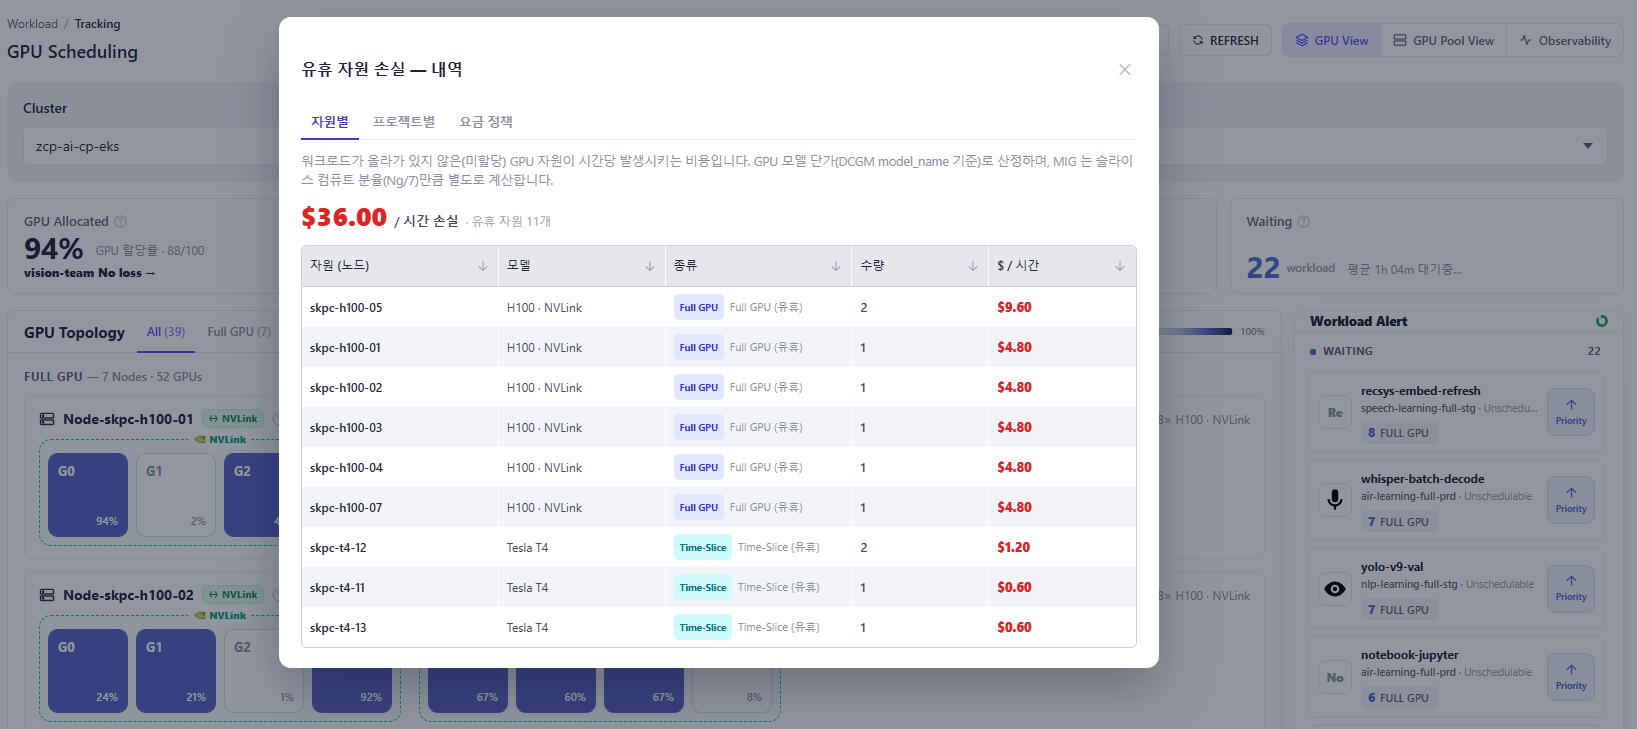
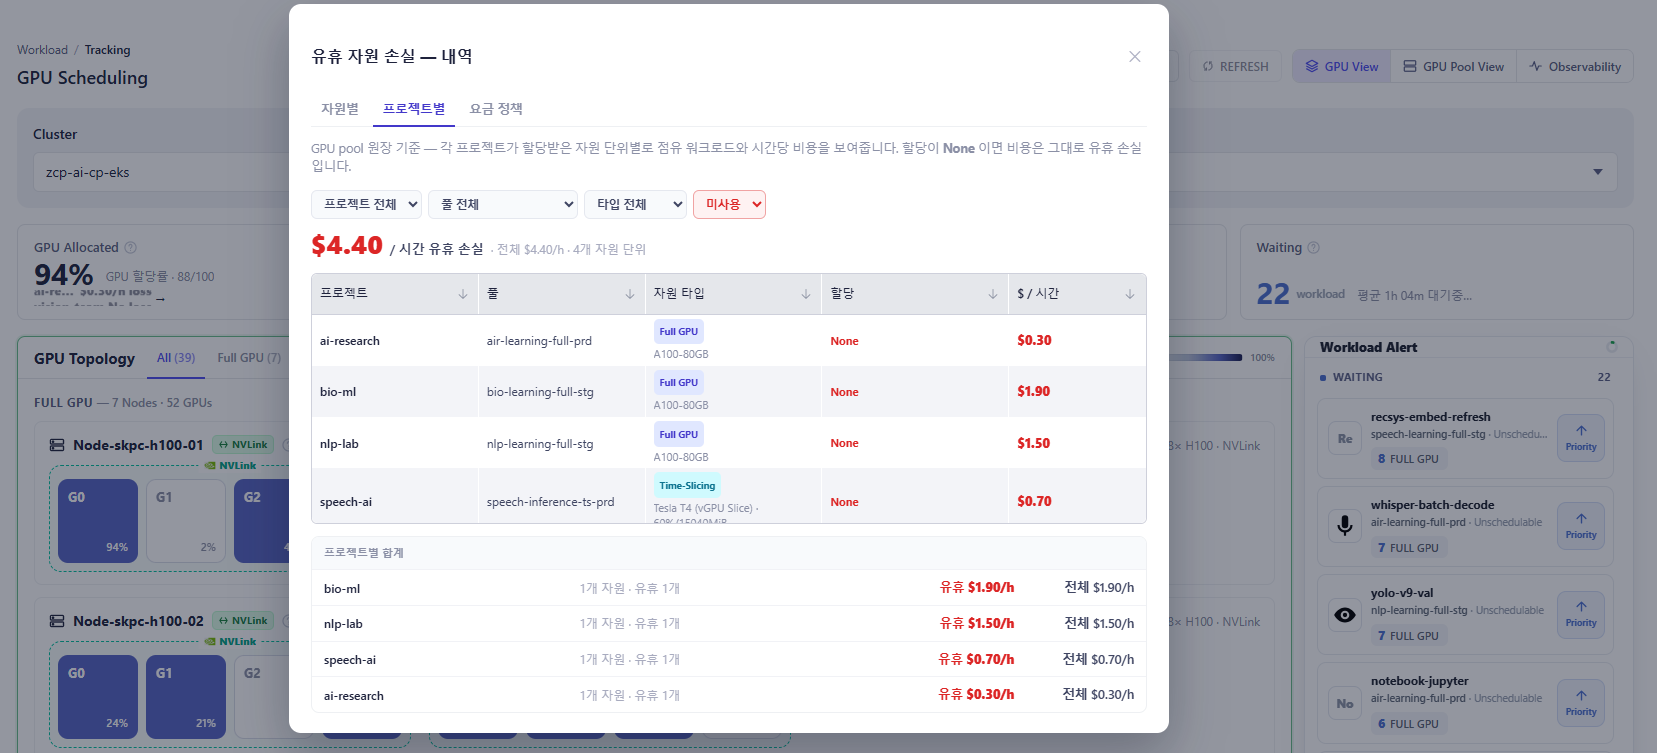
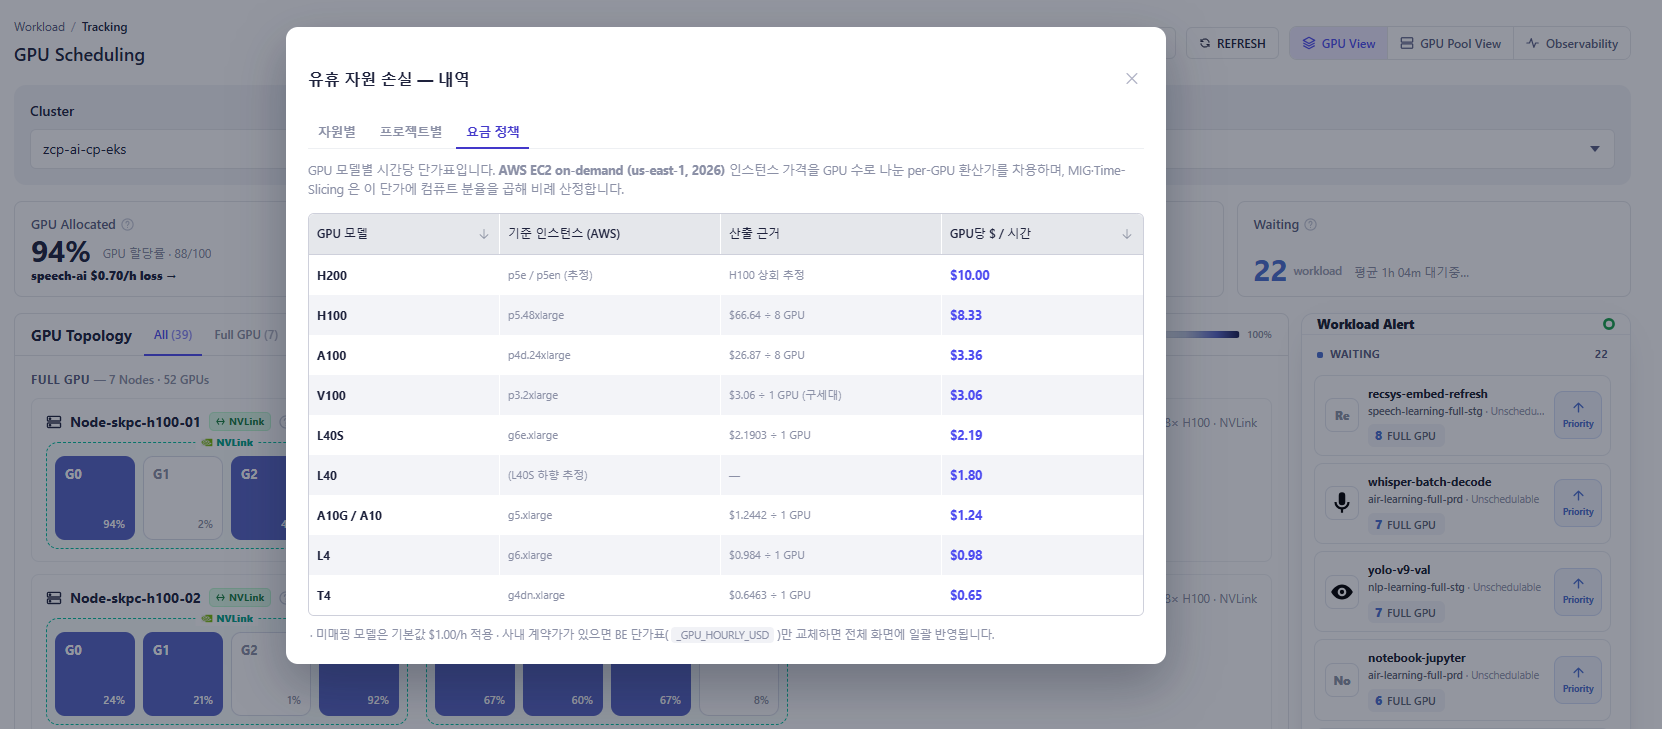
Idle Resource Loss — Details modal has 3 tabs:
-
By Resource — hourly cost generated by unallocated GPU resources, per GPU model; MIG is prorated by its slice compute fraction
-
By Project — based on the GPU pool ledger; shows the occupying workload and hourly cost per resource unit allocated to each project.
-
Pricing Policy — reference table of the per-GPU hourly rate used everywhere on this page, derived from AWS EC2 on-demand pricingdivided by GPU count per instance; MIG/Time-Slicing are prorated by compute fraction.
3.2 GPU Utilization

- Purpose: average SM-active percentage across all physical GPUs — "are the GPUs actually computing?"
- Calculation: Σ(SM-active % per GPU) ÷ total GPU count, current snapshot (not a 7-day average).
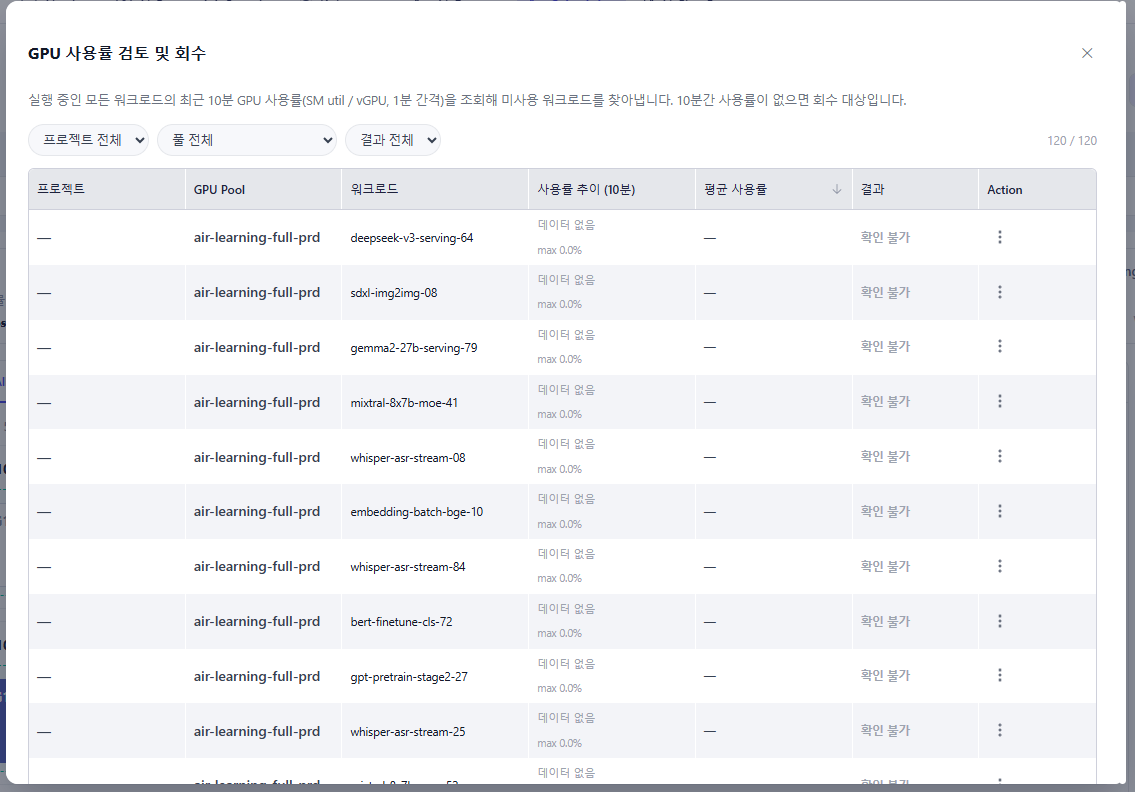
- Action: click the value to navigate to GPU Inventory filtered to idle-occupied GPUs; click the ticker/action link to open GPU Utilization Review & Reclaim.
- Interpretation: low utilization with high allocation signals workloads holding GPUs without running kernels — the highest-priority reclaim/optimization candidates.
GPU Utilization Review & Reclaim modal : queries GPU utilization (SM util / vGPU, 1-minute interval) for the last 10 minutes across all running workloads.
3.3 Idle

- Purpose: surfaces workloads that hold allocated GPUs but have shown no meaningful compute activity for the last 10 minutes — the most expensive form of waste.
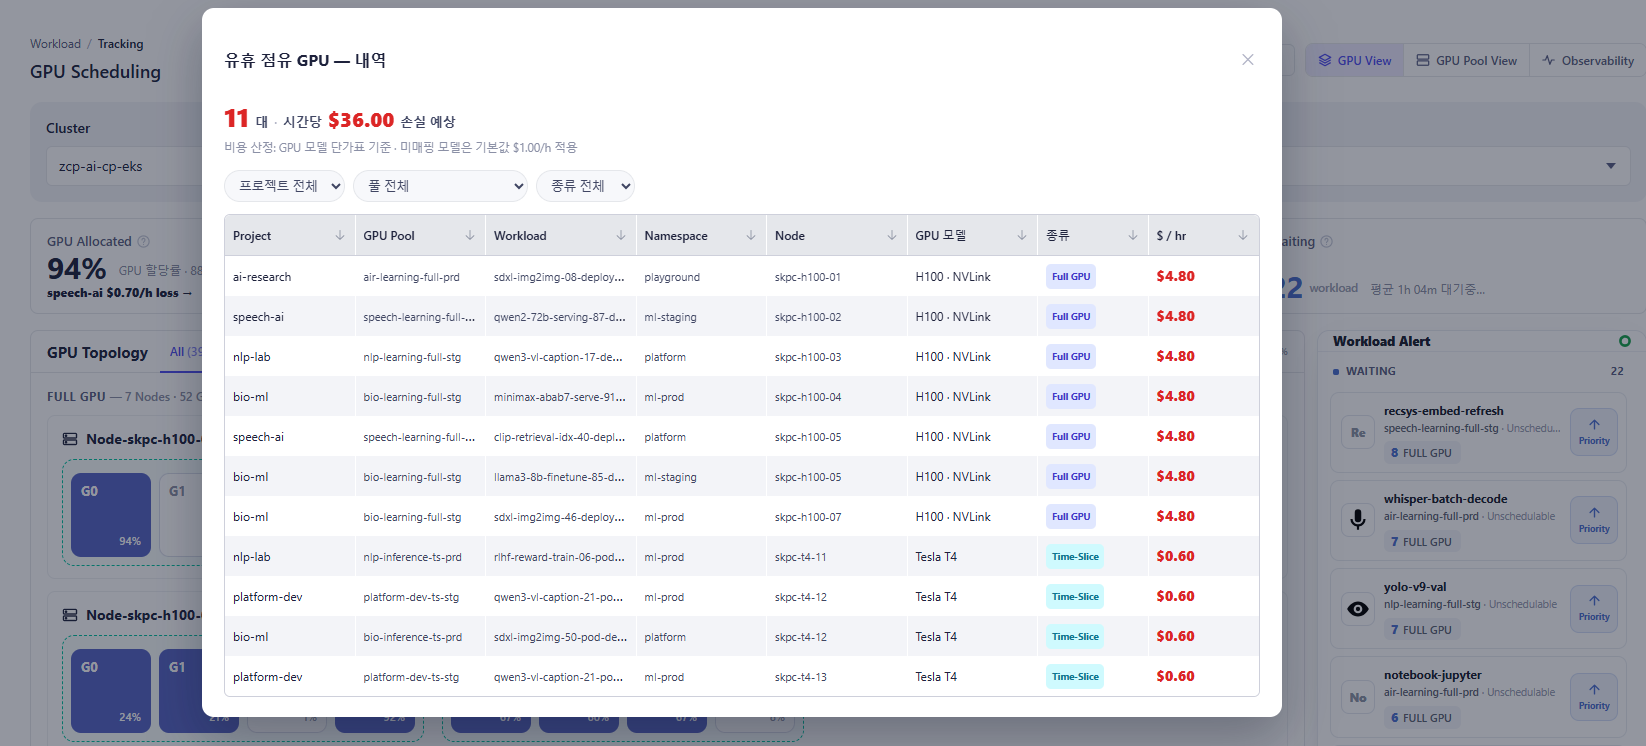
- Calculation: GPU units with occupants ≥ 1 whose SM-active (or util) has stayed below threshold for 10 minutes; the hourly loss estimate sums the price of those units.
- Action: click the ticker at the bottom of the card to open Idle-Occupied GPU — History.
Idle-Occupied GPU — History modal: lists GPU units allocated to a workload with no utilization activity. Sub-text: "Cost basis: GPU model price table · unmapped models use the default 1.00/h"
3.4 Waiting

- Purpose: number of workloads stuck in the queue (Pending/Inqueue) and their average wait time.
- Calculation: count of Volcano PodGroups in Pending/Inqueue phase; average wait = Σ(now − creationTimestamp) ÷ waiting count.
- Interpretation: if available GPUs remain while the queue grows, the cause is usually quota, priority, or fragmentation rather than raw capacity shortage — true capacity shortage requires 0 available GPUs while the queue is non-empty.
4. GPU Topology (GPU View)
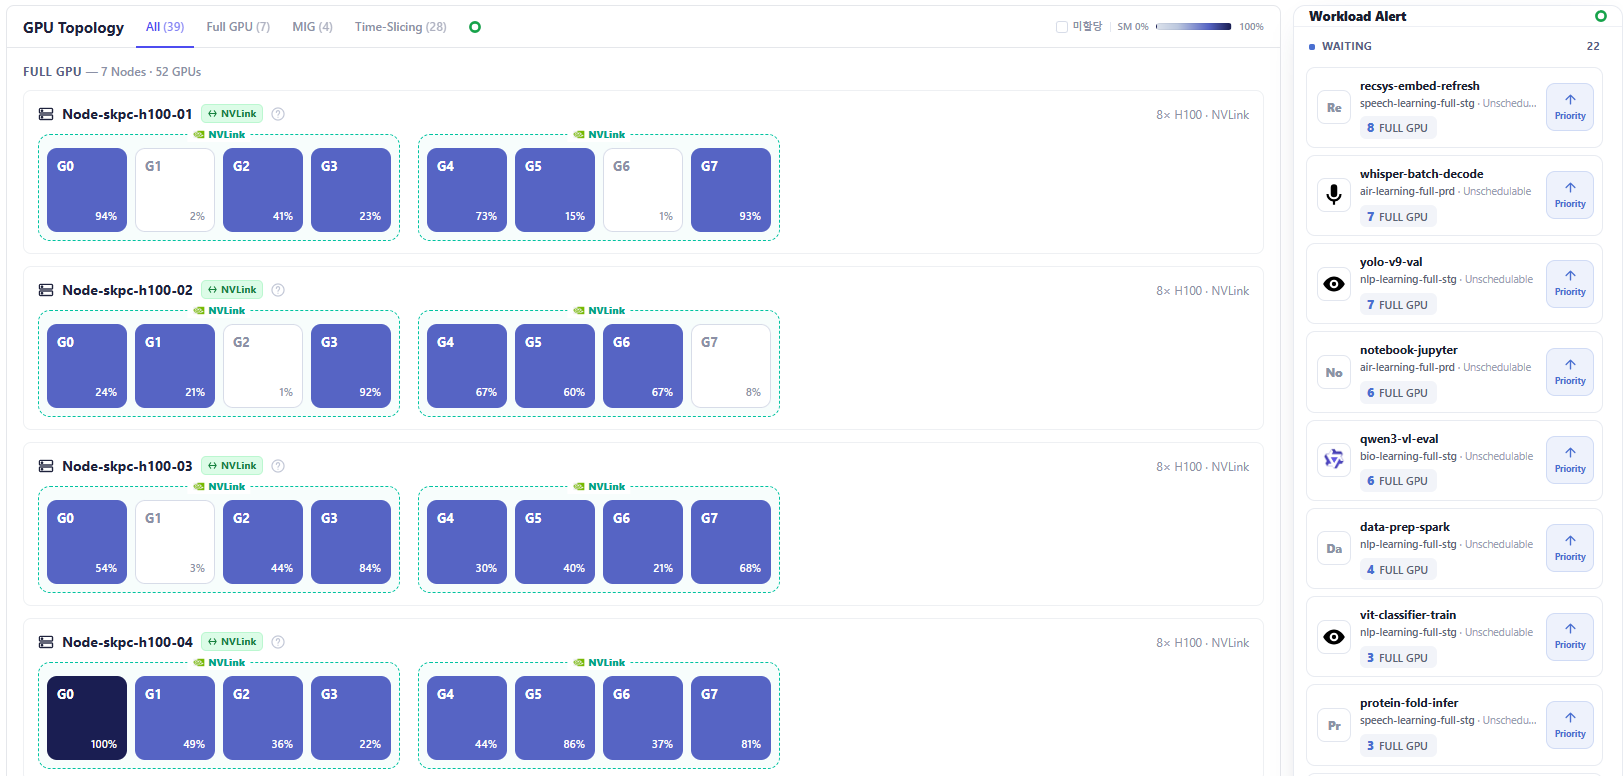
The main body of GPU View shows every physical GPU node in the selected scope, grouped by GPU sharing mode.
4.1 Section header controls
| Control | Description |
|---|---|
| Title | "GPU Topology” |
| Mode tabs | All / Full GPU / MIG / Time-Slicing — filters the node list; each tab shows a count in parentheses |
| SM color legend | Color scale strip (SM 0% → 100%) mapping cell fill color to SM utilization |
4.2 GPU Node Cards
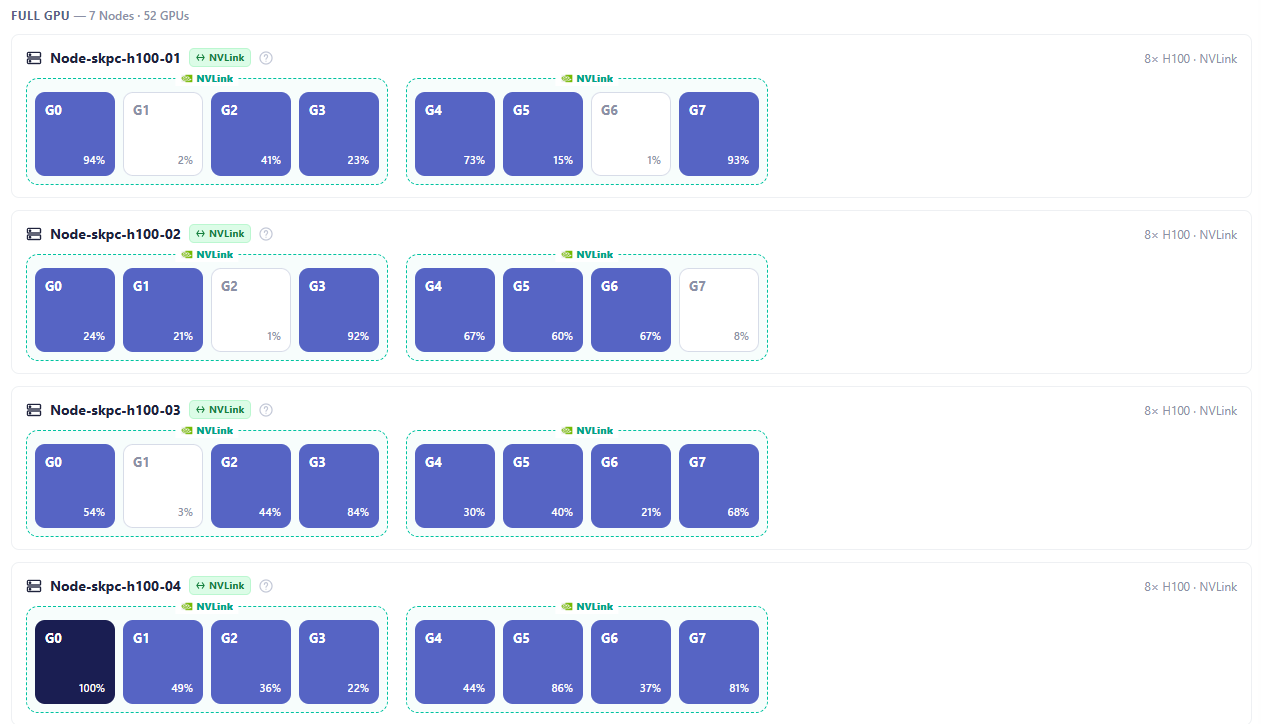
Each card is one physical server node, tagged with its hardware spec. Nodes sharing an NVLink domain are visually grouped with an "NVLink" badge
-
Full GPU mode — each colored cell is one physical GPU (label G0, G1…), filled from light (low SM utilization) to dark (high utilization); gray = unallocated. Hovering a cell shows a popover with POOL / UTIL / MEM / TEMP / POWER
-
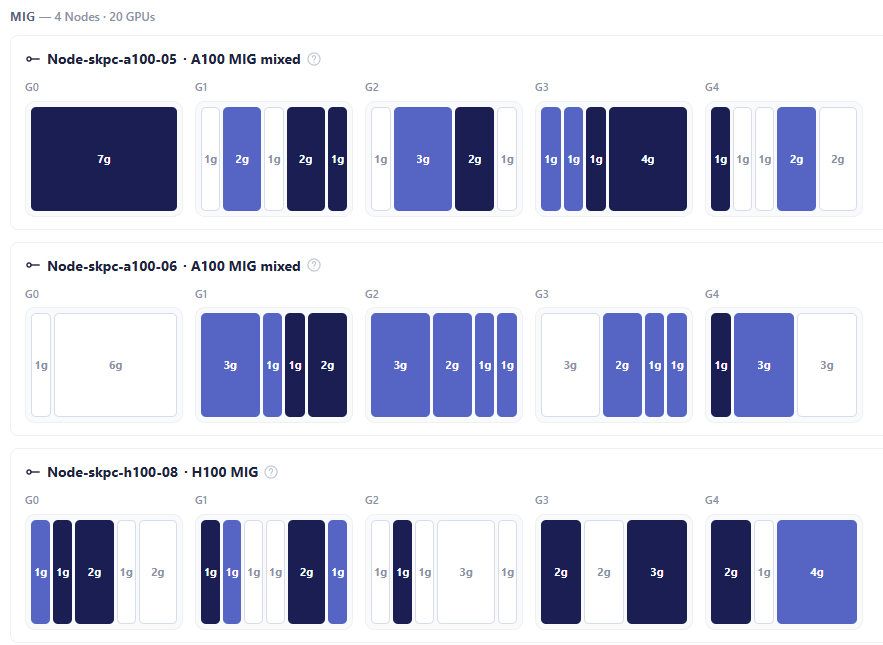
MIG mode — each physical GPU is a group of MIG slice cells, cell width proportional to the slice's compute fraction (labels like 1g, 2g, 4g, 7g); blue = occupied, white/light = free. Hovering a slice shows PROFILE / STATE / WORKLOAD / GPU, where STATE is one of: empty, idle, warm (85–95%), contended (>95%), running.
-
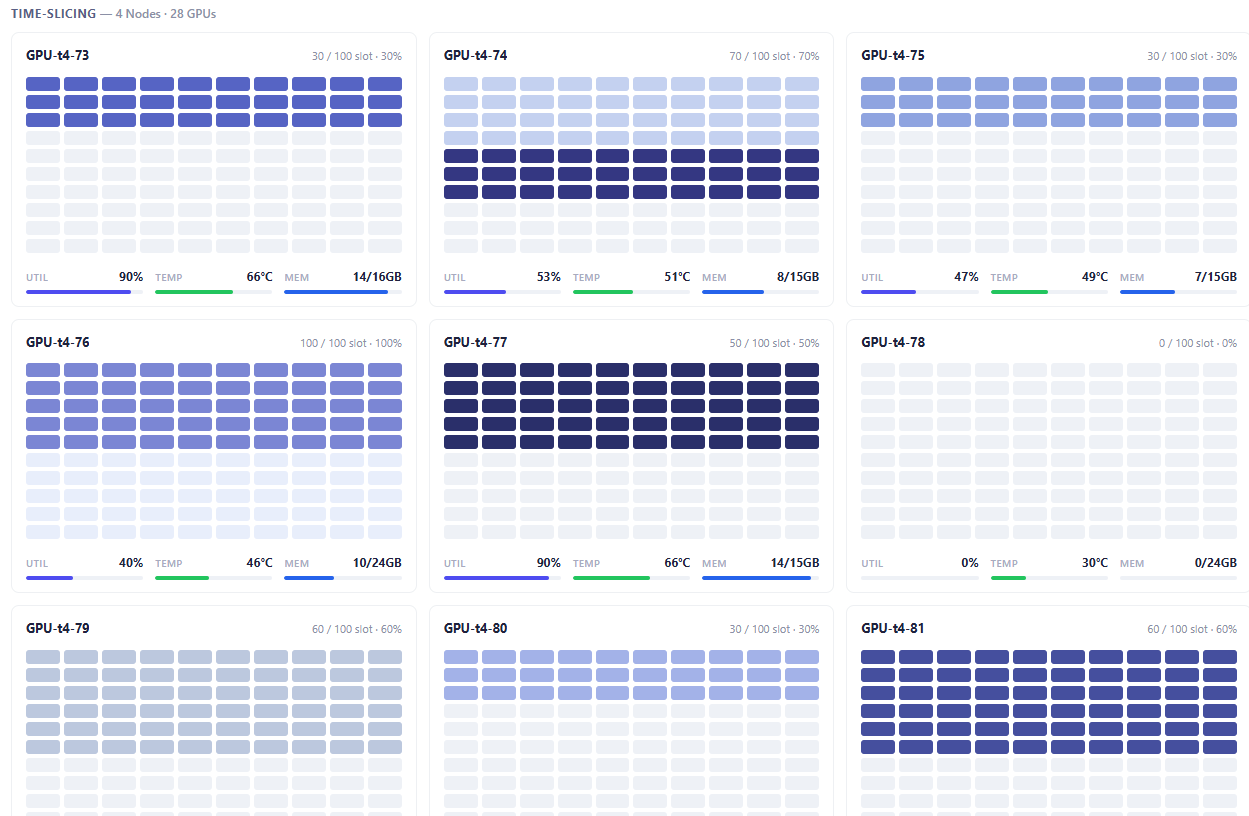
Time-Slicing mode — each card shows a slot grid (dark = occupied, light = free) plus aggregate UTIL / TEMP / MEM for the underlying physical GPU. Hovering an occupied slot shows the workload name (with a "vGPU" badge), the physical GPU id, Pool, Namespace, vGPU cores %, and Memory.
5. GPU Pool View
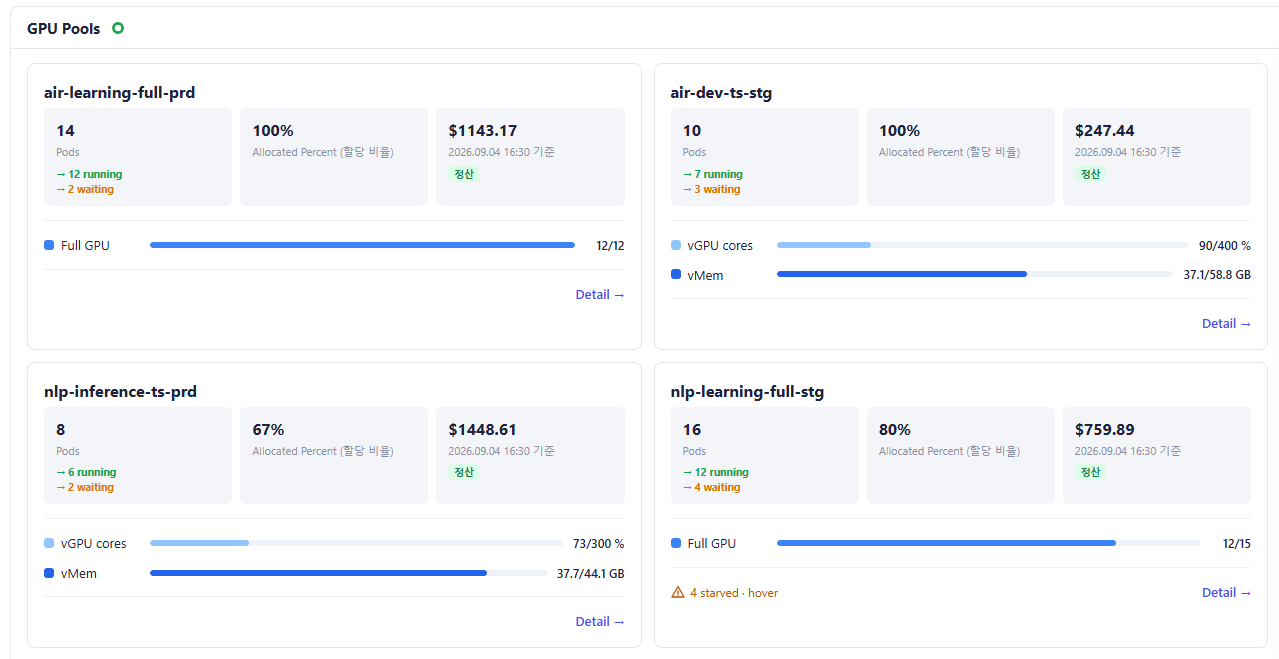
Instead of nodes, this mode shows one card per GPU Pool.
- Pool name (header).
- Pods — total pod count, broken down into → N running / → N waiting
- Allocated Percent — the pool's own allocation ratio.
- Accumulated cost with a source badge: Settled, Rate est, Ledger est., or No cost when no cost information is available. Clicking this metric opens the pool's Accumulated Cost History a period-based ledger of Allocated/Changed/Released events with their hourly rate and cumulative cost.
- Resource breakdown bars — one row per resource kind (e.g. Full GPU 12/12, vGPU cores 90/400 %, vMem 37.1/58.8 GB), each a used/total progress bar.
- A warning line if set (e.g. flagging idle-but-allocated capacity), and a "Detail →" link that opens the pool's GPU Pool Detail
6. Workload Alert Panel
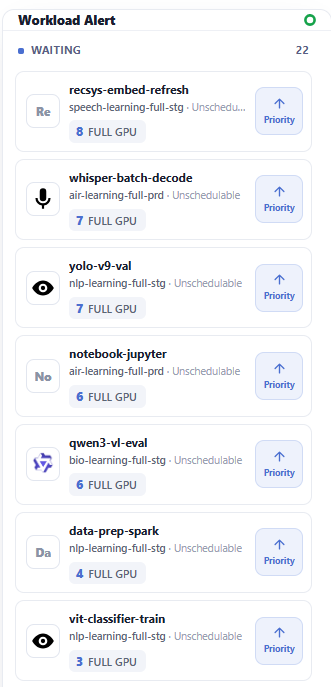
6.1 Waiting
Workloads queued but not yet scheduled to any GPU. Each card shows: logo/monogram, workload name, its GPU Pool tag, a "· Unschedulable" status suffix , a resource chip (GPU count + sharing mode, e.g. "8 FULL GPU"), and a Priority button that opens the GPU Pool Detail page for that workload's pool, where scheduling priority can be managed.
6.2 Idle
Workloads holding allocated GPUs with no meaningful compute for the last 10 minutes (same definition as §3.5). Each card shows the same fields as Waiting, plus the host node, and a Reclaim button instead of Priority — also opening GPU Pool Detail for that pool.
6.3 Running
Actively executing workloads, shown with a resource chip that includes current utilization (e.g. "2 FULL GPU 84%"). Clicking the card itself (no dedicated action button) navigates to GPU Pool Detail.
7. GPU Pool Detail
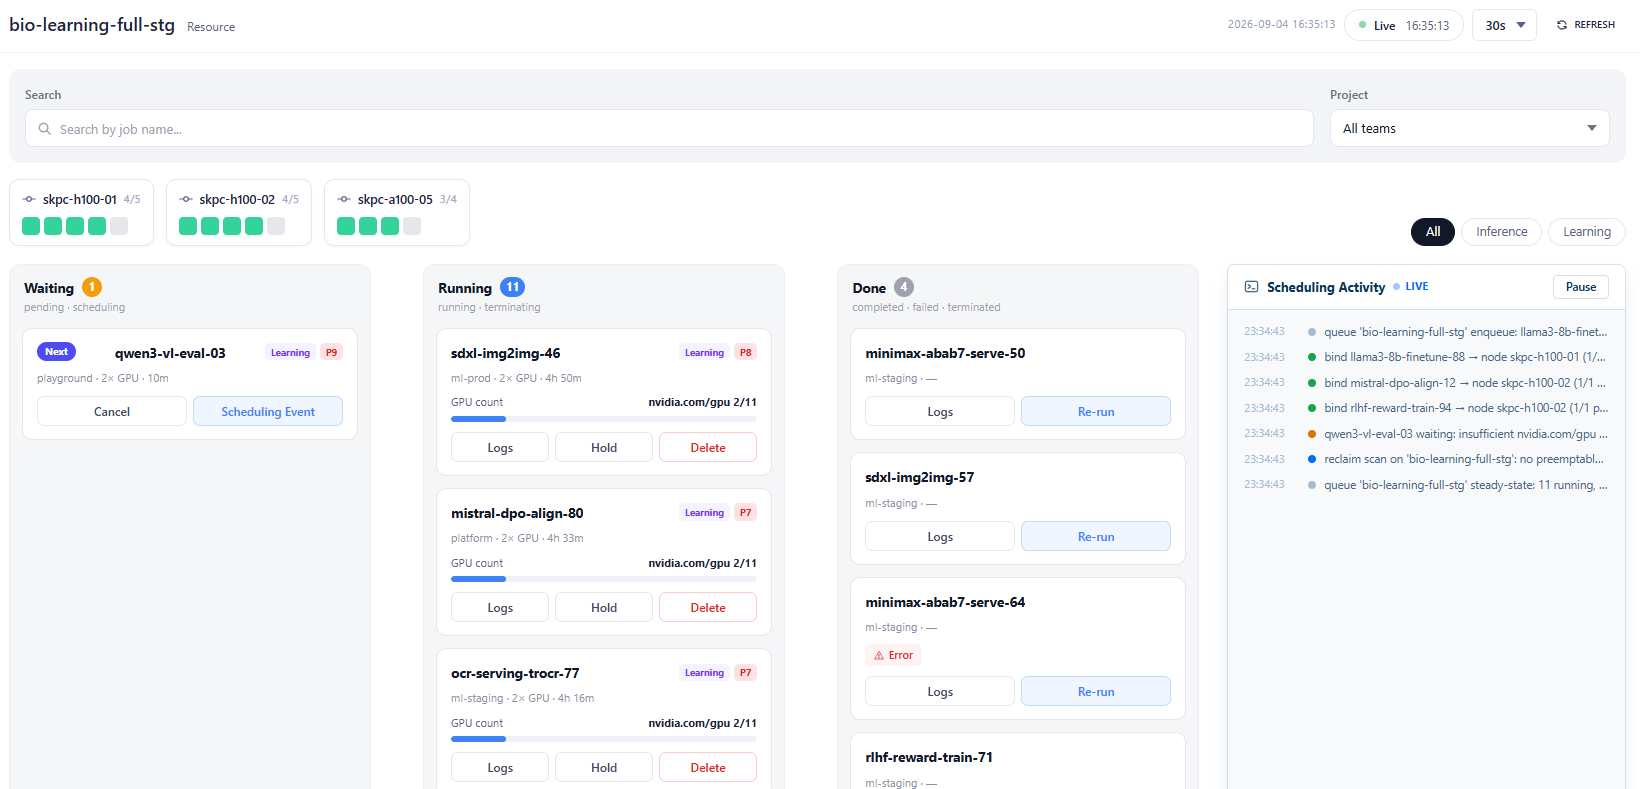
Reached by clicking Detail → on a GPU Pool View card, or Priority / Reclaim / a card in the Workload Alert panel.
7.1 Header
Same pattern as the GPU Overview header: breadcrumb showing the pool name + "Resource", a Live indicator with timestamp, a polling-interval selector (5/10/15/30/60s), and a REFRESH button.
7.2 Filters and node strip
| Field | Description |
|---|---|
| Search | Search workloads by job name. |
| Project | Project selection dropdown. Defaults to All teams. |
| Node Capacity Chips | one chip per node in the pool, each with a mini strip of colored cells summarizing that node's GPU occupancy at a glance |
| All / Inference / Learning | filters the board below to workloads of that category. |
7.3 Kanban board
Three columns, resizable by dragging the column border:
| Column | Sub-states | Description |
|---|---|---|
| Waiting | pending · scheduling | Workloads queued and not yet scheduled. Each card shows a queue-position badge (Next / #2…), workload name, type tag, priority tag (P1…), namespace · GPU count · age, and a status reasonActions: Cancel, Scheduling Event |
| Running | running · terminating | Workloads actively using GPUs. Each card shows workload name, type/priority tags, namespace · GPU count · age, and a GPU allocation progress bar. Actions: Logs, Hold, Delete |
| Done | completed · failed · terminated | Finished workloads, each with Logs and Re-run actions. |