Scheduling
The GPU Scheduling page is the main operational dashboard for system administrators to monitor and manage active GPU workloads across the computing infrastructure in real time. It provides a live view of GPU allocation, utilization, queue pressure, and per-GPU telemetry through KPI cards, a topology heatmap, and an alert panel. The page complements GPU Pools Management by focusing on scheduling decisions and workload health rather than inventory.
Accessing the GPU Scheduling Page
Quick steps to open GPU Scheduling:
- Click GPU on the top bar.
- In the left navigation, expand Workload Management.
- Click Scheduling.
Page Header

| Element | Description |
|---|---|
| Breadcrumb | Workload / Tracking — current location in the navigation hierarchy. |
| Live indicator | Green dot + "Live" label when auto-polling is active; switches to "Paused" when polling is suspended. |
| Last updated | Timestamp of the most recent successful data fetch |
| Polling interval selector | Dropdown to choose the auto-refresh cadence: 5 s / 10 s / 15 s / 30 s / 60 s. Adjust to balance freshness with server load. |
| REFRESH button | Manually triggers an immediate silent refresh of all sections without reloading the page. |
1. Scope Filters
Located directly below the page header. Filters narrow data shown in the KPI cards, GPU Topology, and Workload Alert panel simultaneously.
!img/llm_ops/gpu-management/user-guide/3c7b7135-d33b-80cb-93df-f52c94908305.png
| Filter | Description |
|---|---|
| Cluster | Dropdown to select a specific cluster or view all clusters aggregated ("All"). Defaults to All on page load. |
| Project | Dropdown to limit the view to GPU pools assigned to a specific project. Select "All" to see all pools across projects. Locked to the current project in project-scoped views. |
2. KPI Cards
Metric cards displayed in a horizontal row, sourced from the backend /advanced/overview/kpis endpoint. Each card shows a headline figure, supporting caption, and an optional action link. Click the ? icon on a card to open a popup with the full definition, calculation method, and data source.
2.1 GPU Allocated

- Purpose: Show what percentage of total GPU capacity is occupied by at least one workload pod, regardless of whether the GPU is actually computing.
-
Displayed information:
- Value: Percentage of allocated GPU units (Full GPU / MIG slices / Time-Slicing vGPU).
- Caption: Count of occupied GPU units out of total GPU units.
- Calculation: (GPU units with ≥ 1 pod occupant) ÷ (total GPU units) × 100.
- Action: Click the value to navigate to GPU Inventory filtered to unallocated (free) GPUs — showing remaining capacity available for new workloads.
- Click the value number → navigates to GPU Inventory filtered to unallocated (free) GPUs.
- Click the action link / ticker at the bottom of the card → opens the Idle Resource Loss — Details modal.
- Interpretation: A high Allocated value combined with a low Utilization value indicates GPUs that are reserved but not computing — the most cost-effective reclamation targets.
- Click the ? icon: open a popup with the full definition, calculation method, and data source.
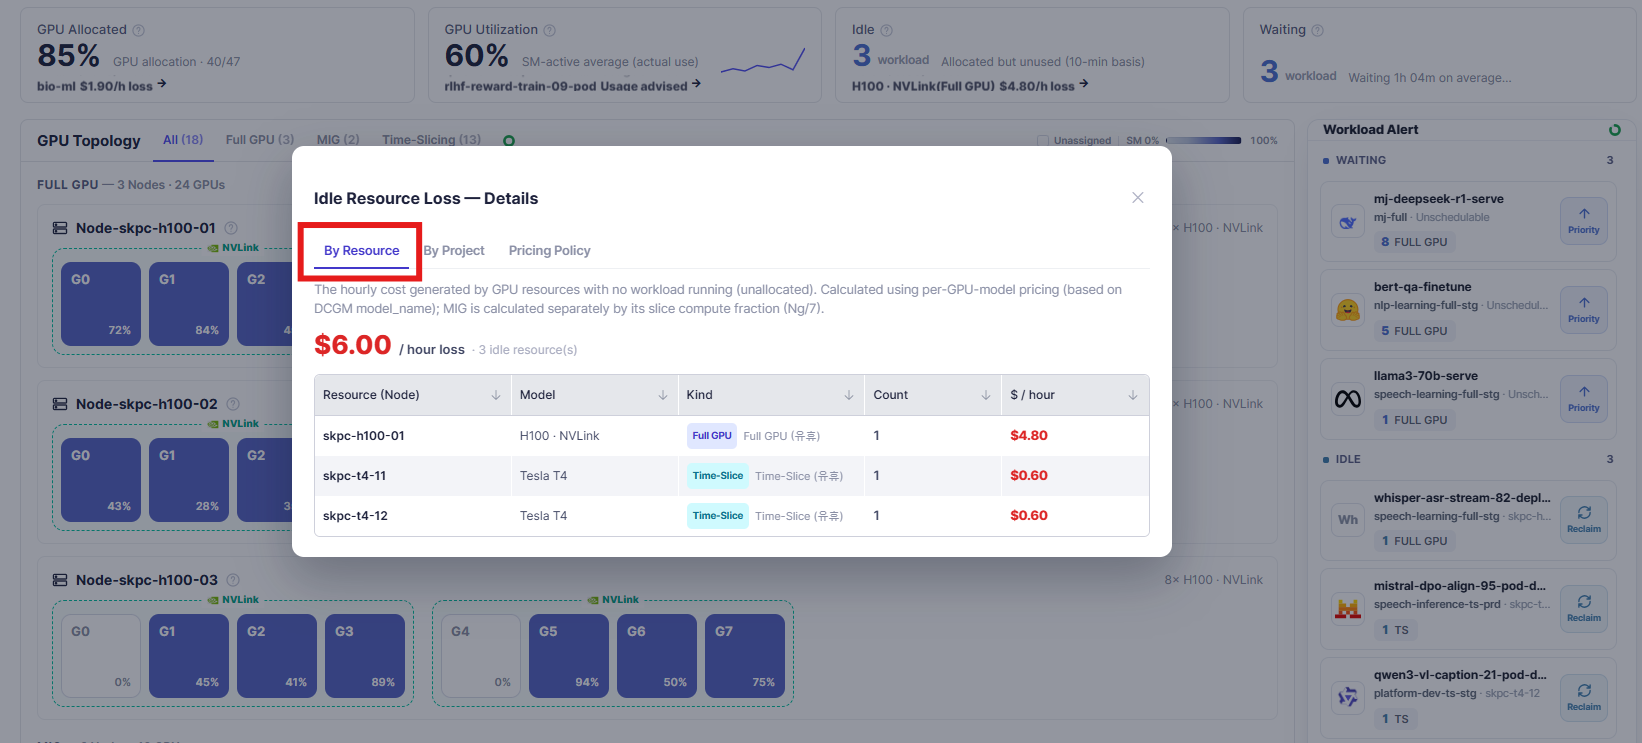
| Column | Description |
|---|---|
| Resource (Node) | Host node name of the idle GPU. |
| Model | GPU hardware model (e.g. H100 · NVLink, Tesla T4). |
| Kind | Sharing mode — Full GPU or Time-Slice. |
| Count | Number of idle GPU units on that node. |
| $ / hour | Estimated cost per hour for those idle units. |
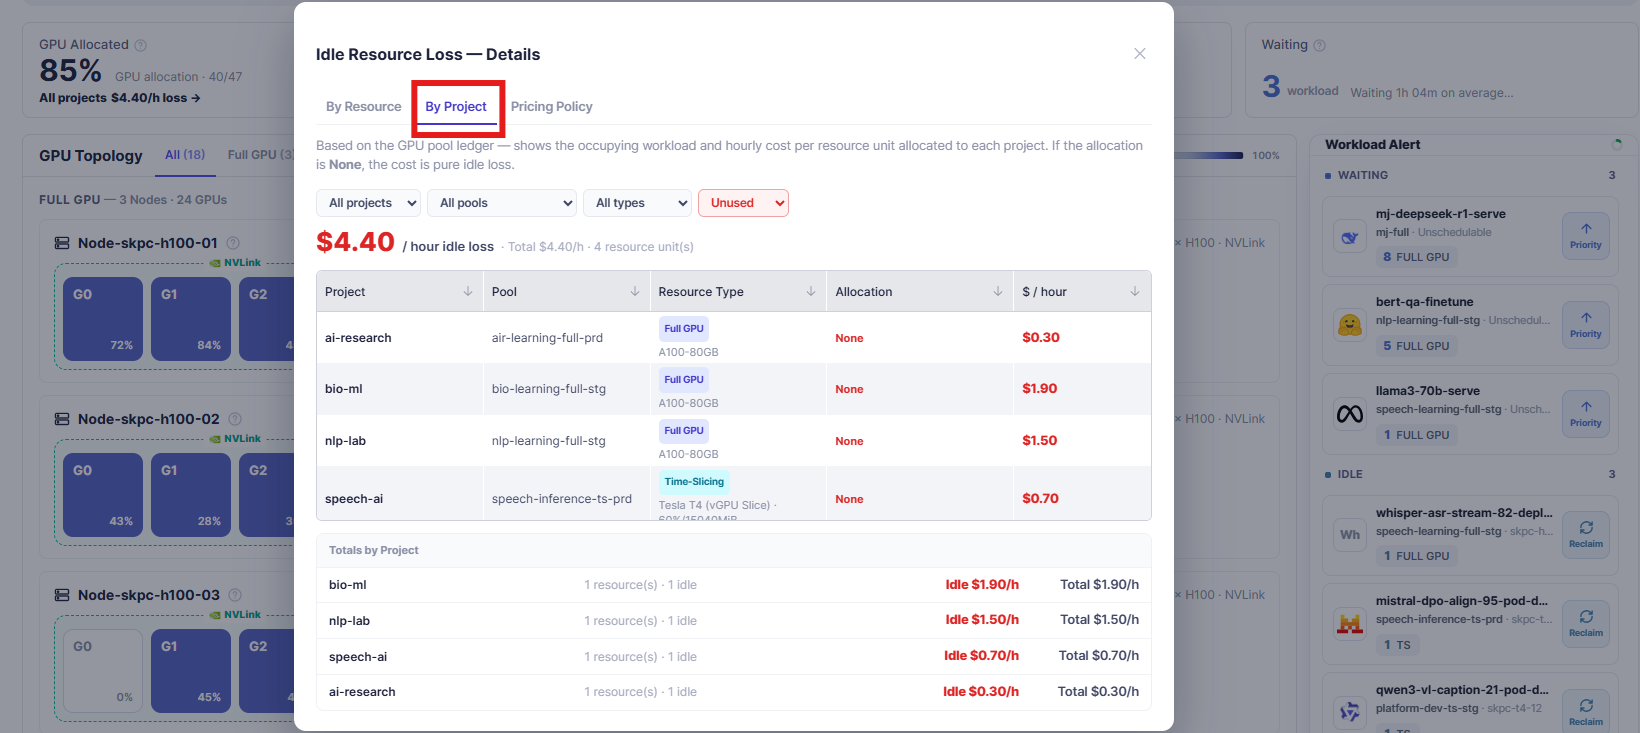
Based on the GPU pool ledger — shows the occupying workload and hourly cost per resource unit allocated to each project. Rows where Allocation is None indicate resources with no running workload, representing pure idle loss.
Headline: total idle loss per hour + total cost/h + resource unit count (e.g. $4.40 / hour idle loss · Total $4.40/h · 4 resource unit(s)).
Filters:| Filter | Options | Purpose |
|---|---|---|
| Project | All projects / individual project names | Limit table to resources belonging to a specific project. |
| Pool | All pools / individual pool names | Limit table to resources within a specific GPU pool. |
| Resource Type | All types / Full GPU / MIG / Time-Slicing | Filter by GPU sharing mode. |
| Status | Unused / All / Allocated | • All shows every resource unit in the ledger • Allocated shows only units with an active workload running • Unused (default) shows only idle units with no workload — the pure idle loss rows. |
| Column | Description |
|---|---|
| Project | Project name that owns the GPU pool containing this resource. |
| Pool | GPU pool name the resource belongs to. |
| Resource Type | GPU sharing mode badge (Full GPU / MIG / Time-Slicing) plus the hardware spec and, for Time-Slicing, the vGPU slice configuration (e.g. Tesla T4 (vGPU Slice) · 60%/15040MiB). |
| Allocation | Running workload name occupying this resource unit. Displays None when no workload is scheduled — these rows are the idle loss source. |
| $ / hour | Hourly cost for this resource unit at the current pricing rate. Displayed in red to indicate financial impact. |
Totals by Project (summary section at the bottom of the table):
| Column | Description |
|---|---|
| Project | Project name. |
| Resource summary | Number of resource units and idle count (e.g. 1 resource(s) · 1 idle). |
| Idle $ / h | Portion of hourly cost attributed to idle resources for this project (red). |
| Total $ / h | Total hourly cost for all resources owned by this project. |
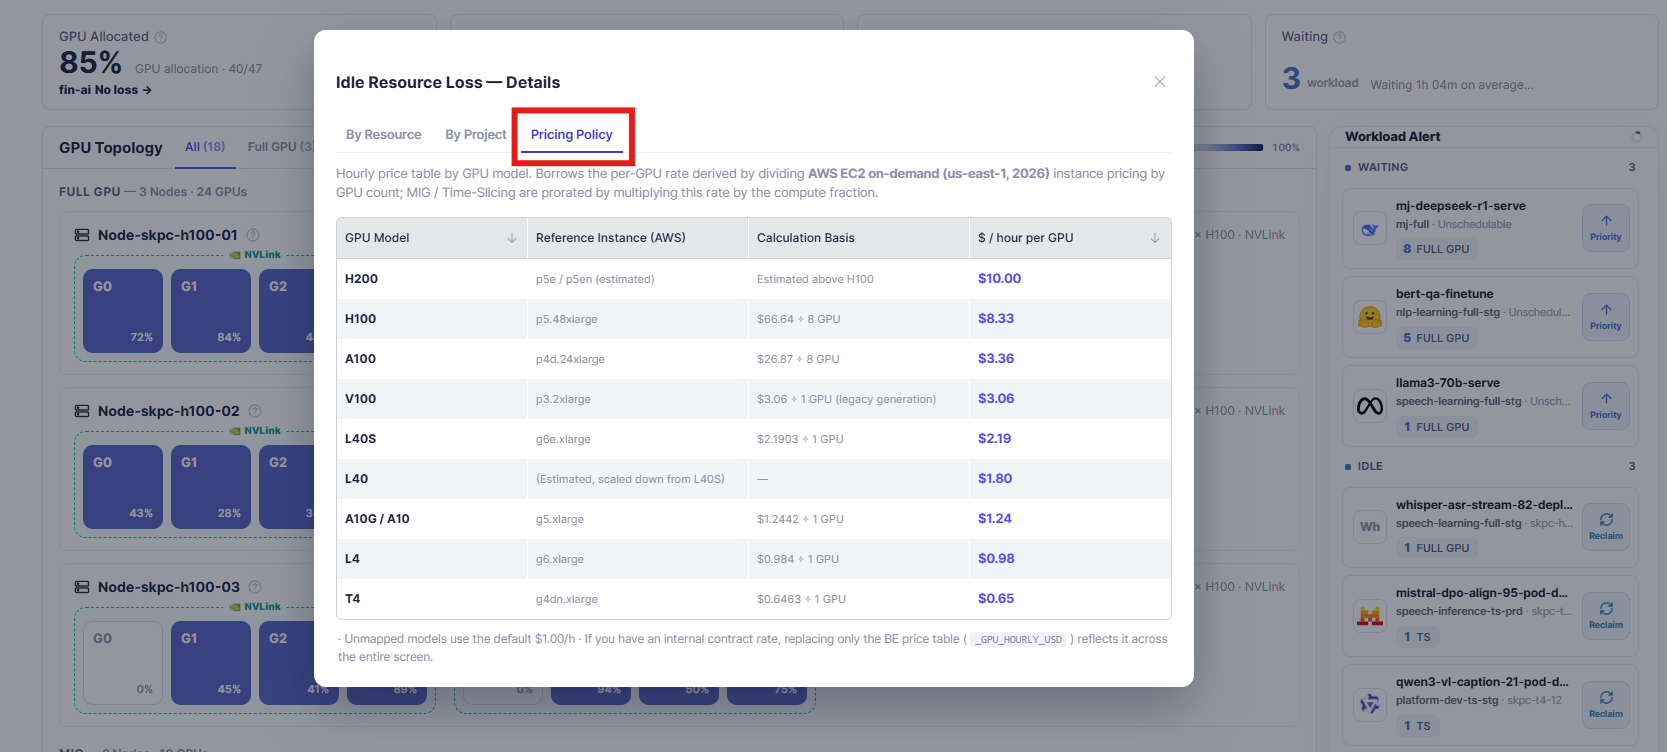
Reference table of per-GPU hourly rates used for cost calculation. Rates are derived by dividing AWS EC2 on-demand instance prices (us-east-1) by GPU count per instance. MIG and Time-Slicing costs are prorated by multiplying the full-GPU rate by the slice compute fraction.
| Column | Description |
|---|---|
| GPU Model | Hardware model name. |
| Reference Instance (AWS) | AWS instance type used as the pricing baseline. |
| Calculation Basis | Instance price ÷ GPU count formula. |
| $ / hour per GPU | Resulting per-GPU hourly rate used across the dashboard. |
Unmapped GPU models fall back to a default rate of $1.00/h. To use internal contract rates, update the backend price table (_GPU_HOURLY_USD); the change is reflected across all cost displays.
2.2 GPU Utilization
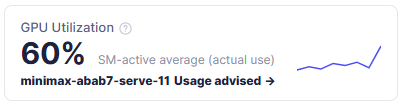
- Purpose: Show the average SM-active percentage across all physical GPUs — "are the GPUs actually computing?"
-
Displayed information:
- Value: Average SM-active utilization percentage.
- Caption: Contextual throughput or workload count.
- Sparkline: Recent trend line for quick visual trending.
- Calculation: Σ(SM-active % per GPU) ÷ total GPU count. SM-active measures real kernel execution, filtering out spin-wait overhead that plain GPU util includes. This is a current snapshot, not a 7-day average.
- Data source: DCGM sm_active_pct; falls back to gr_engine_active_pct → util_pct for nodes where SM-active is unavailable.
-
Actions:
- Click the value number → navigates to GPU Inventory filtered to idle-occupied GPUs.
- Click the ticker / action link at the bottom of the card → opens the GPU Utilization Review & Reclaim modal.
- Interpretation: Low utilization with high allocation signals workloads holding GPUs without running kernels. These are the highest-priority candidates for reclaim or optimization.
- Click the ? icon: open a popup with the full definition, calculation method, and data source.
Queries GPU utilization (SM util / vGPU, 1-minute interval) for the last 10 minutes across all running workloads to identify unused ones. A workload with no utilization for 10 consecutive minutes is flagged as a reclaim candidate.
Counter (top right): current filtered row count / total row count (e.g. 60 / 60).
Filters:| Filter | Options | Purpose |
|---|---|---|
| Project | All projects / individual project names | Limit results to a specific project. |
| GPU Pool | All pools / individual pool names | Limit results to workloads in a specific GPU pool. |
| Results | All results / In use / Unused / Unknown | • In use = workload has active utilization • Unused = zero utilization for the window • Unknown = no telemetry data available. |
| Column | Description |
|---|---|
| Project | Project that owns the GPU pool containing this workload. Displays "—" if unassigned. |
| GPU Pool | Name of the GPU pool the workload is running in. |
| Workload | Workload name. |
| Utilization Trend (10m) | Mini-chart showing GPU utilization over the past 10 minutes at 1-minute intervals. Displays "No data / max 0.0%" when telemetry is unavailable for the workload. |
| Avg. Utilization | Average GPU utilization over the 10-minute window. Sortable. Displays "—" when no telemetry data is available. |
| Result | Utilization classification: In use = active utilization detected; Unused = zero utilization over the 10-minute window; Unknown = no telemetry data available. |
| Action | ⋮ context menu with 3 options: • YAML — view the workload's raw YAML definition • Detail — navigate to the workload detail page • Delete — delete the workload. |
2.3 Waiting

- Purpose: Show the number of workloads stuck in the queue (Pending / Inqueue state) and their average wait time.
-
Displayed information:
- Value: Count of waiting workloads (highlighted in blue when > 0).
- Sub-label: "workload" unit.
- Calculation: Count of all Volcano PodGroups in Pending or Inqueue phase. Average wait = Σ(now − creationTimestamp) ÷ waiting count.
- Action: Click to view the waiting workload list in the Workload Alert panel.
- Interpretation: If available GPUs remain while the queue grows, the cause is usually quota, priority, or fragmentation — not capacity. True capacity shortage requires the available GPU count to be 0 while the queue is non-empty.
- Click the ? icon: open a popup with the full definition, calculation method, and data source.
2.4 Idle

- Purpose: Surface workloads that hold allocated GPUs but have shown no meaningful compute activity for the past 10 minutes.
-
Displayed information:
- Value: Count of idle workloads (highlighted in blue when > 0).
- Sub-label: "workload" unit.
- Ticker: Rotates through workload names and their estimated cost per hour loss.
- Actions: Click the ticker at the bottom of the card → opens the Idle-Occupied GPU — History modal.
- Click the ? icon: open a popup with the full definition, calculation method, and data source.
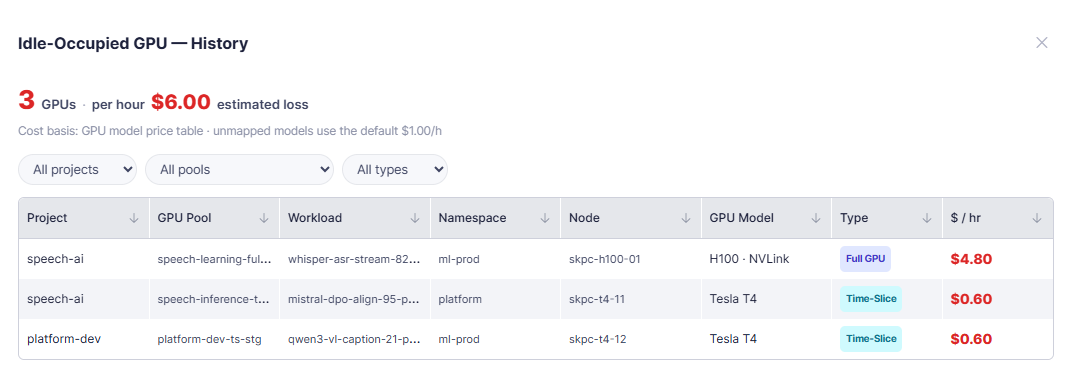
Lists GPU units that are allocated to a workload but have shown no utilization activity — meaning the workload holds the GPU without running any compute.
Headline: total idle GPU count + estimated hourly loss (e.g. 3 GPUs · per hour $6.00 estimated loss).
Sub-text: "Cost basis: GPU model price table · unmapped models use the default $1.00/h"
Filters:| Filter | Options | Purpose |
|---|---|---|
| Project | All projects / individual project names | Limit results to a specific project. |
| GPU Pool | All pools / individual pool names | Limit results to a specific GPU pool. |
| Type | All types / Full GPU / Time-Slice / MIG | Filter by GPU sharing mode. |
Table columns (all sortable):
| Column | Description |
|---|---|
| Project | Project that owns the GPU pool |
| GPU Pool | GPU pool the workload is running in |
| Workload | Workload name holding the idle GPU. |
| Namespace | Kubernetes namespace the workload belongs to. |
| Node | Host node name |
| GPU Model | GPU hardware model (e.g. H100 · NVLink, Tesla T4). |
| Type | GPU sharing mode badge — Full GPU or Time-Slice. |
| $ / hr | Estimated hourly cost for the idle GPU unit. Displayed in red. |
3. GPU Topology
A full-width heatmap showing every physical GPU node in the selected scope, grouped by GPU mode.
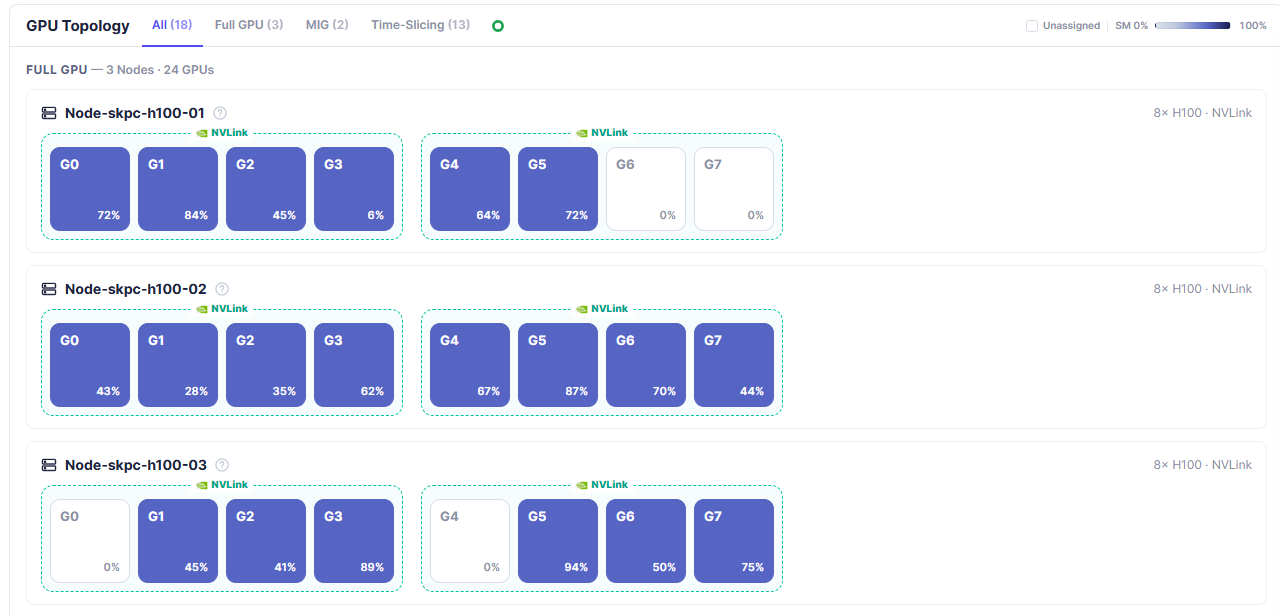
3.1 Section Header Controls
| Control | Description |
|---|---|
| Title | Displays "GPU Topology" |
| Countdown ring | Animated ring that completes one revolution per polling interval; the card briefly flashes when data refreshes. |
| Mode tabs (Full / MIG / Time-Slicing) | Filter the node list to show only nodes running the selected GPU sharing mode. Count shown in parentheses per tab. |
| SM color legend | Color scale strip (0% → 100%) mapping cell fill color to SM utilization. |
3.2 GPU Node Cards
Each card represents one physical server node in the cluster.
- Node name: Displayed as
Node-hostname. - NVLink badge: Shown on nodes where GPUs are connected via NVLink fabric; cells within the same NVLink domain are visually grouped.
- Hardware spec: GPU model and memory (e.g. A100 80 GB).
Each colored cell represents one physical GPU on the node.
| Cell element | Description |
|---|---|
| Cell label | GPU index (e.g. G0, G1…). |
| Cell color | Fills from light (low SM utilization) to dark blue/purple (high SM utilization). Gray = unallocated. |
| Bottom-right value | SM utilization percentage or pool name abbreviation. |
Hover popover — hover over any cell to see real-time telemetry:
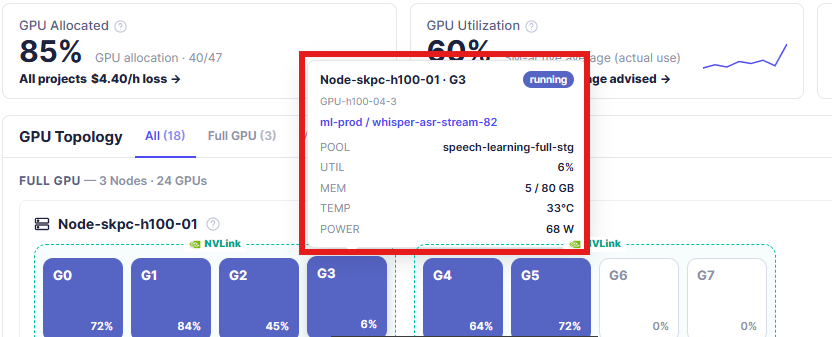
| Field | Description |
|---|---|
| POOL | Assigned GPU Pool name. |
| UTIL | Current GPU utilization %. |
| MEM | GPU memory used / total. |
| TEMP | GPU temperature (°C). |
| POWER | Power draw (W). |
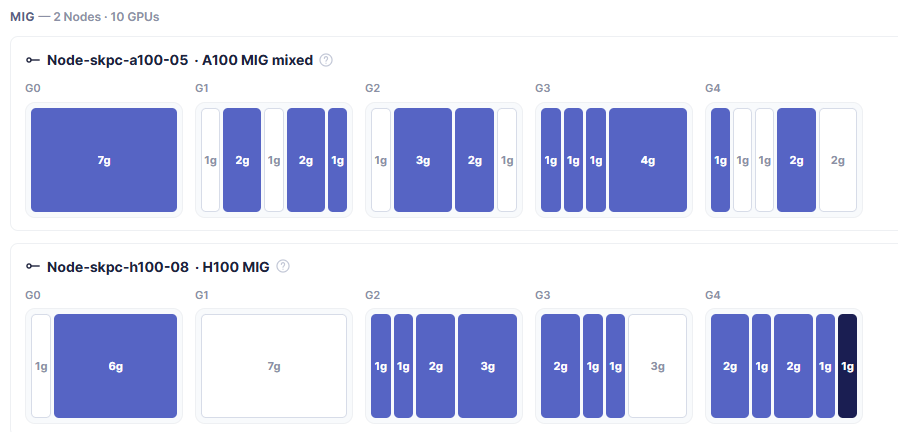
Node header shows node name, GPU model, and MIG configuration type (e.g. Node-skpc-a100-05 · A100 MIG mixed). Section label shows total node count and GPU count (e.g. MIG — 2 Nodes · 10 GPUs).
Each physical GPU on the node (labeled G0, G1, G2…) is displayed as a group of MIG slice cells. Cell width is proportional to the slice's compute fraction. Cells are colored blue when occupied by a workload; white/light when free.
Cell label: Compute fraction shorthand (e.g. 1g, 2g, 3g, 4g, 6g, 7g).
Hover popup — hover over any MIG slice cell to see:
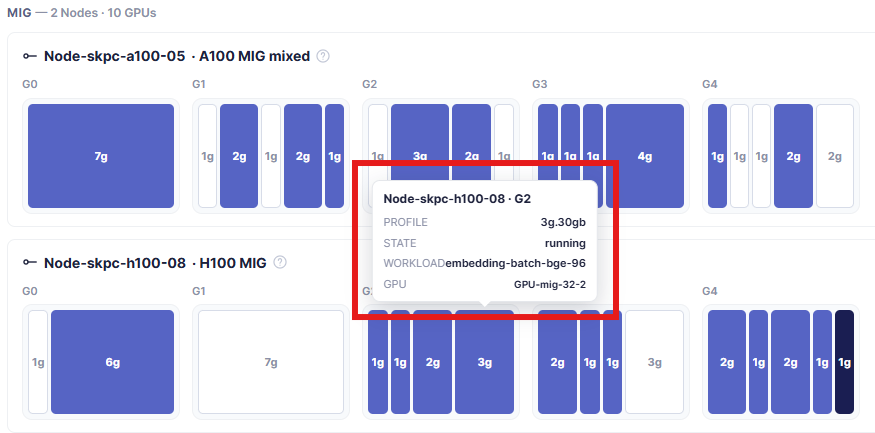
| Field | Description |
|---|---|
| PROFILE | Full MIG slice profile name (e.g. 2g.20gb, 1g.10gb). |
| STATE | Current state of the slice — running when occupied by a workload. |
| WORKLOAD | Name of the workload currently running on this slice |
| GPU | MIG GPU instance identifier |
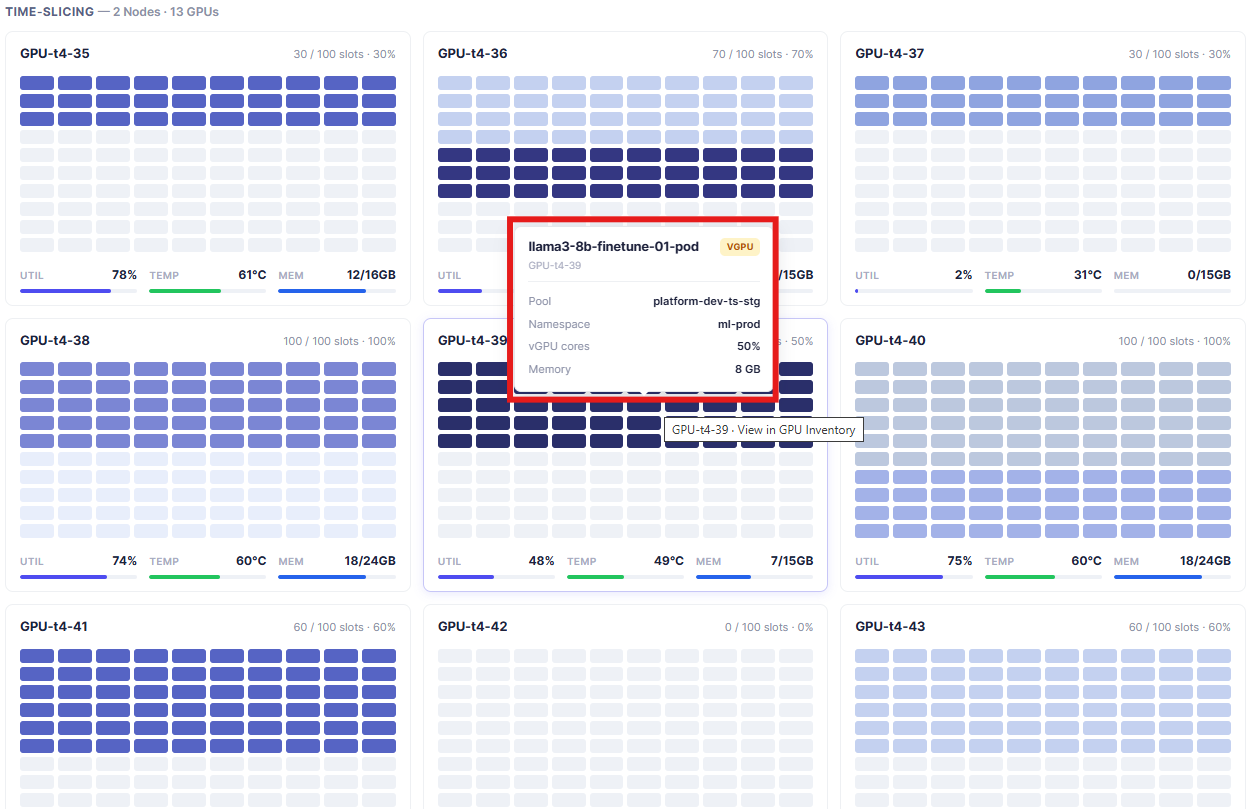
Card header: GPU name (e.g. GPU-t4-35) + slot usage summary on the right (e.g. 30 / 100 slots · 30%).
Cell grid: Each small cell represents one vGPU time-slice slot. Dark blue = slot occupied by a workload; light blue/grey = slot free.
Card footer: Physical GPU metrics displayed as three values with progress bars:
| Field | Description |
|---|---|
| UTIL | Overall GPU utilization % aggregated across all active vGPU slots. |
| TEMP | GPU temperature in °C. |
| MEM | GPU memory used / total (e.g. 12/16GB). |
Hover popup — hover over any occupied slot cell to see the workload details:
| Field | Description |
|---|---|
| Workload name | Name of the workload occupying the slot, with a vGPU badge indicating it is a virtual GPU context. |
| GPU | Physical GPU identifier the slot belongs to (e.g. GPU-t4-39). |
| Pool | GPU pool the workload is assigned to. |
| Namespace | Kubernetes namespace of the workload. |
| vGPU cores | Compute share allocated to this vGPU slot (e.g. 50%). |
| Memory | Memory allocated to this vGPU slot (e.g. 8 GB). |
4. Workload Alert Panel
A fixed-width panel on the right side of the page, updated in real time alongside the topology heatmap.
Panel Header
- Title: "Workload Alert"
- Countdown ring: Synchronized with the topology ring — animates each polling cycle.
- Empty state: "✓ No alerts — All GPU resources are in use." when no anomalies are detected.
4.1 Waiting Workloads
. |
| Priority button | Navigates to the GPU Pool Detail page for the workload's pool, where scheduling priority can be managed. |
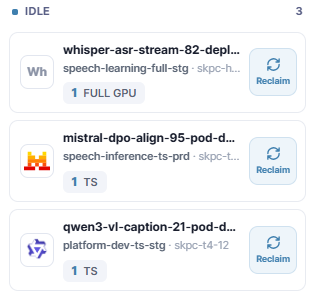
Workloads that hold allocated GPUs but have shown no meaningful compute activity for the past 10 minutes.
| Card element | Description |
|---|---|
| Logo / Monogram | Same as Waiting cards. |
| Name | Workload name |
| Pool / Node | Assigned GPU Pool and host node name (e.g. speech-learning-full-stg · skpc-h...). |
| Resource chip | GPU count and sharing mode (e.g. 1 FULL GPU, 1 TS). |
| Reclaim button | Navigates to the GPU Pool Detail page for the workload's pool, where reclaim actions can be performed. |
4.3 Running Workloads
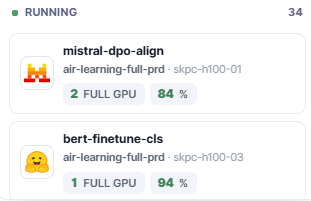
Workloads actively executing on GPUs. Displayed below the Idle section with a green dot indicator and total count.
| Card element | Description |
|---|---|
| Logo / Monogram | Same as Waiting and Idle cards. |
| Name | Workload name. Click the card to navigate to the GPU Pool Detail page. |
| Pool / Node | Assigned GPU Pool and host node name. |
| Resource chip | GPU count, sharing mode, and current utilization percentage (e.g. 2 FULL GPU 84%). |
4.4. GPU Pool Detail
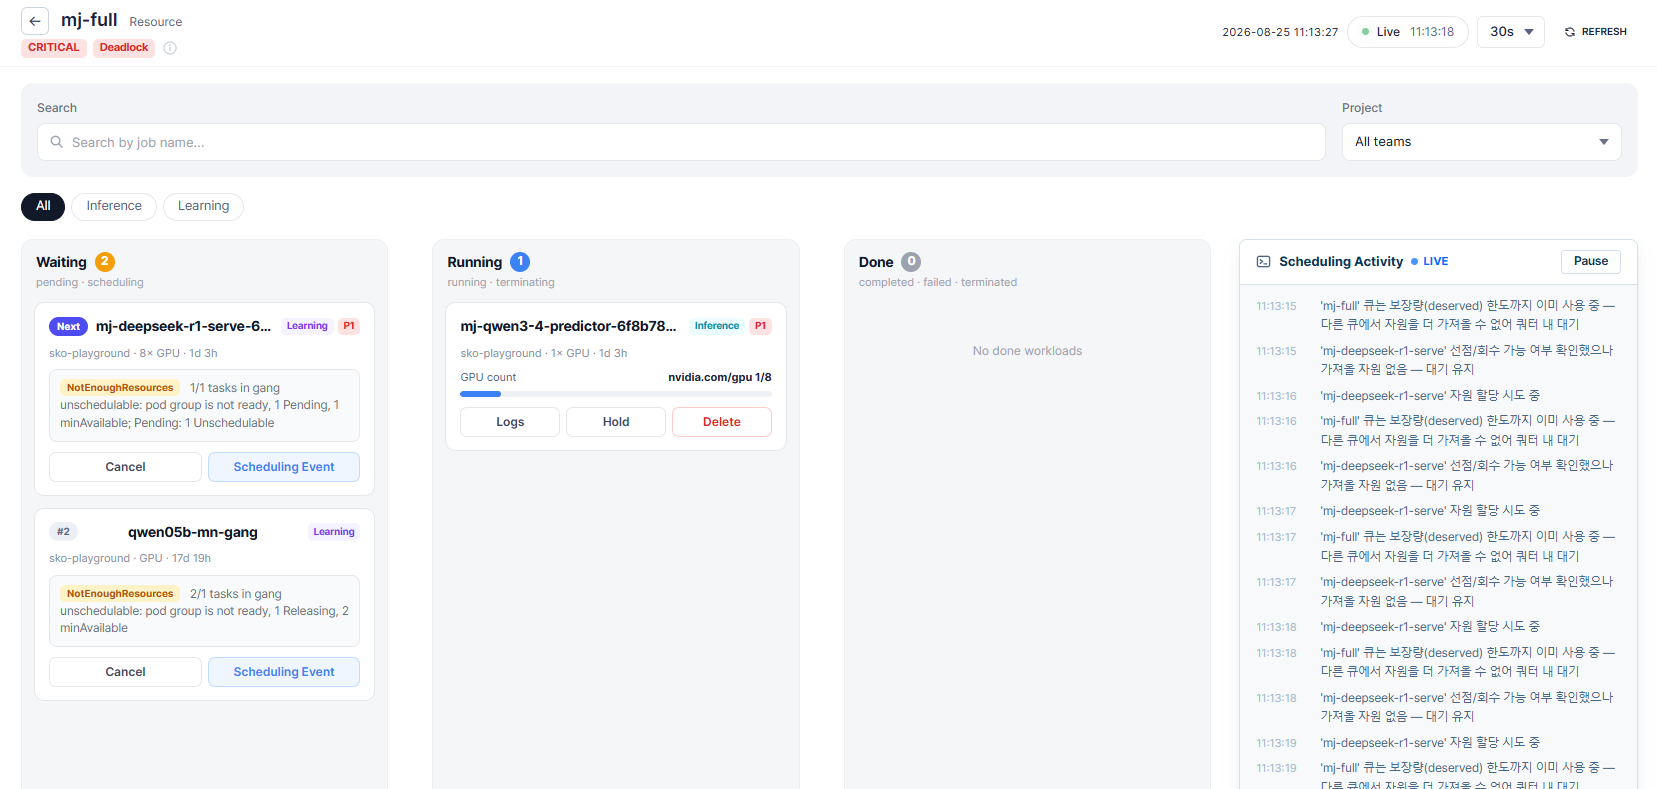
| Column | Sub-states | Description |
|---|---|---|
| Waiting | pending · scheduling | Workloads queued and not yet scheduled. Each card shows: queue position badge (Next / #2 …), workload name, type tag, priority tag (P1…), namespace · GPU count · age, and a status reason box (e.g. NotEnoughResources with the scheduler's unschedulable message). Actions: Cancel and Scheduling Event. |
| Running | running · terminating | Workloads actively using GPUs. Each card shows: workload name, type tag, priority tag, namespace · GPU count · age, GPU allocation progress bar. Actions: Logs, Hold, Delete. |
| Done | completed · failed · terminated | Completed or terminated workloads. Shows "No done workloads" when empty. |