GPU Monitoring (Project Level)
GPUモニタリング画面では、ユーザーがプロジェクトに割り当てられたGPUプールの状態と使用状況を監視できます。
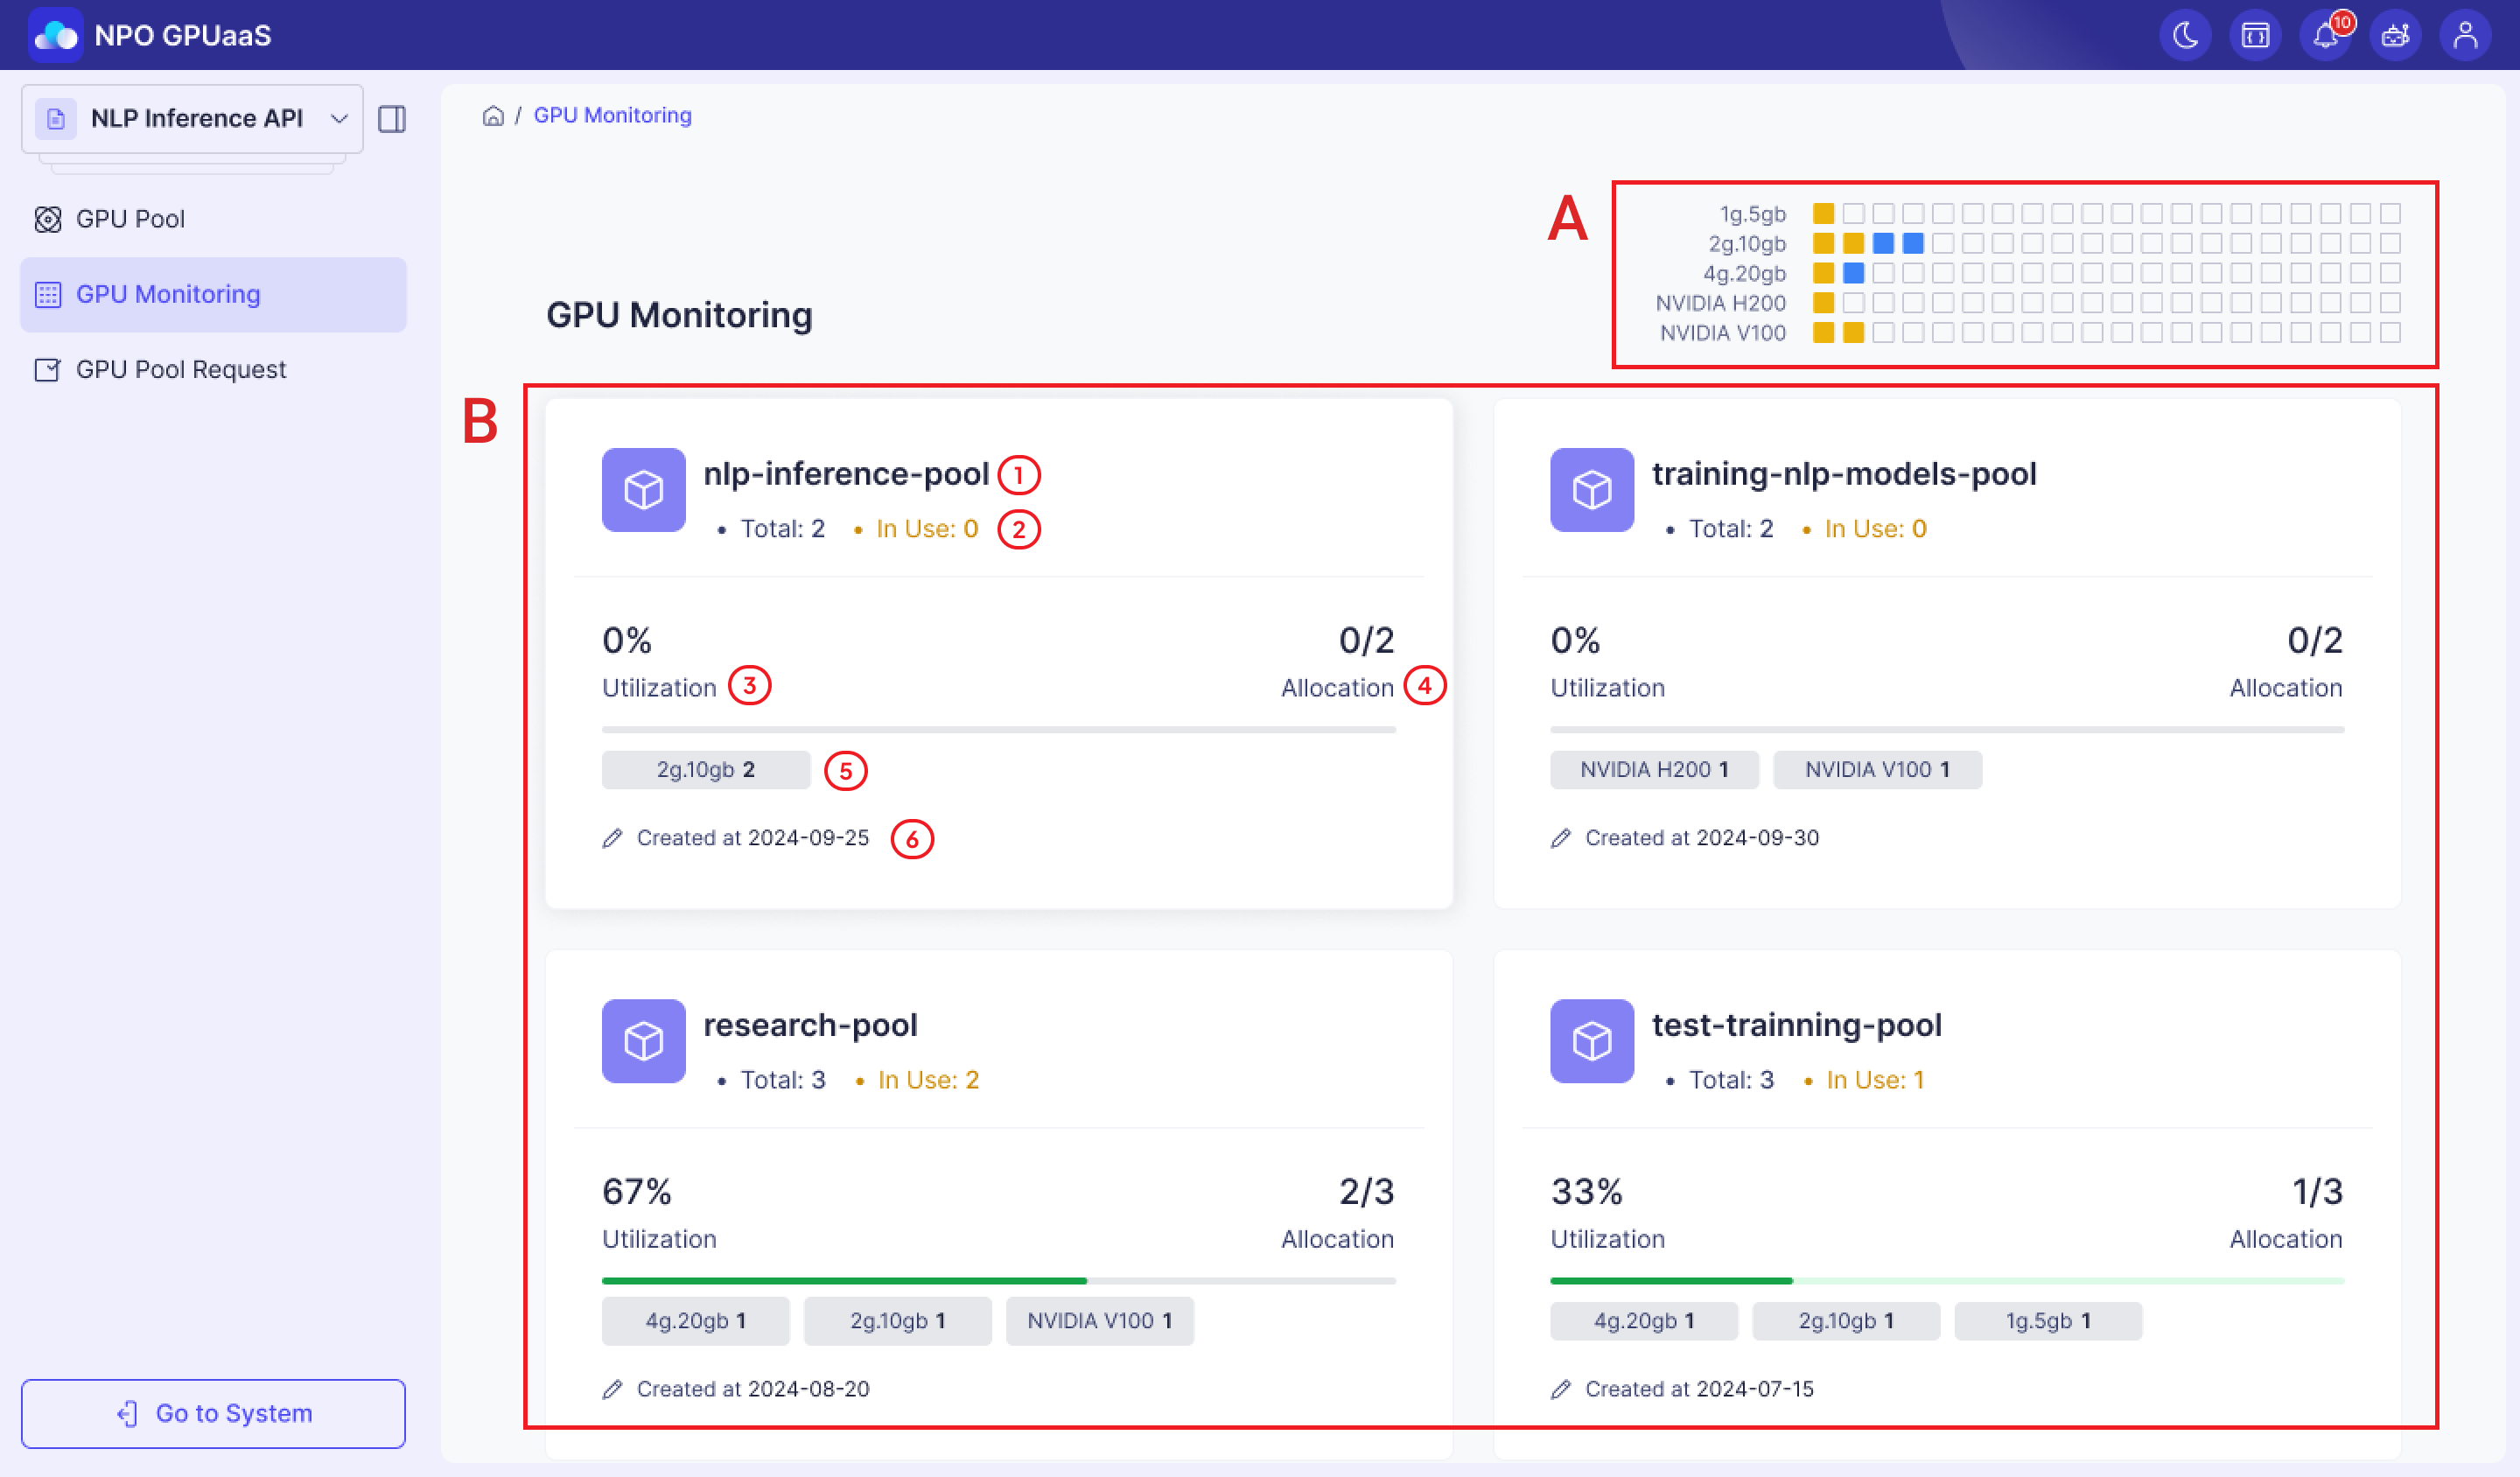
セクションA: プロファイル分布
セクションB: GPUプールカード
プロファイル分布
- 目的: プロジェクトに割り当てられたすべてのGPUプールにおけるプロファイルの総数を、プロファイルタイプとステータス別に表示します。
- 色はプロファイルのステータスを示します。
GPUプールカード
各カードは1つのGPUプールに対応し、以下の情報を表示します。
- タイトル: GPUプール名
- 使用状況:
- 合計: プールに割り当てられたGPUの総数
- 使用中: 使用中のGPUの数
- 利用率: 使用中のGPUの割合
- 割り当て: 割り当てられたリソースの数で、‘使用中のプロファイル数/プール内のプロファイルの総数’の形式で表示されます。
- プログレスバー: 緑は使用中のプロファイルを示し、灰色は利用可能なプロファイルを示します。
- タグ: プールに割り当てられたGPUプロファイルの仕様。
- 作成日: プールの作成日をYYYY-MM-DD形式で表示します。
ユーザーがGPUプールカードをクリックすると、システムは対応するGPUプールの詳細情報画面に移動します。この画面には、プールの構成と実際の使用状況を理解するための2つの主要なタブ(割り当てタブと監視タブ)が含まれています。
割り当てタブ: リソース構成の概要
割り当てタブでは、GPUプールが物理的にどのように構成されているかを示します。どのGPUが、どのプロファイルで、このプールに割り当てられているか、どのノードに、どのクラスターにあるかを視覚化します。
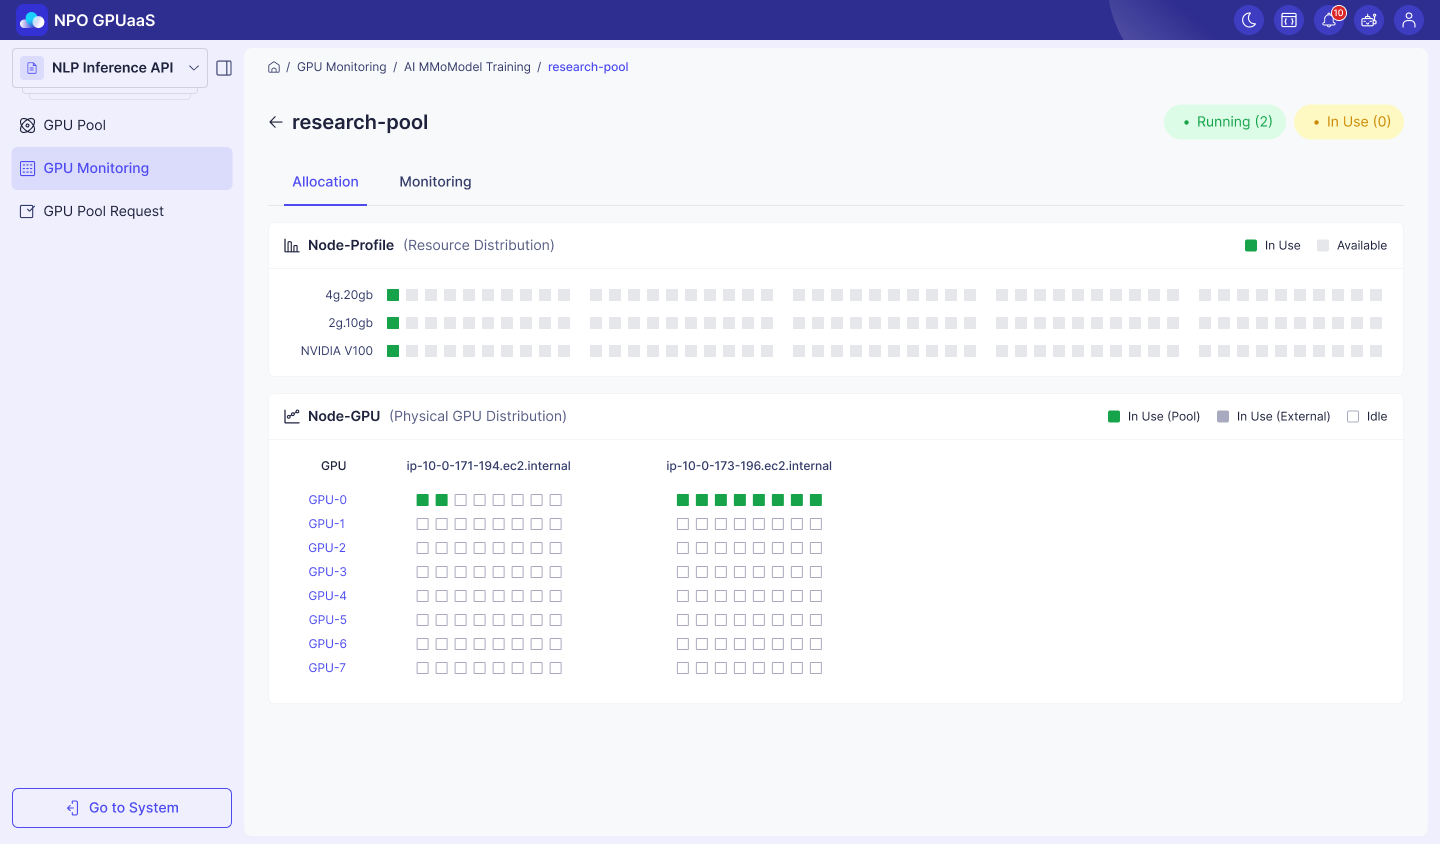
一般的なステータス:
- 使用中: ワークロードに割り当てられたプロファイルの数。
- Ready: ワークロードに割り当てられていないプロファイルの数。
Node-Profile (Resource Distribution)
- Purpose: 各プロファイル仕様に対して割り当てられたGPUと未割り当てのGPUの数を表示します。
- Status:
- In Use (green): 現在使用中のプロファイル
- Available (grey): 利用可能なプロファイル
Node-GPU (Physical GPU Distribution)
- Purpose: 各ノードにおけるGPUの配置を詳細に表示します。
- Status:
- In Use (Pool) (green): このプール内で現在使用中のプロファイル。
- In Use (External) (green): 別のプールで現在使用中のプロファイル。
- Idle (white): 利用可能なプロファイル
Monitoring Tab: Actual Usage
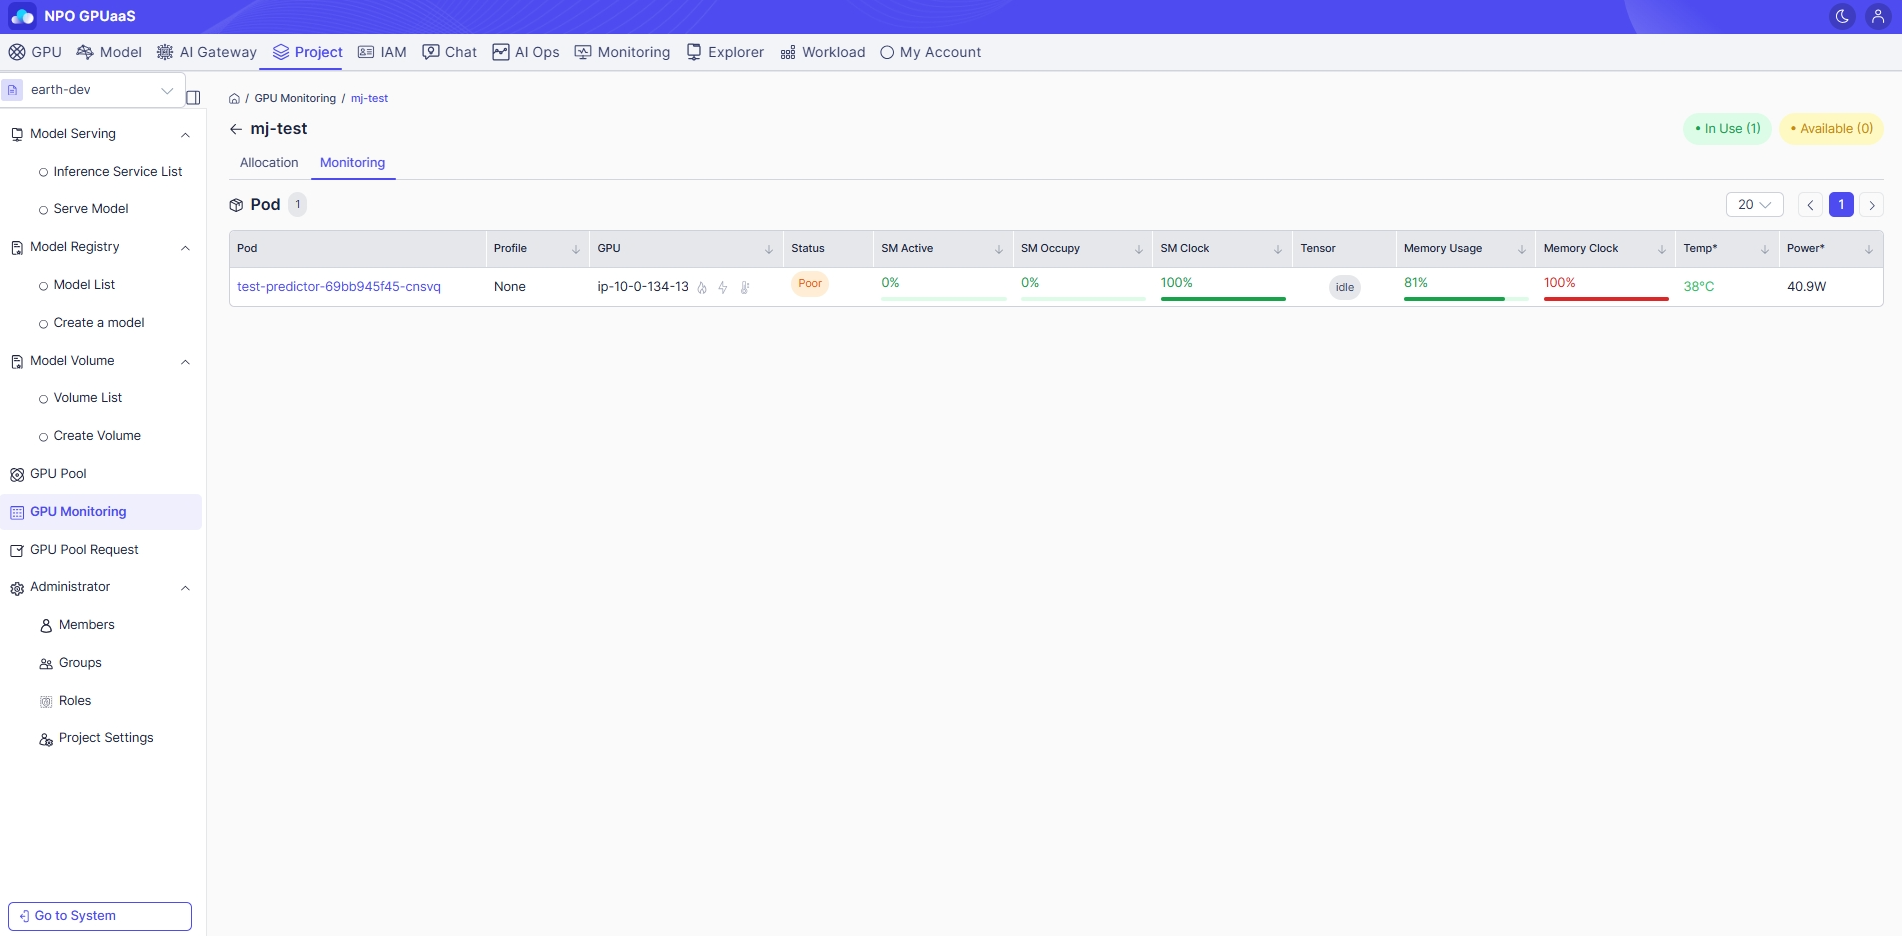
- Purpose: このプールで実際にGPUを使用しているPodsを表示します。これはGPUプール管理において最も重要なタブであり、Podレベルでのリソース使用状況を追跡することができます。
- Displayed Information:
- Pod: Pod名
- Profile: Podによって使用されているGPUプロファイル。
- GPU: Podによって使用されているGPUのUUID
- Fire icon: ハードウェアサーマルスロットリングが有効か無効かを示します。
- Lightning icon: GPUパワーリミット(消費電力制限)が有効か無効かを示します。
- Thermometer icon: ソフトウェアサーマルリミットの状態を示します。
- Status: プロファイルの状態
- SM Activity: GPU内の実際の計算ユニット(SM)のうち、アクティブなものの割合。
- SM Occupy: SM上のアクティブなワープの数と最大サポートされているワープの比率、CUDAカーネルがGPUリソースをどれだけ効率的に利用しているかを示します。
- SM Clock: SMの現在の速度と最大速度の比較。
- Tensor: テンソルコアが現在利用されているかどうかを示します。
- Memory Usage: 使用中のGPUメモリの割合/利用可能なメモリの合計
- Memory Clock: GPUコアとVRAM間でデータが転送される速度を決定します。
- Temperature: GPUの温度。
- Power: GPUの消費電力。