跳到主要内容

Cluster List

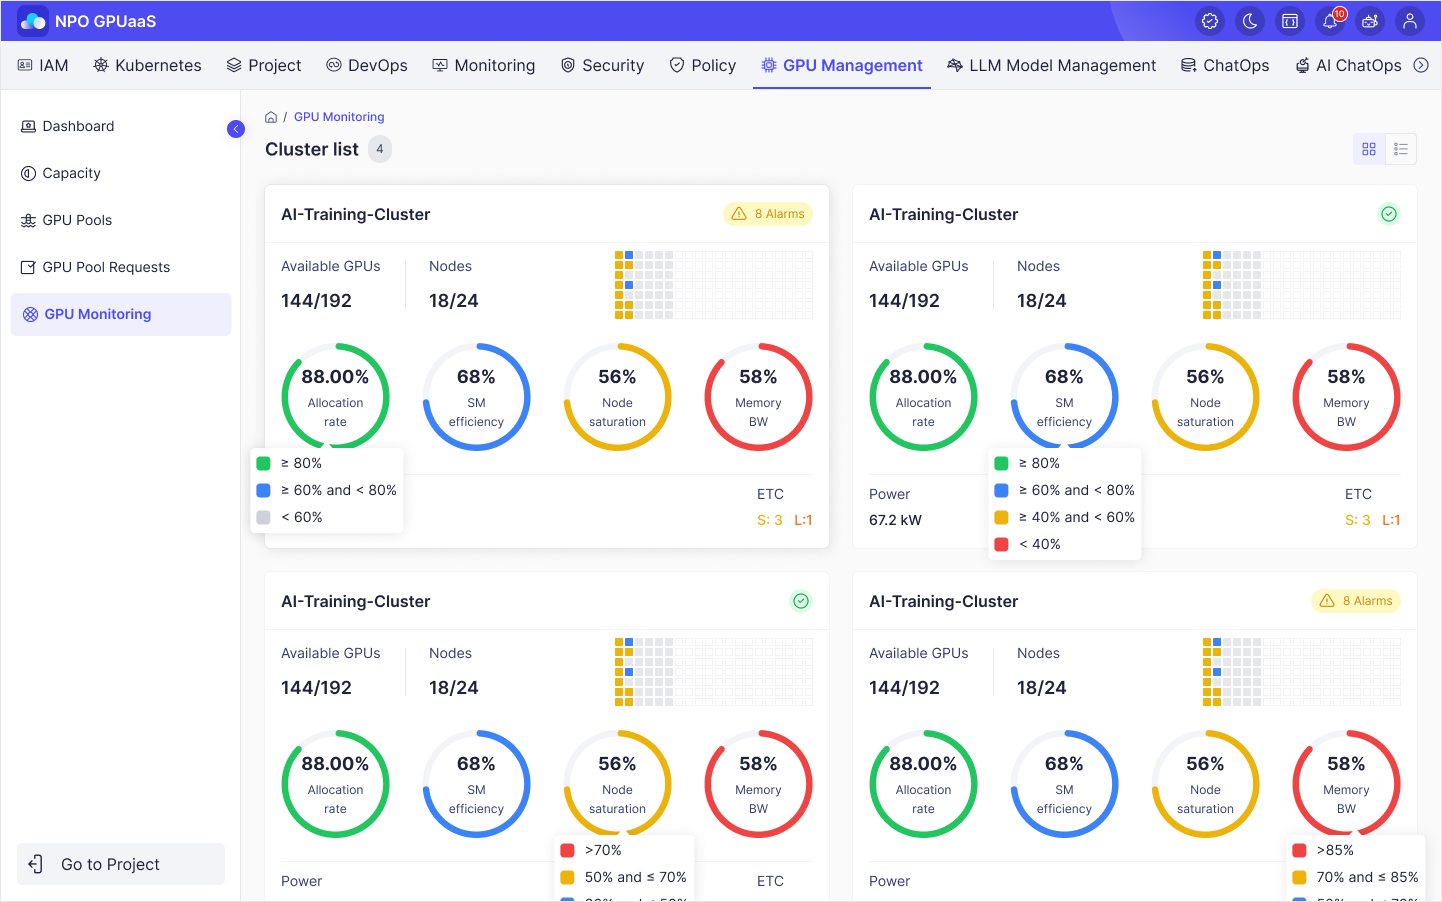
On Cluster List screen, the entire GPU infrastructure is displayed as multiple cluster cards. Each card represents an independent Kubernetes cluster, organized by purpose such as development, training, or production.

Clusters are arranged in a grid format. Each cluster is shown as a separate card, with distinct colors and icons that give an intuitive overview of its health status. Clusters with issues are highlighted in red or orange, making them easy to identify and address promptly.

Access GPU Monitoring Screen

From the System Admin Control Panel, click GPU in the main navigation. Then, in the left-side navigation, select GPU Monitoring.

Each cluster is represented as an individual card containing the following information:

ItemMeaning
Available GPUsTotal GPUs and Allocatable GPUs in the Cluster
NodesTotal number of GPU nodes and number of nodes available for GPU allocation
Status Mini MapDisplay the status of each GPU as a color minimap:
• Blue: Available
• Yellow: In use
• Red: Error
Allocation RateThe percentage of GPUs currently in use out of the total GPUs.
EfficiencyThe average efficiency based on GPU status.
Node saturationThe average total GPU resource usage per node.
Memory bandwidthThe average memory utilization rate of the GPUs in use.
PowerThe total power consumption of all GPUs.
ECCError counter occurred in GPU memory
S (Session)The number of double-bit errors that have occurred while the GPU is running.
L (Lifetime)The cumulative number of double-bit errors over the entire lifetime of the GPU.