Cluster List
Cluster List 画面では、全体のGPUインフラストラクチャが複数のクラスターカードとして表示されます。各カードは、開発、トレーニング、または本番などの目的に応じて整理された独立したKubernetesクラスターを表しています。
クラスターはグリッド形式で配置されています。各クラスターは別々のカードとして表示され、健康状態の直感的な概要を提供するために、異なる色とアイコンが使用されています。問題のあるクラスターは赤またはオレンジで強調表示され、迅速に特定して対処することが容易です。
GPUモニタリング画面にアクセスする
システム管理者コントロールパネルから、メインナビゲーションでGPUをクリックします。次に、左側のナビゲーションでGPU Monitoringを選択します。
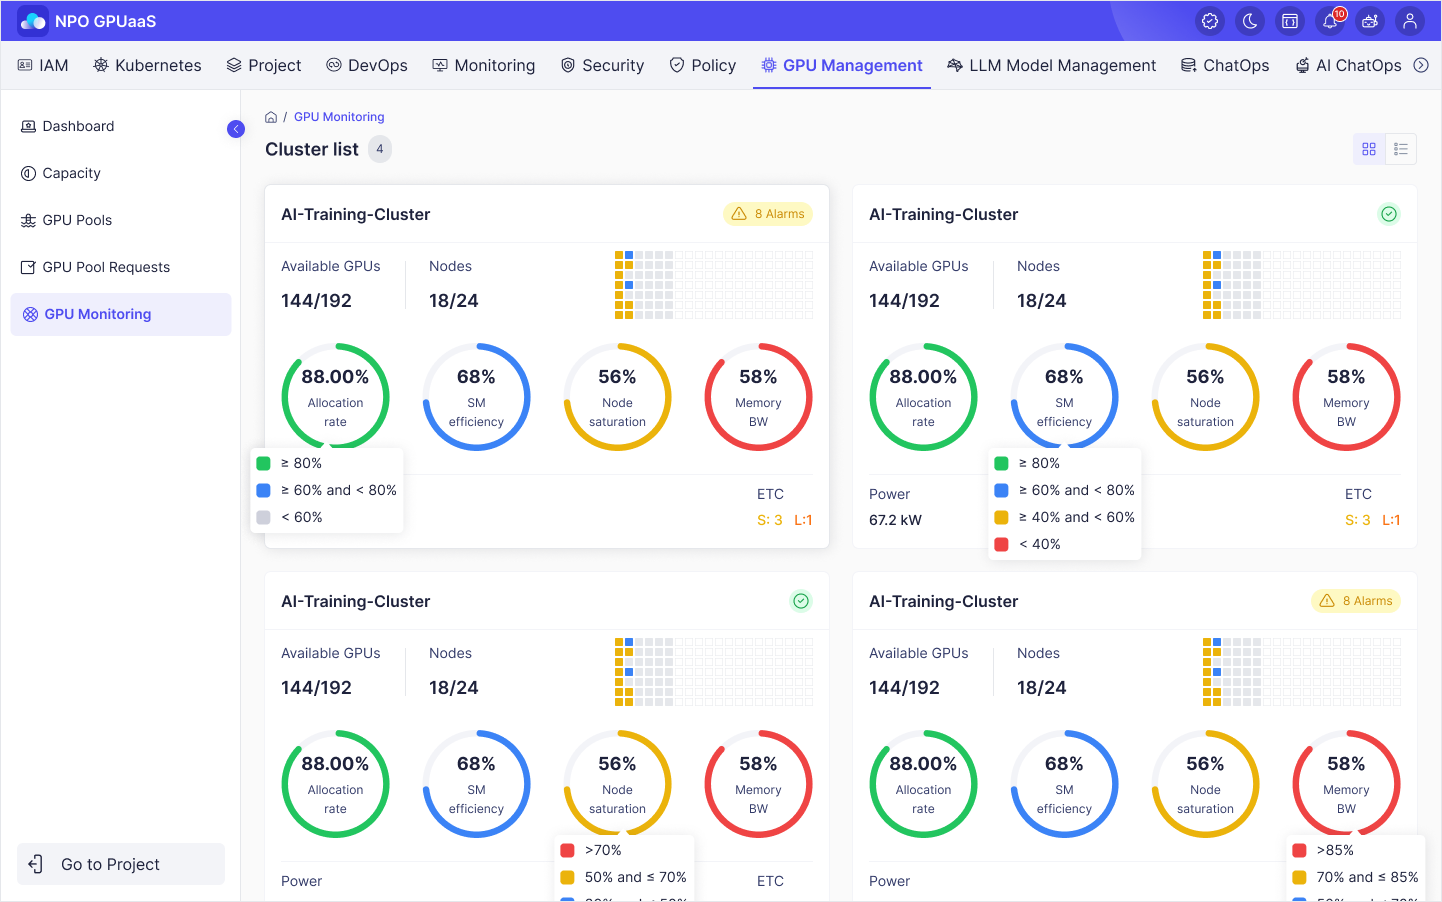
各クラスターは、以下の情報を含む個別のカードとして表されます:
| アイテム | 意味 |
|---|---|
| 利用可能なGPU | クラスター内の合計GPUおよび割り当て可能なGPU |
| ノード | GPUノードの合計数およびGPU割り当てのために利用可能なノードの数 |
| ステータスミニマップ | 各GPUのステータスを色のミニマップとして表示します: - 青: 利用可能 - 黄: 使用中 - 赤: エラー |
| 割り当て率 | 現在使用中のGPUの割合(合計GPUに対する)。 |
| 効率 | GPUのステータスに基づく平均効率。 |
| ノード飽和 | 各ノードあたりの平均GPUリソース使用量。 |
| メモリ帯域幅 | 使用中のGPUの平均メモリ利用率。 |
| 電力 | すべてのGPUの合計電力消費量。 |
| ECC | GPUメモリ内で発生したエラーカウンター |
| S (セッション) | GPUが稼働中に発生したダブルビットエラーの数。 |
| L (ライフタイム) | GPUの全ライフタイムにわたるダブルビットエラーの累積数。 |