API Logging and Gateway Monitoring
API Logging
When the "stdout-log" policy is applied and deployed for each API in the APIM console, the API logs arestored in the ZCP Logging repository.
How to view API Logs
- Log in to the Cloud ZCP console > go to the [System Administrator] screen > click the [Logging]menu
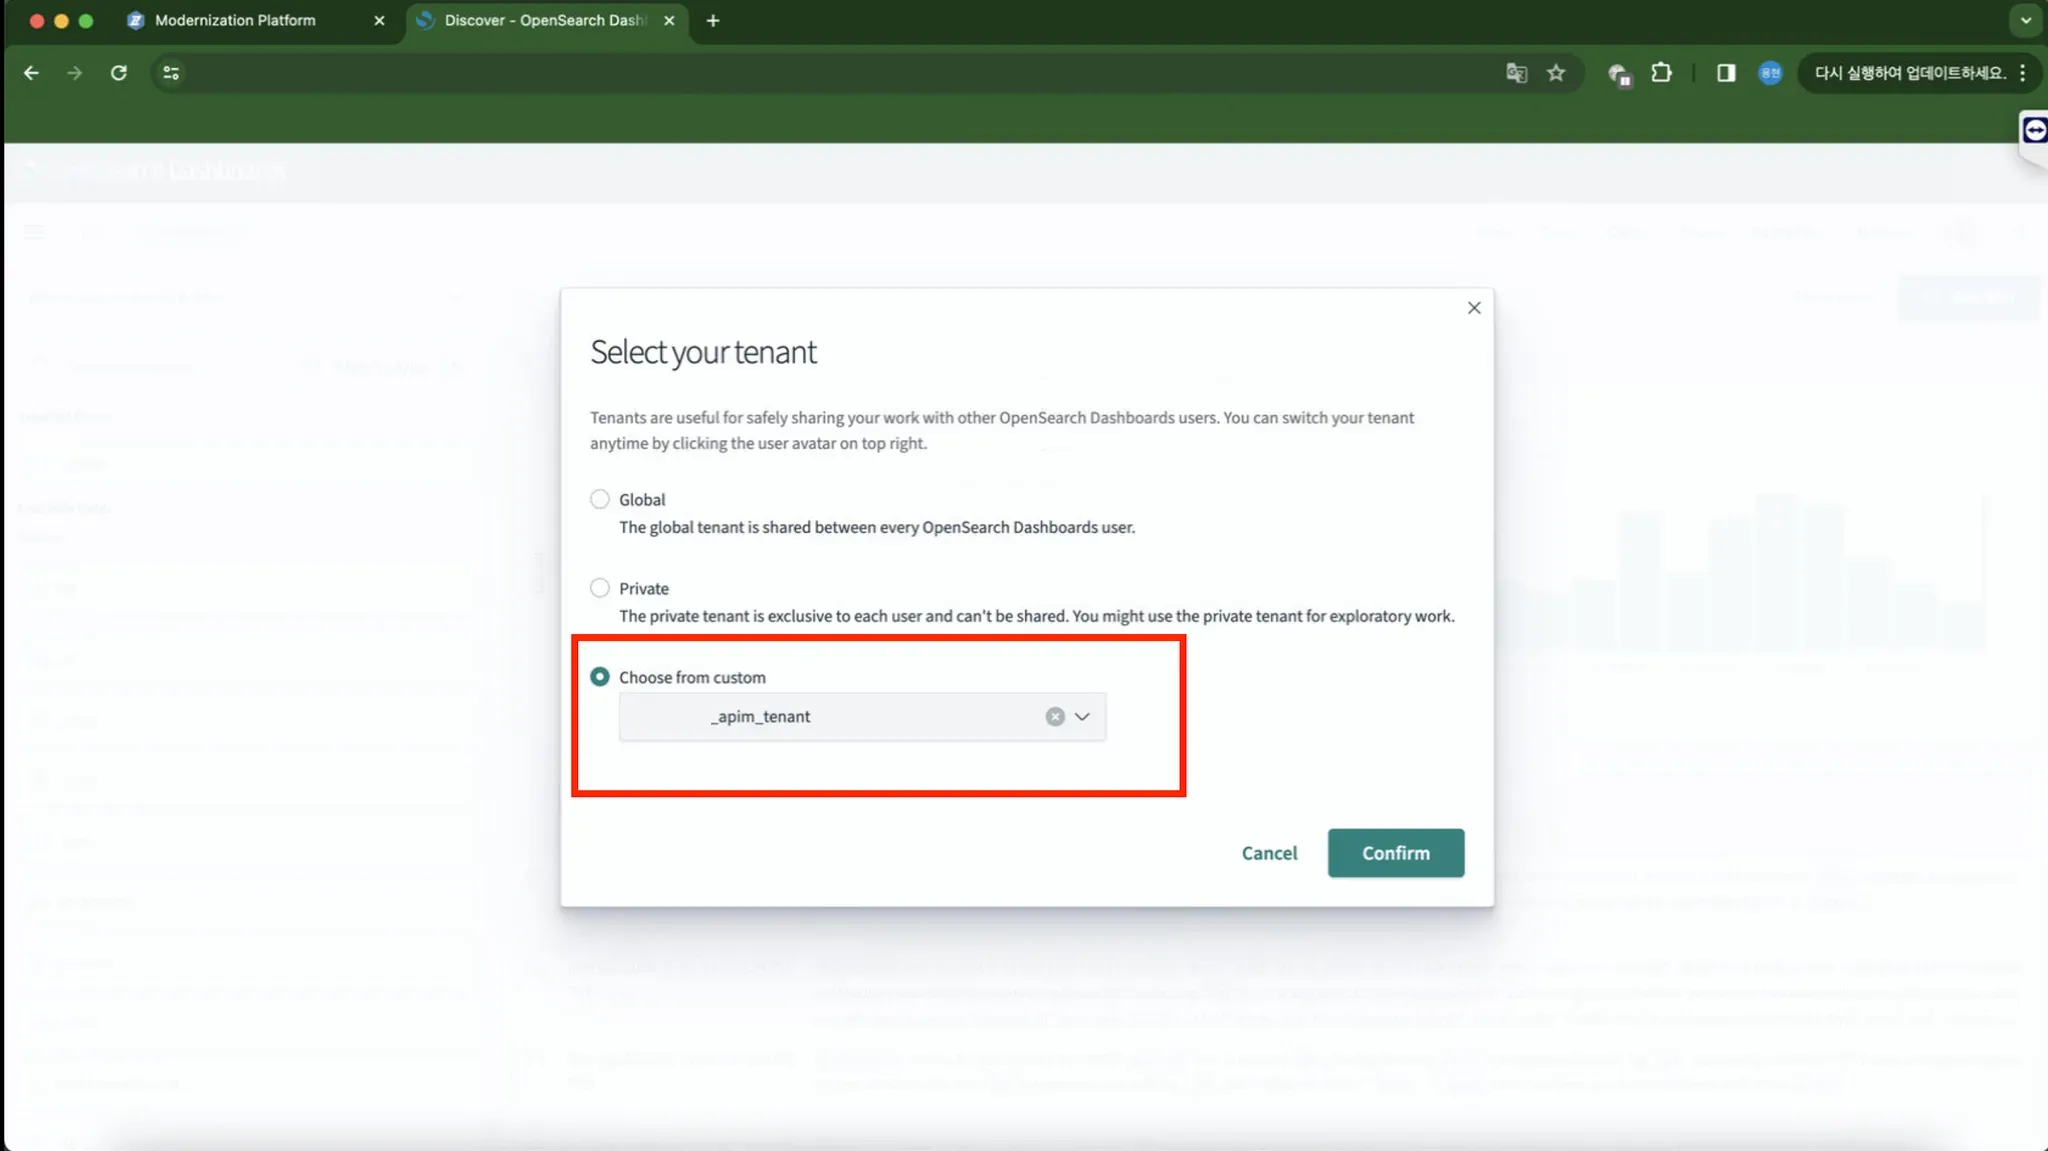
- In Kibana, click the user icon in the top right corner, click Drop Down > Switch tenants > Choosefrom custom > apim_tenant
- [Discover] menu: Search for API Log data (select the xxxx.apim* index) and using + Add Filter:
- kubernetes.container_name: proxy
- api_id: exists
- Filter to distinguish clusters: kubernetes.namespace_labels.cluster: xxxxxx-prd(optional)
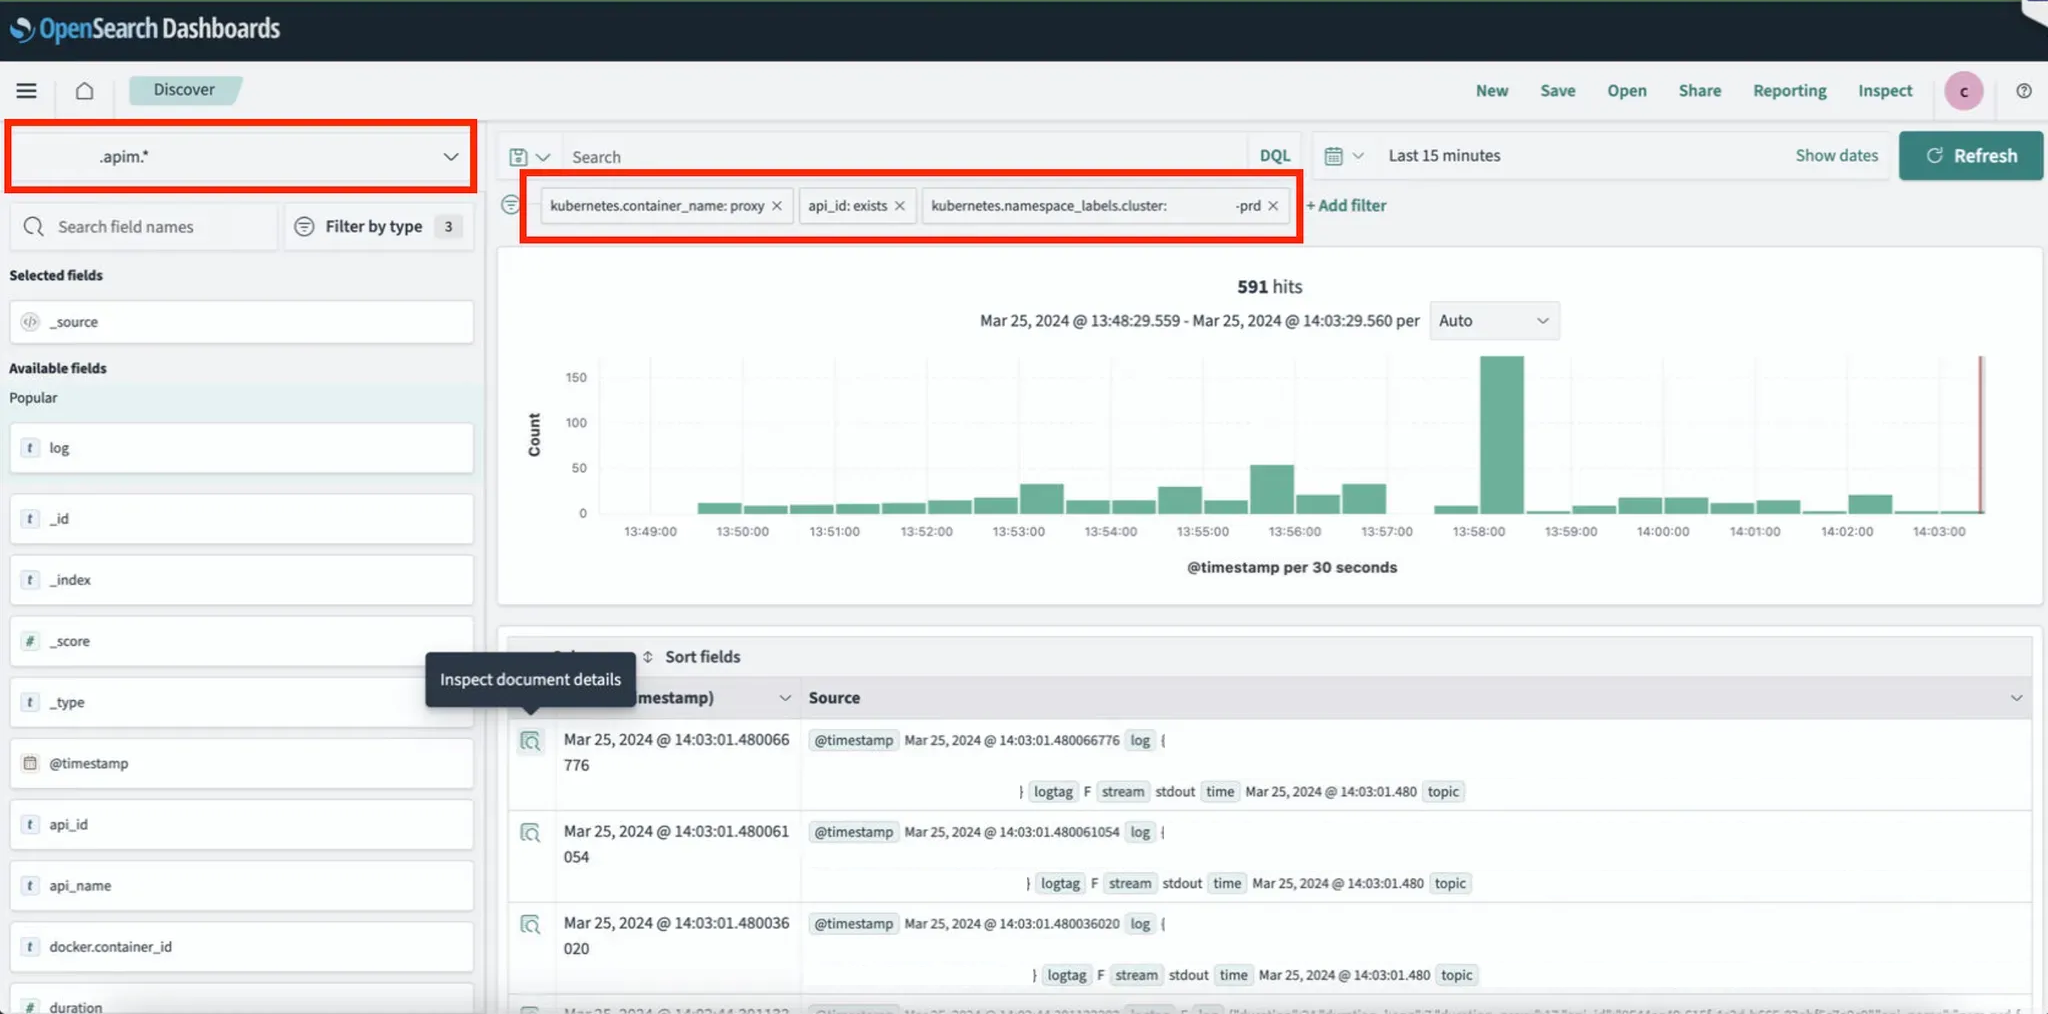
- [Discover] menu: Check API Log details
{
  "_index": "xxxx.apim.xxxxx-prd.apim-xxxx.xx.xx",
  "_id": "xxxxxxxxxxxxxx",
  "_score": 1,
  "_source": {
    "@timestamp": "dd mm yyyy hh:mm:ss.sssZ",
    "log": "{\"space_name\":\"xxxxxxx\",\"request_uri\":\"/path/to/api\",\"request_method\":\"POST\",\"duration\":xx,\"api_id\":\"xxxxxxxx-xxxx-xxxx-xxxx-xxxxxxxxxxxx\",\"response_status\":200,\"api_name\":\"xxxxxx\",\"response_size\":xxx,\"request_size\":xxx,\"start_at\":xxxxxxxxxxxxxxx,\"duration_kong\":0,\"duration_proxy\":xx,\"space_id\":\"xxxxxxxx-xxxx-xxxx-xxxx-xxxxxxxxxxxx\"}",
    "logtag": "F",
    "stream": "stdout",
    "time": "dd mm yyyy hh:mm:ss.sss+hh:mm",
    "topic": "kube.var.log.containers.xxxxx-apim.xxxx-xxxx-yyyyy.log",
    "space_name": "xxxxxxx",
    "request_uri": "/path/to/api",
    "request_method": "POST",
    "duration": xx,
    "api_id": "xxxxxxxx-xxxx-xxxx-xxxx-xxxxxxxxxxxx",
    "response_status": 200,
    "api_name": "xxxxxx",
    "response_size": xxx,
    "request_size": xxx,
    "start_at": xxxxxxxxxxxxxxx,
    "duration_kong": 0,
    "duration_proxy": xx,
    "space_id": "xxxxxxxx-xxxx-xxxx-xxxx-xxxxxxxxxxxx",
    "kubernetes": {
      "container_name": "xxxx",
      "namespace_name": "xxxx",
      "pod_name": "xxxx-xxxx-xxxx-xxxx",
      "container_image": "xxxxxx",
      "container_image_id": "xxxxxxxxxxxxxxxxxxxxxxxxxxxxxxxxxxxxxxxxxxxxxxxxxxxxxxxxxxxxxxxx",
      "pod_id": "xxxxxxxx-xxxx-xxxx-xxxx-xxxxxxxxxxxx",
      "pod_ip": "xxx.xxx.xxx.xxx",
      "host": "xxxxxx",
      "labels": {
        "app": "xxxxxx",
        "app_kubernetes_io/component": "xxxx",
        "app_kubernetes_io/instance": "xxxxxx",
        "app_kubernetes_io/managed-by": "Helm",
        "app_kubernetes_io/name": "xxxx",
        "app_kubernetes_io/version": "x.x",
        "helm_sh/chart": "xxxx-x.x.x",
        "pod-template-hash": "xxxxxxxx",
        "security_istio_io/tlsMode": "istio",
        "service_istio_io/canonical-name": "xxxx",
        "service_istio_io/canonical-revision": "x.x",
        "version": "x.x"
      },
      "master_url": "https://xxx.xxx.xxx.xxx:xxx/api",
      "namespace_id": "xxxxxxxx-xxxx-xxxx-xxxx-xxxxxxxxxxxx",
      "namespace_labels": {
        "cloudzcp_io/deploygroup": "xxxxxx",
        "cloudzcp_io/deploygroup-cluster": "xxxxxx-prd",
        "cloudzcp_io/managed-by": "xxxx",
        "cloudzcp_io/project": "xxxx",
        "cloudzcp_io/realm": "xxxxxx",
        "cloudzdb_io/zdb-system": "true",
        "cluster": "xxxxxx-prd",
        "istio-injection": "enabled",
        "kubernetes_io/metadata_name": "xxxx",
        "project": "xxxx",
        "realm": "xxxxxx"
      }
    },
    "docker": {
      "container_id": "xxxxxxxxxxxxxxxxxxxxxxxxxxxxxxxxxxxxxxxxxxxxxxxxxxxxxxxxxxxxxxxx"
    },
    "tag": "projectPlain.project.kube.var.log.containers.xxxxx-apim.xxxx-xxxx-yyyyy.log"
  },
  "fields": {
    "@timestamp": [
      "dd mm yyyy hh:mm:ss.sssZ"
    ],
    "time": [
      "dd mm yyyy hh:mm:ss.sssZ"
    ]
  }
}
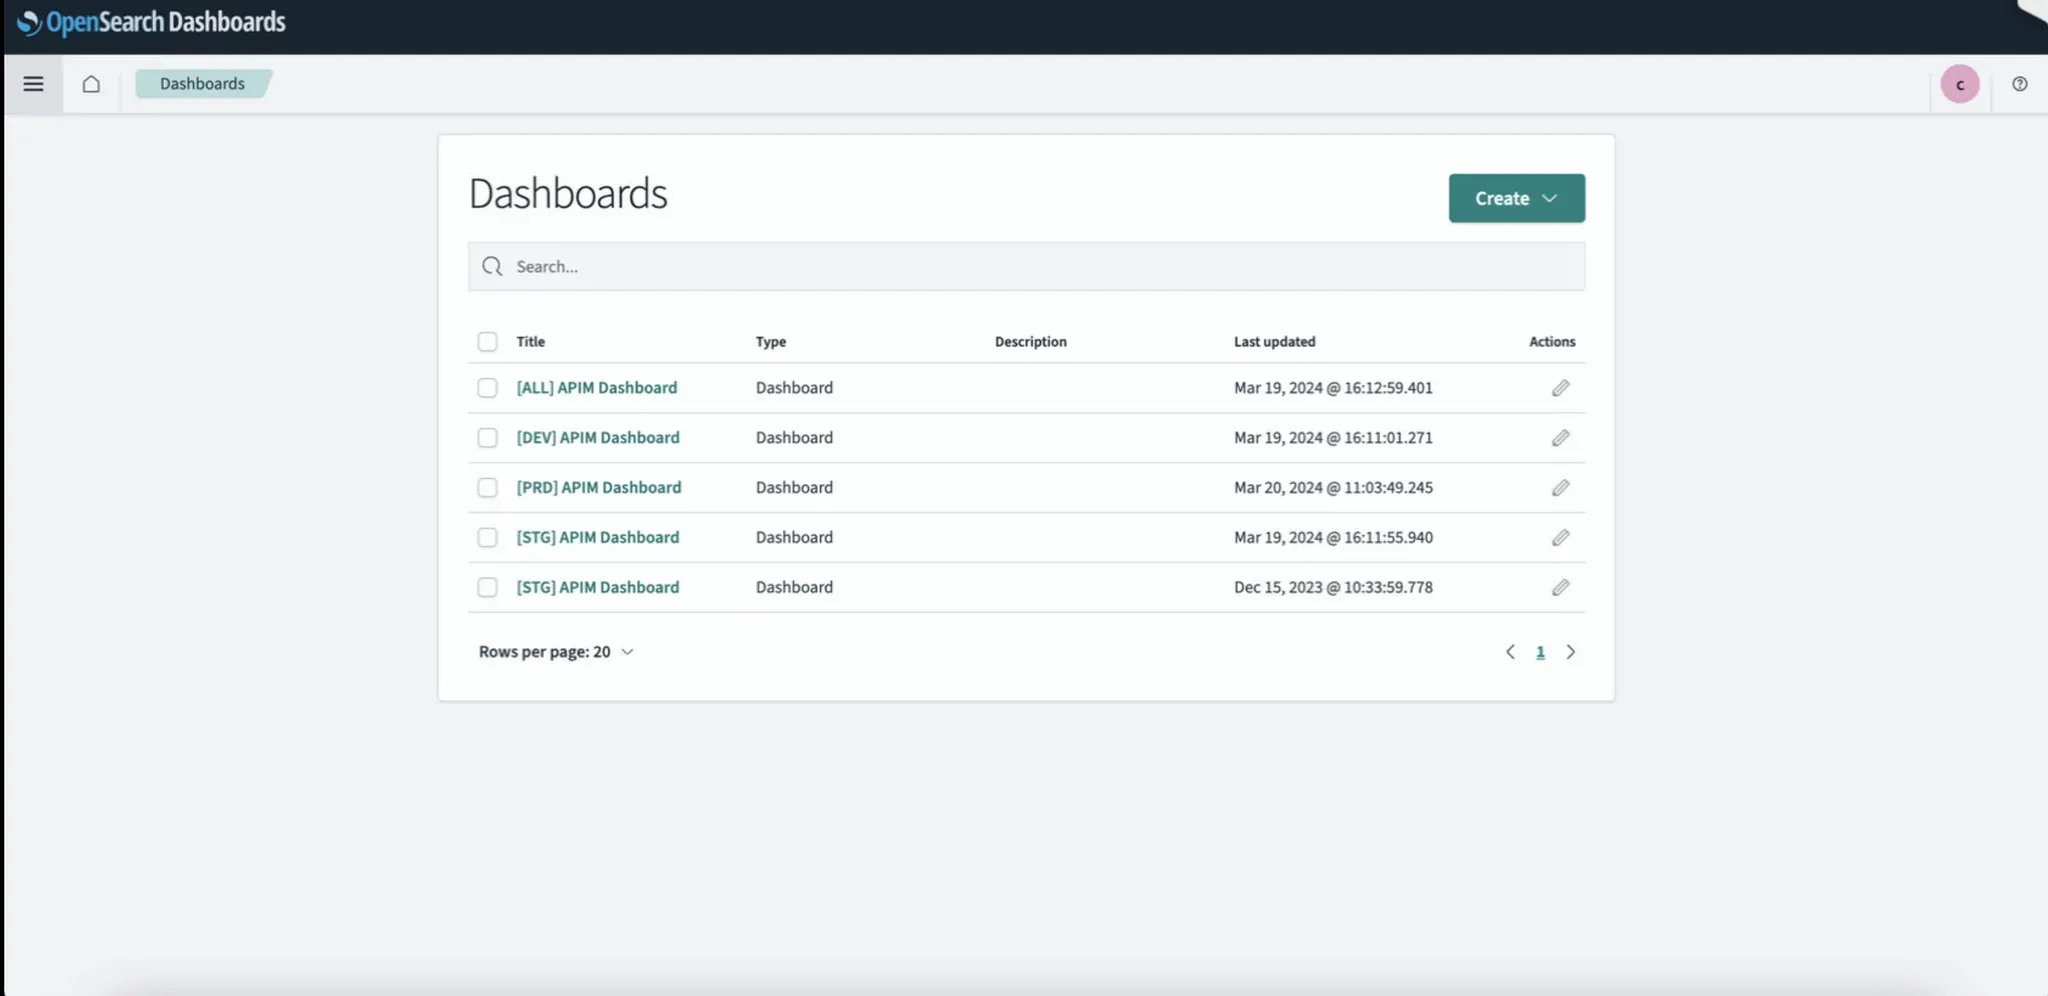
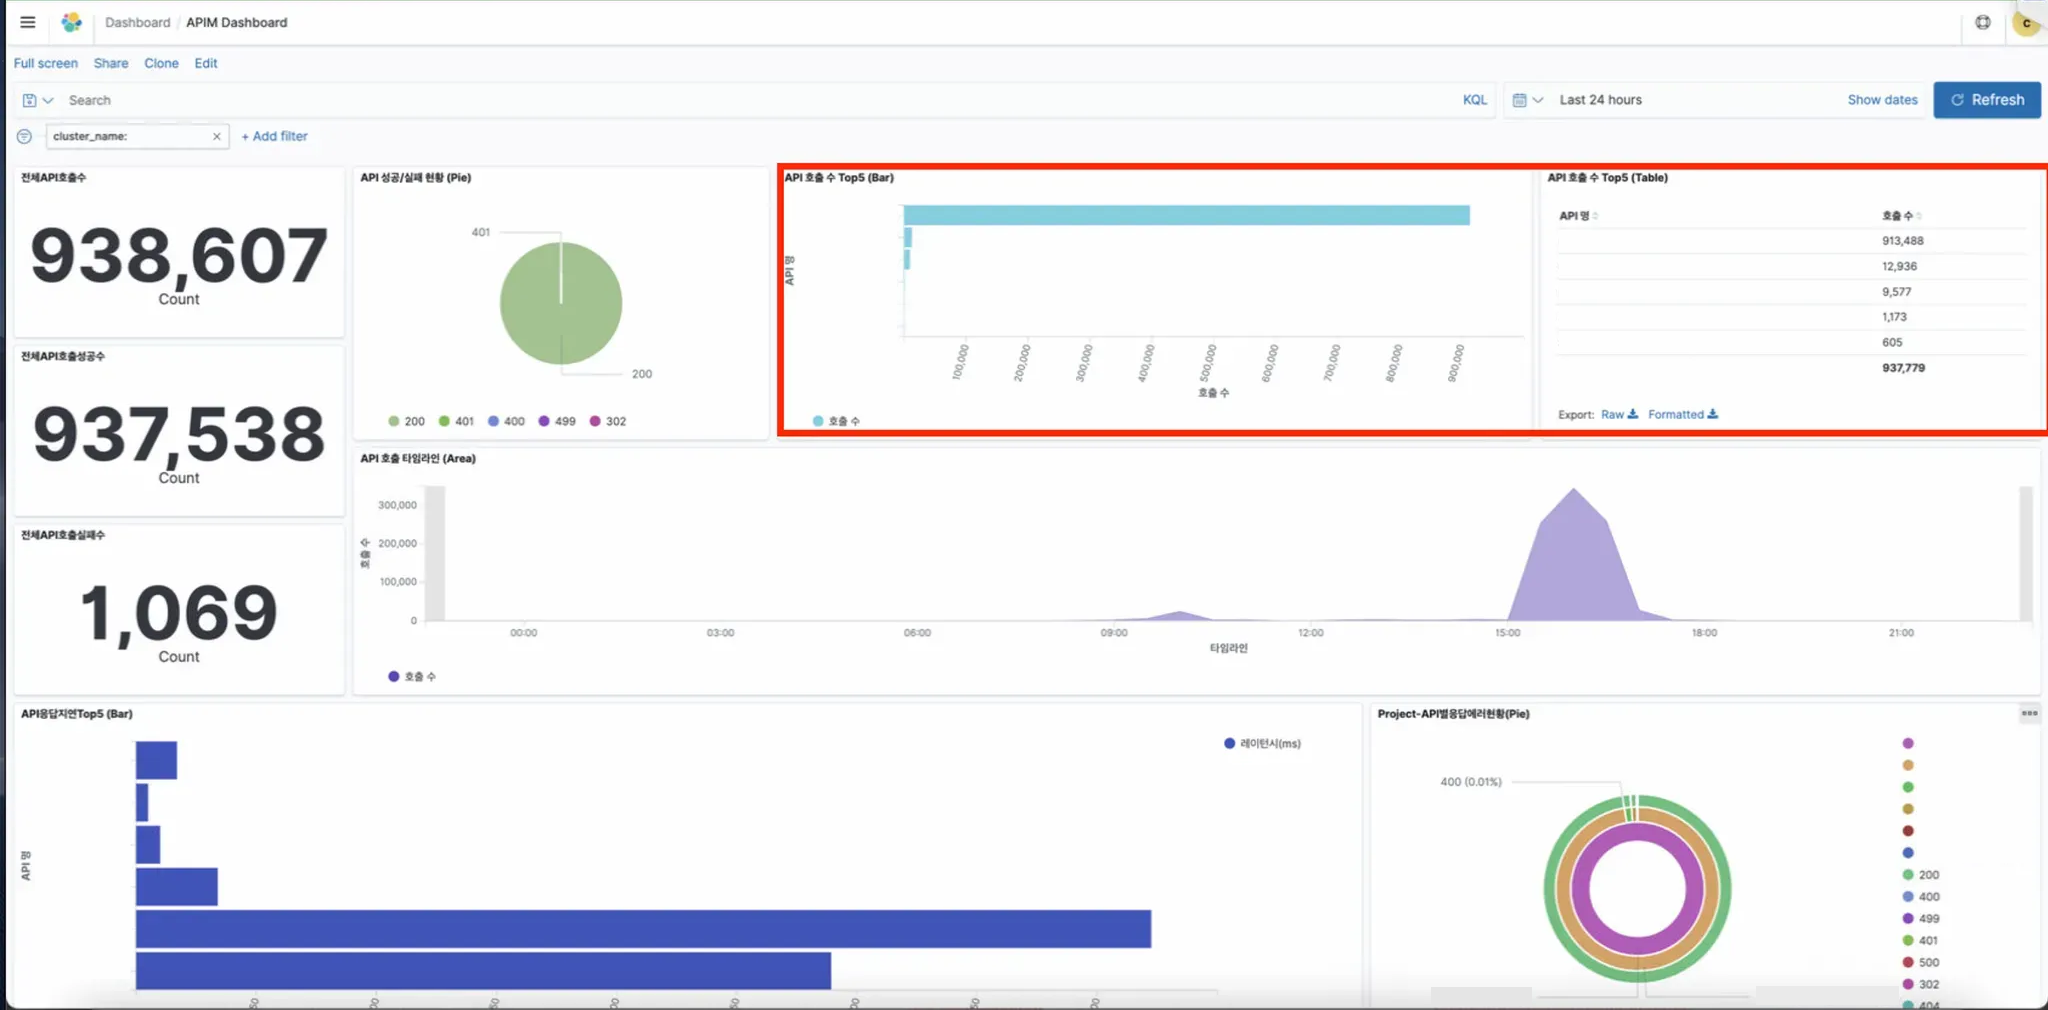
- [Dashboard] Menu: Check the APIM Dashboard, categorized by environments (DEV, STG, PRD).
Dashboard Description
- Total API Calls, Total Successful Calls, Total Failed Calls, and Success/Failure Status:
The number of failures may include non-critical errors such as 401, 499, which are notnecessarily fatal errors from the actual application. Therefore, it is important to alsocheck the status code (Success/Failure Status).
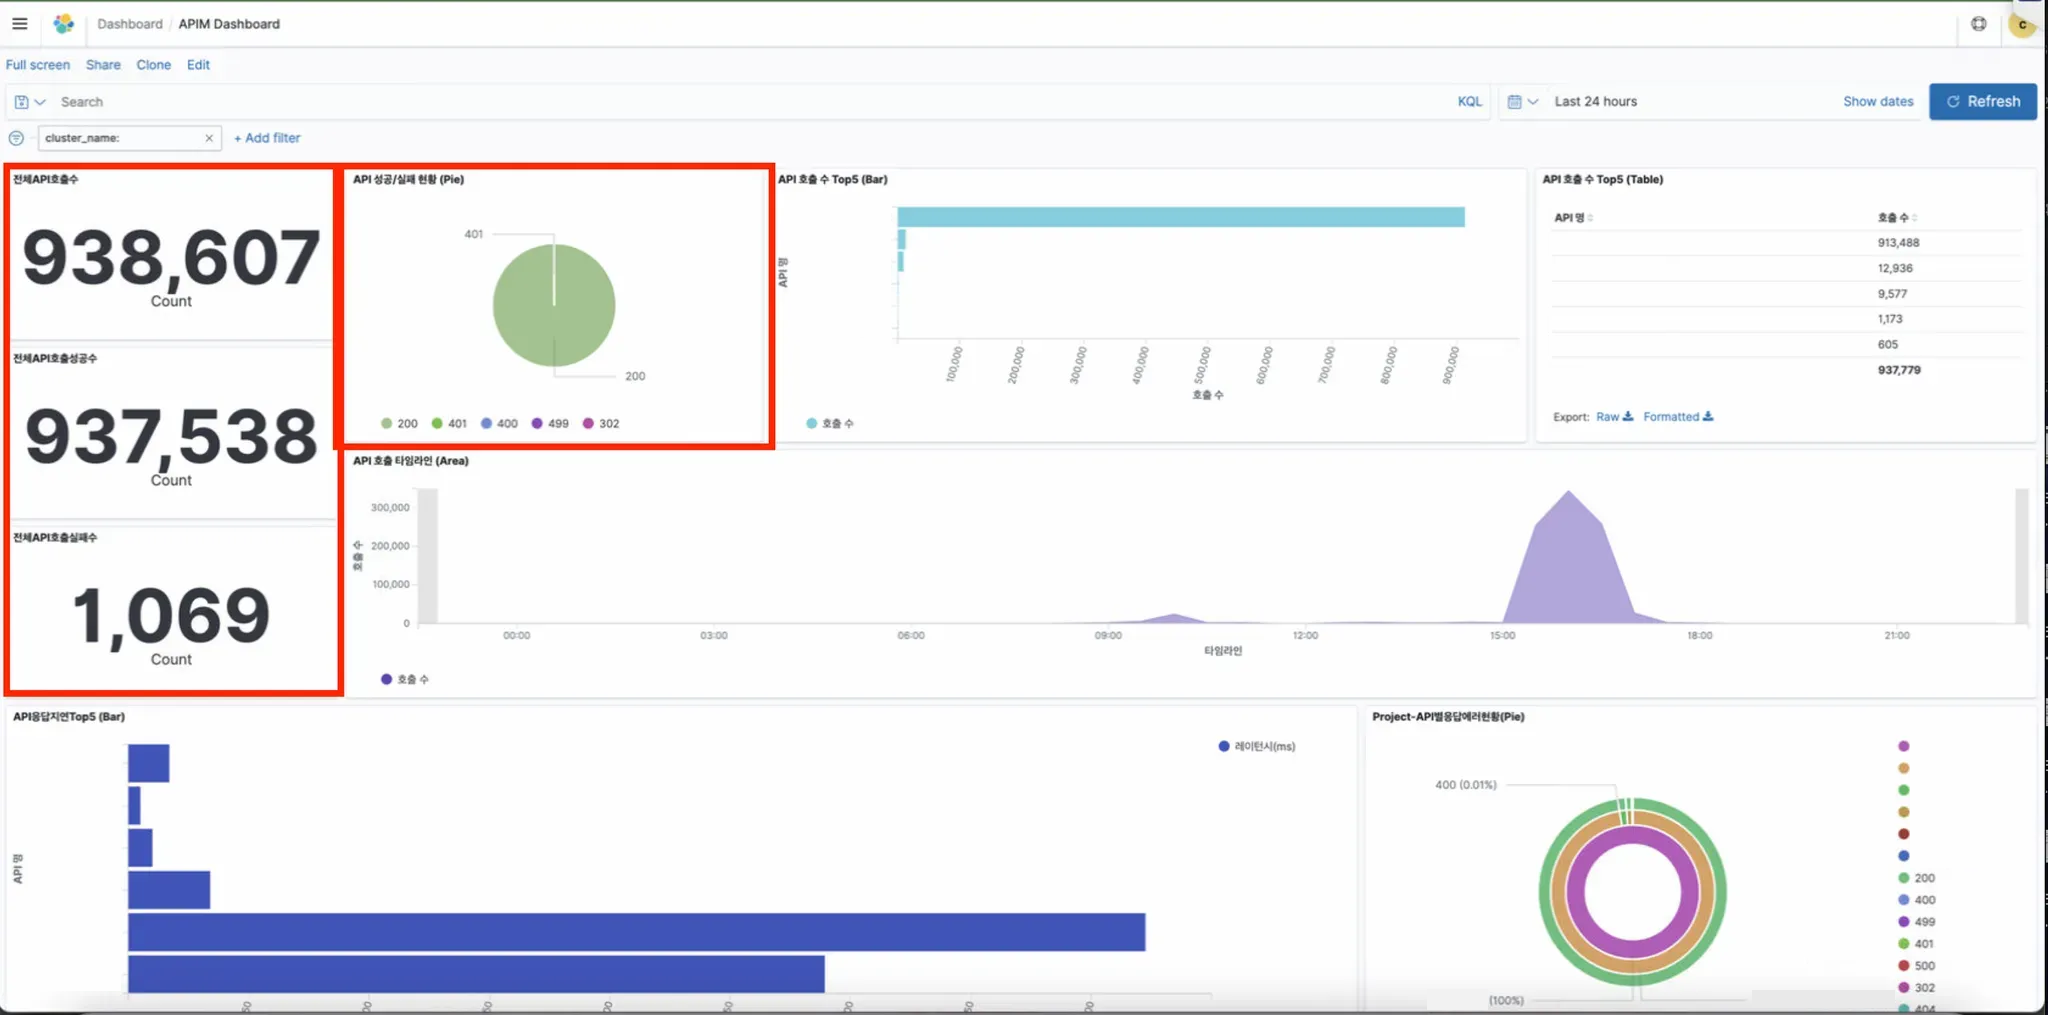
- Top 5 API Calls - Bar Chart, Table:
You can view the status of APIs that are primary called during performance testing
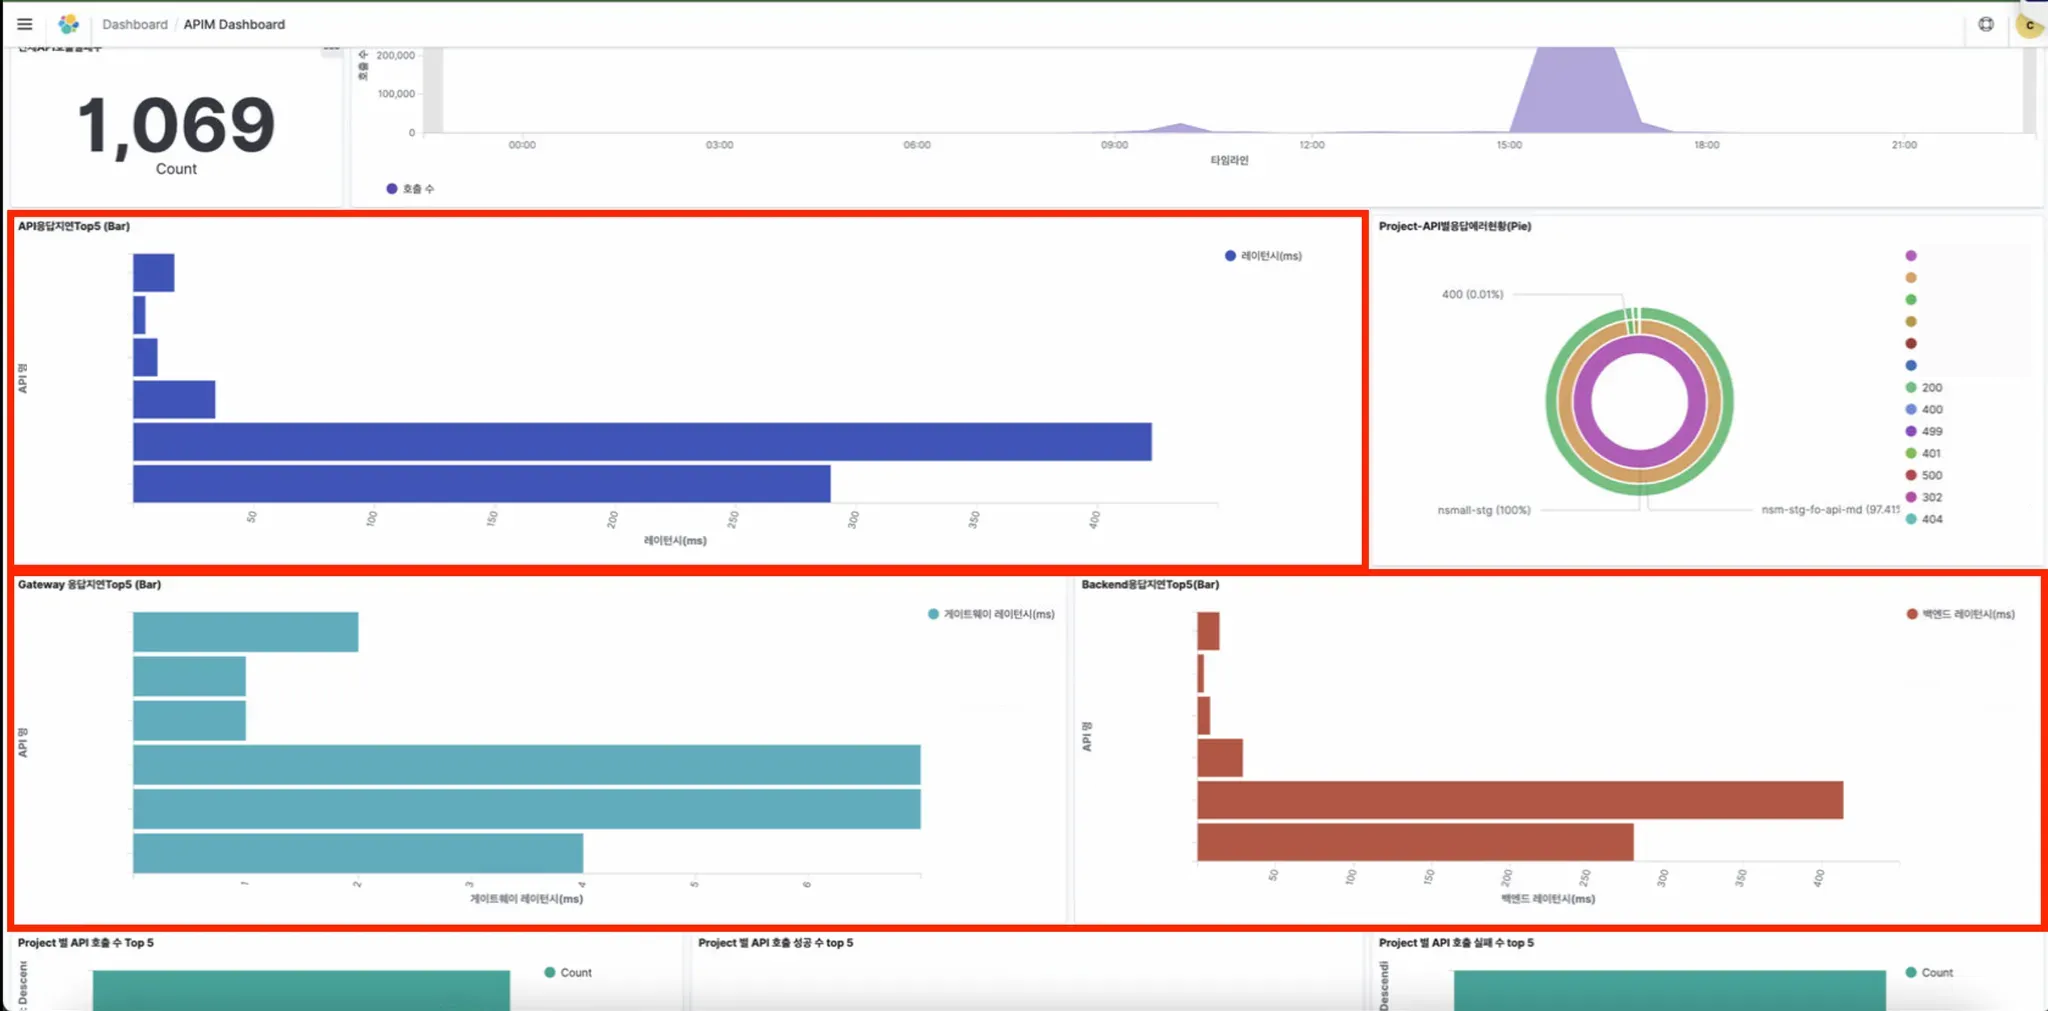
- Top 5 API Response Delays:
- Displays APIs with slow response delays when called.
- Gateway Response Delay: Delay caused at the gateway.
- Backend Response Delay: Delay in response from the backend application.
- API Response Delay: The total delay, combining gateway and backend response delays.
- Since all response delay values are measured in milliseconds (ms), a 100ms delay is only0.1 seconds, which is not significantly slow. Generally, a response time around 1000ms (1second) or more is considered slow.
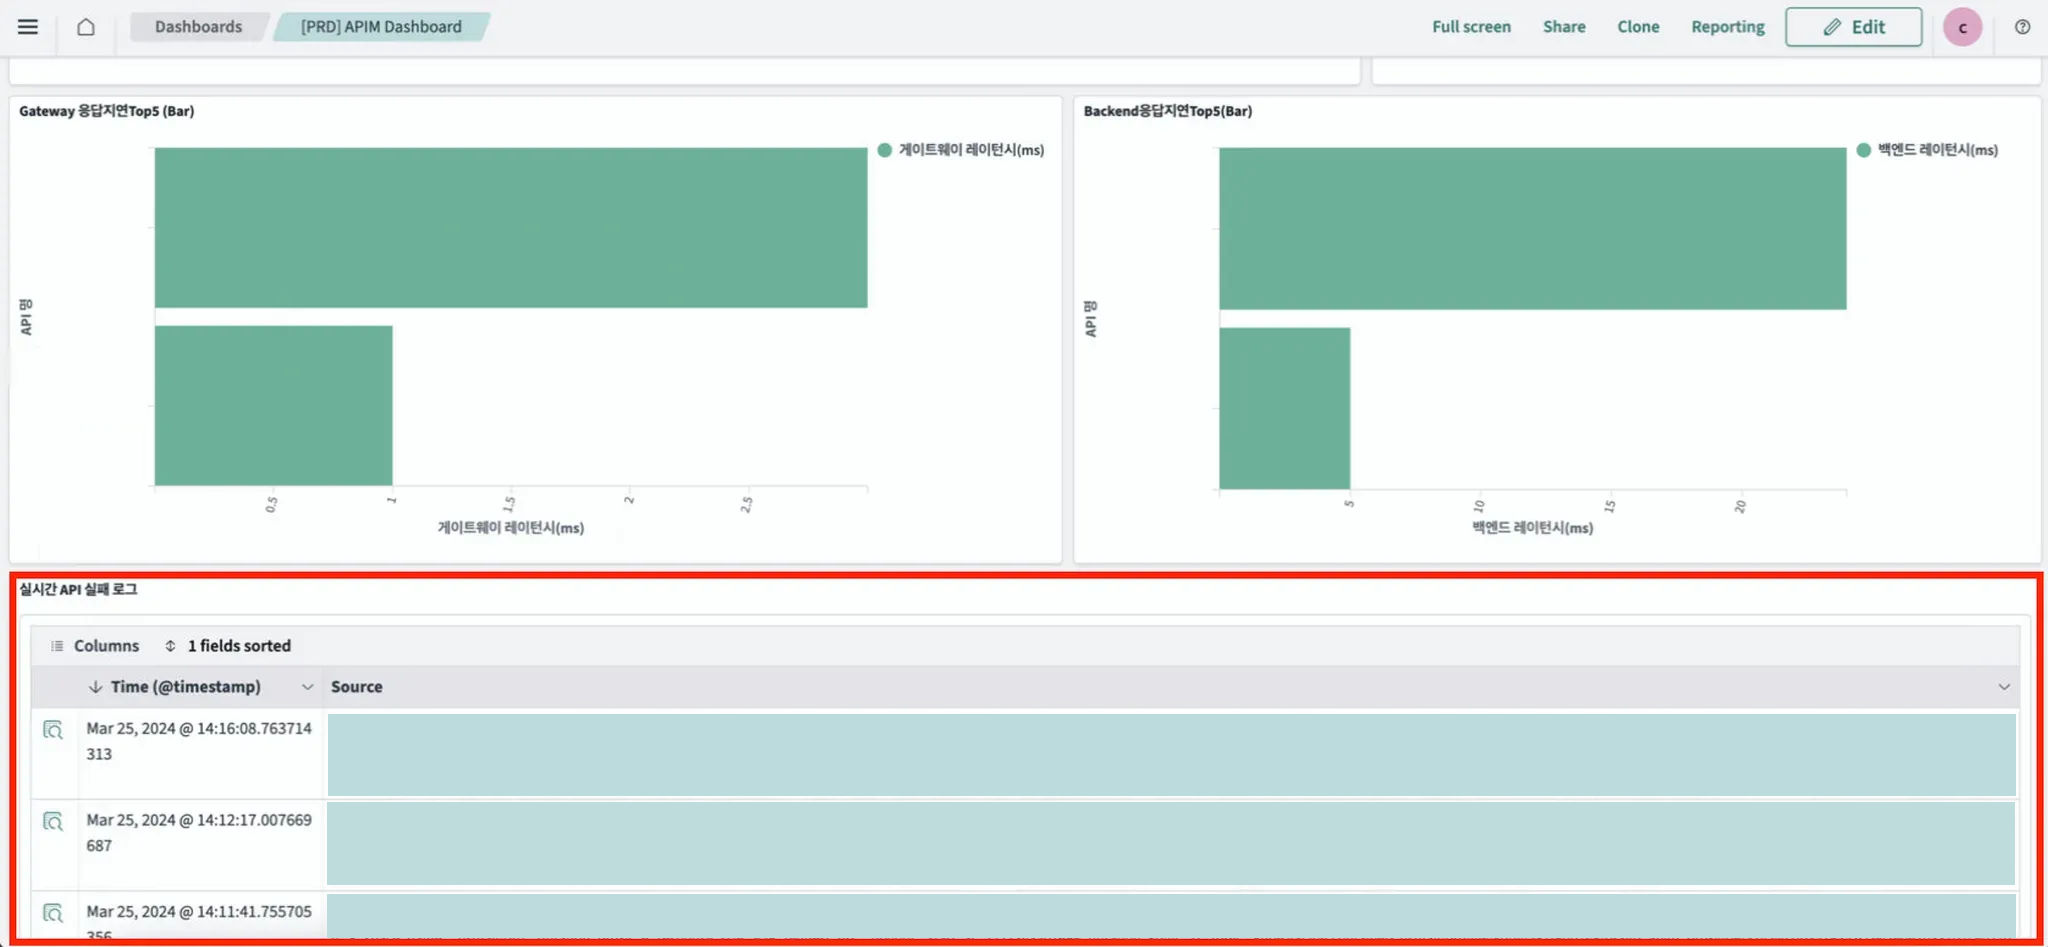
- Check failure log:
User can check logs of API calls where the status code is not 200.
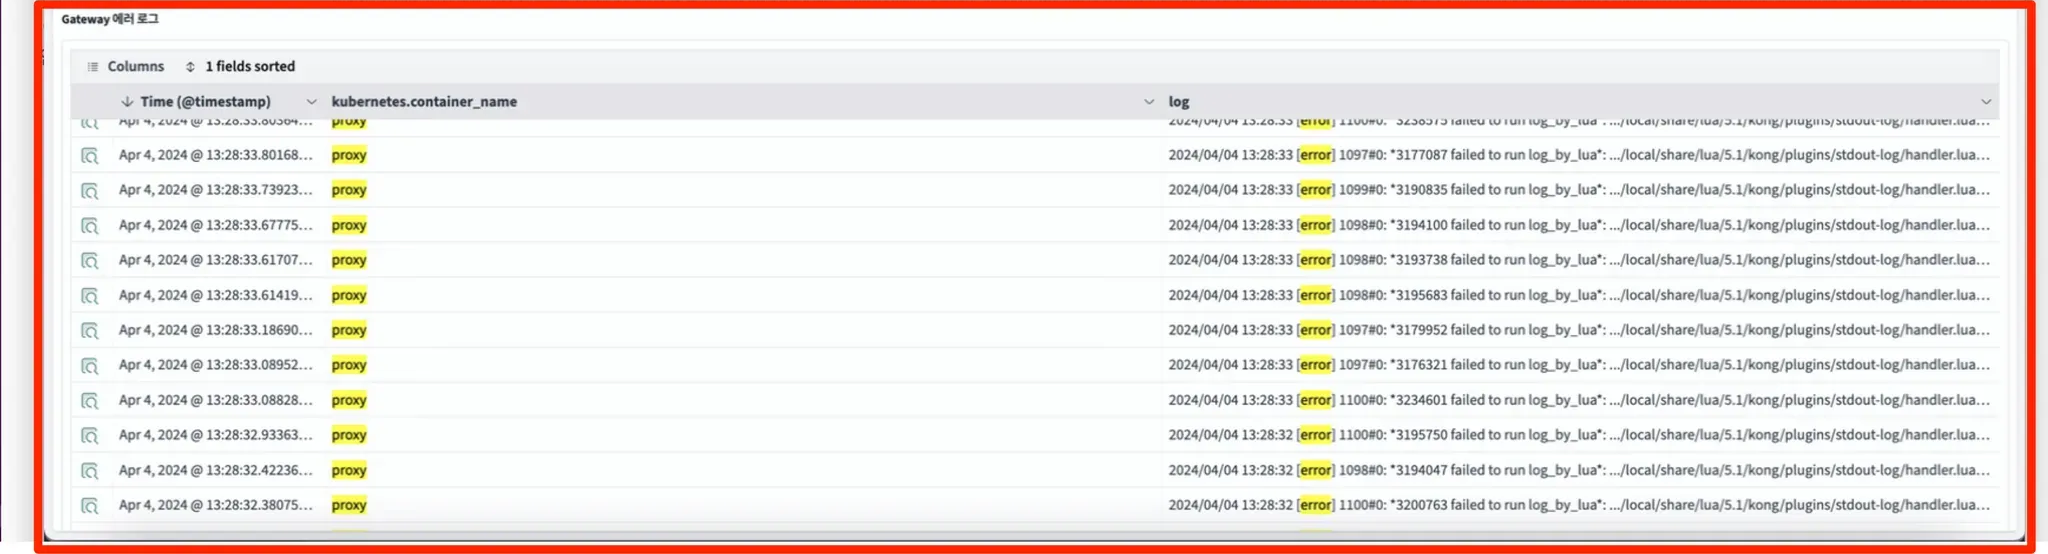
- Kong Gateway Error Log:
You can check the error log that occurs in Kong Gateway. Use error, redis as a log filter.
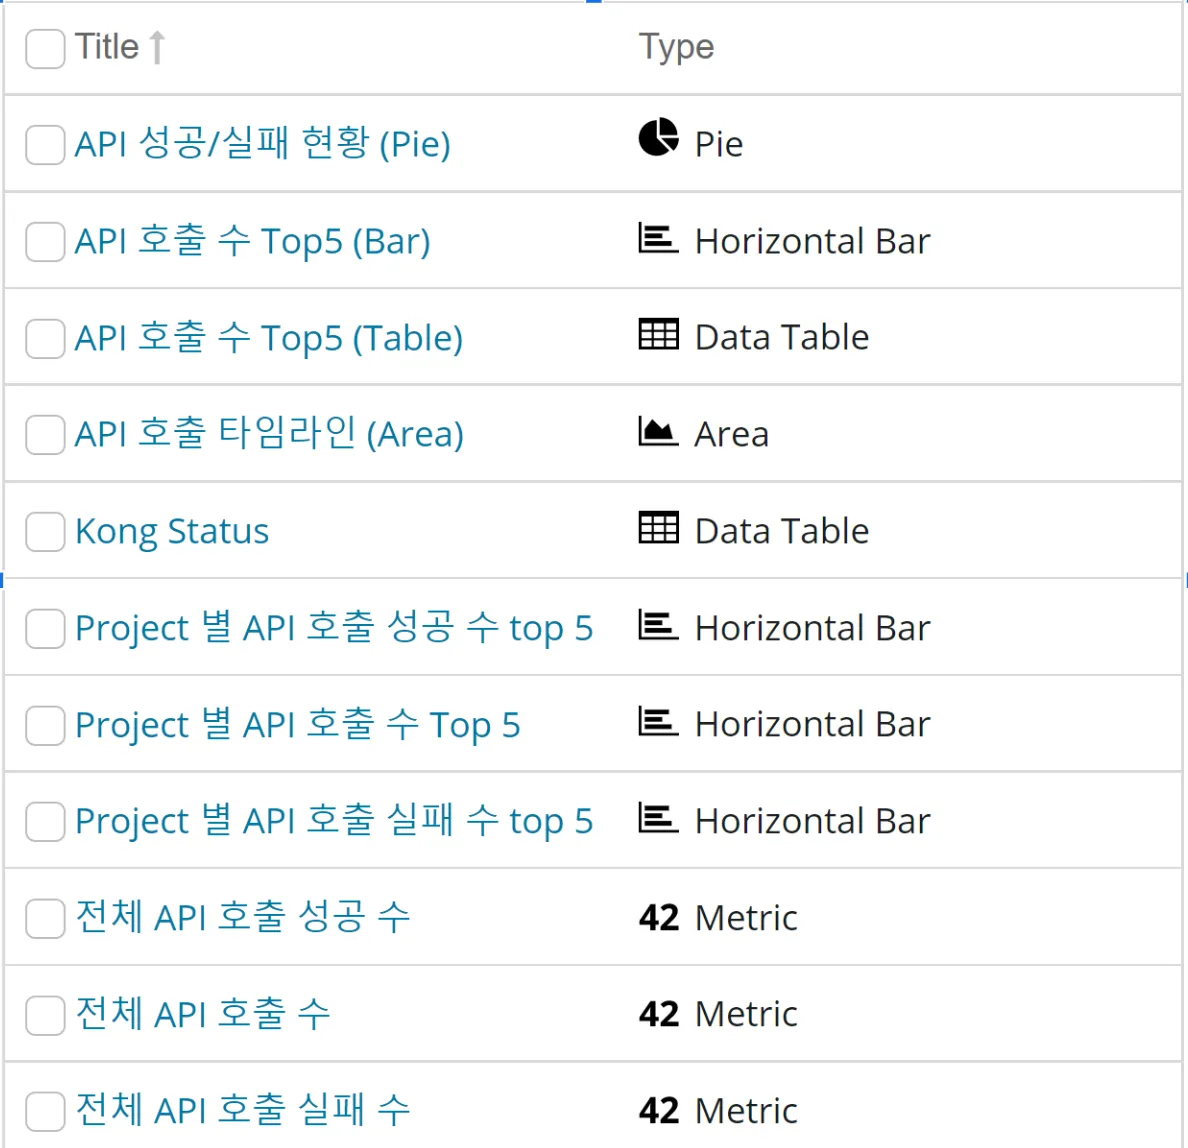
[Visualize] menu : APIM Custom Chart can be managed
API Gateway Monitoring
- Log in to the Cloud ZCP console> Go to the [System Administrator] screen > click the[Monitoring] menu > click the [Advanced Monitoring] button
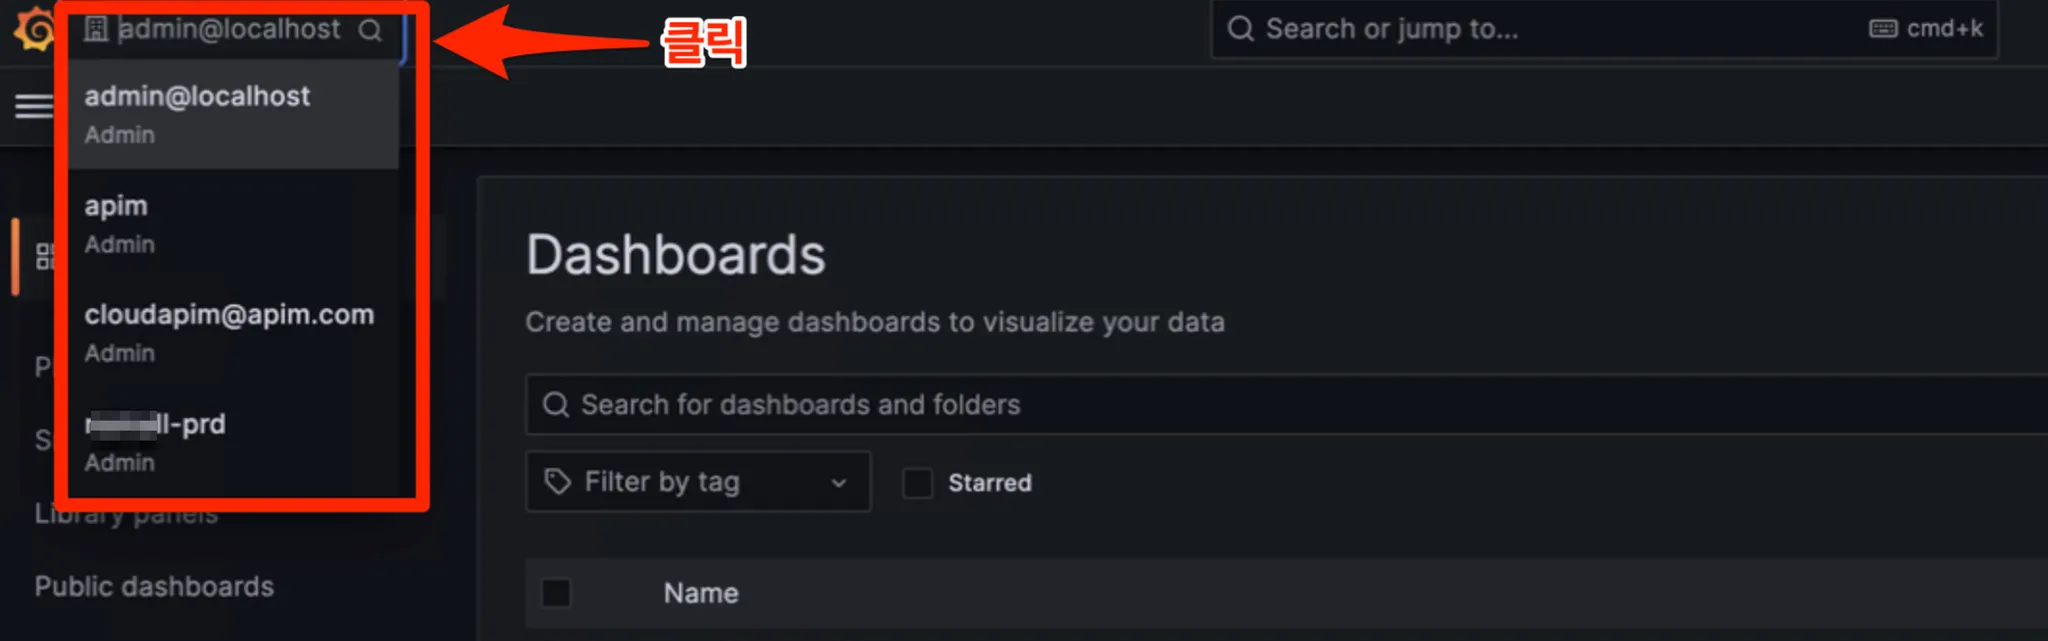
- Grafana > User ID in the Top left corner > select admin@localhost
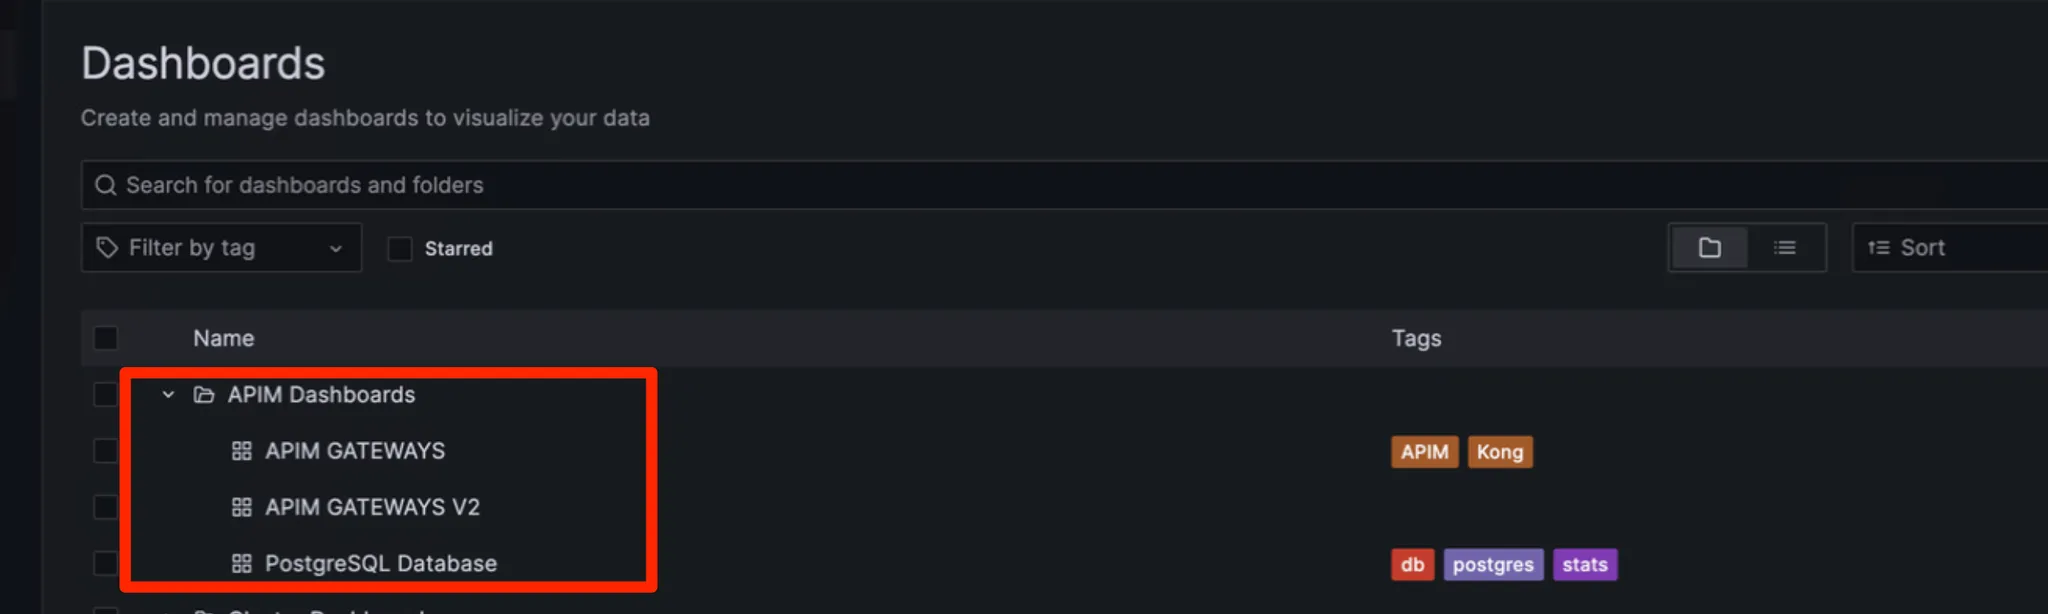
- Dashboards > Browse > APIM Dashboard
API Gateway Resource Metric
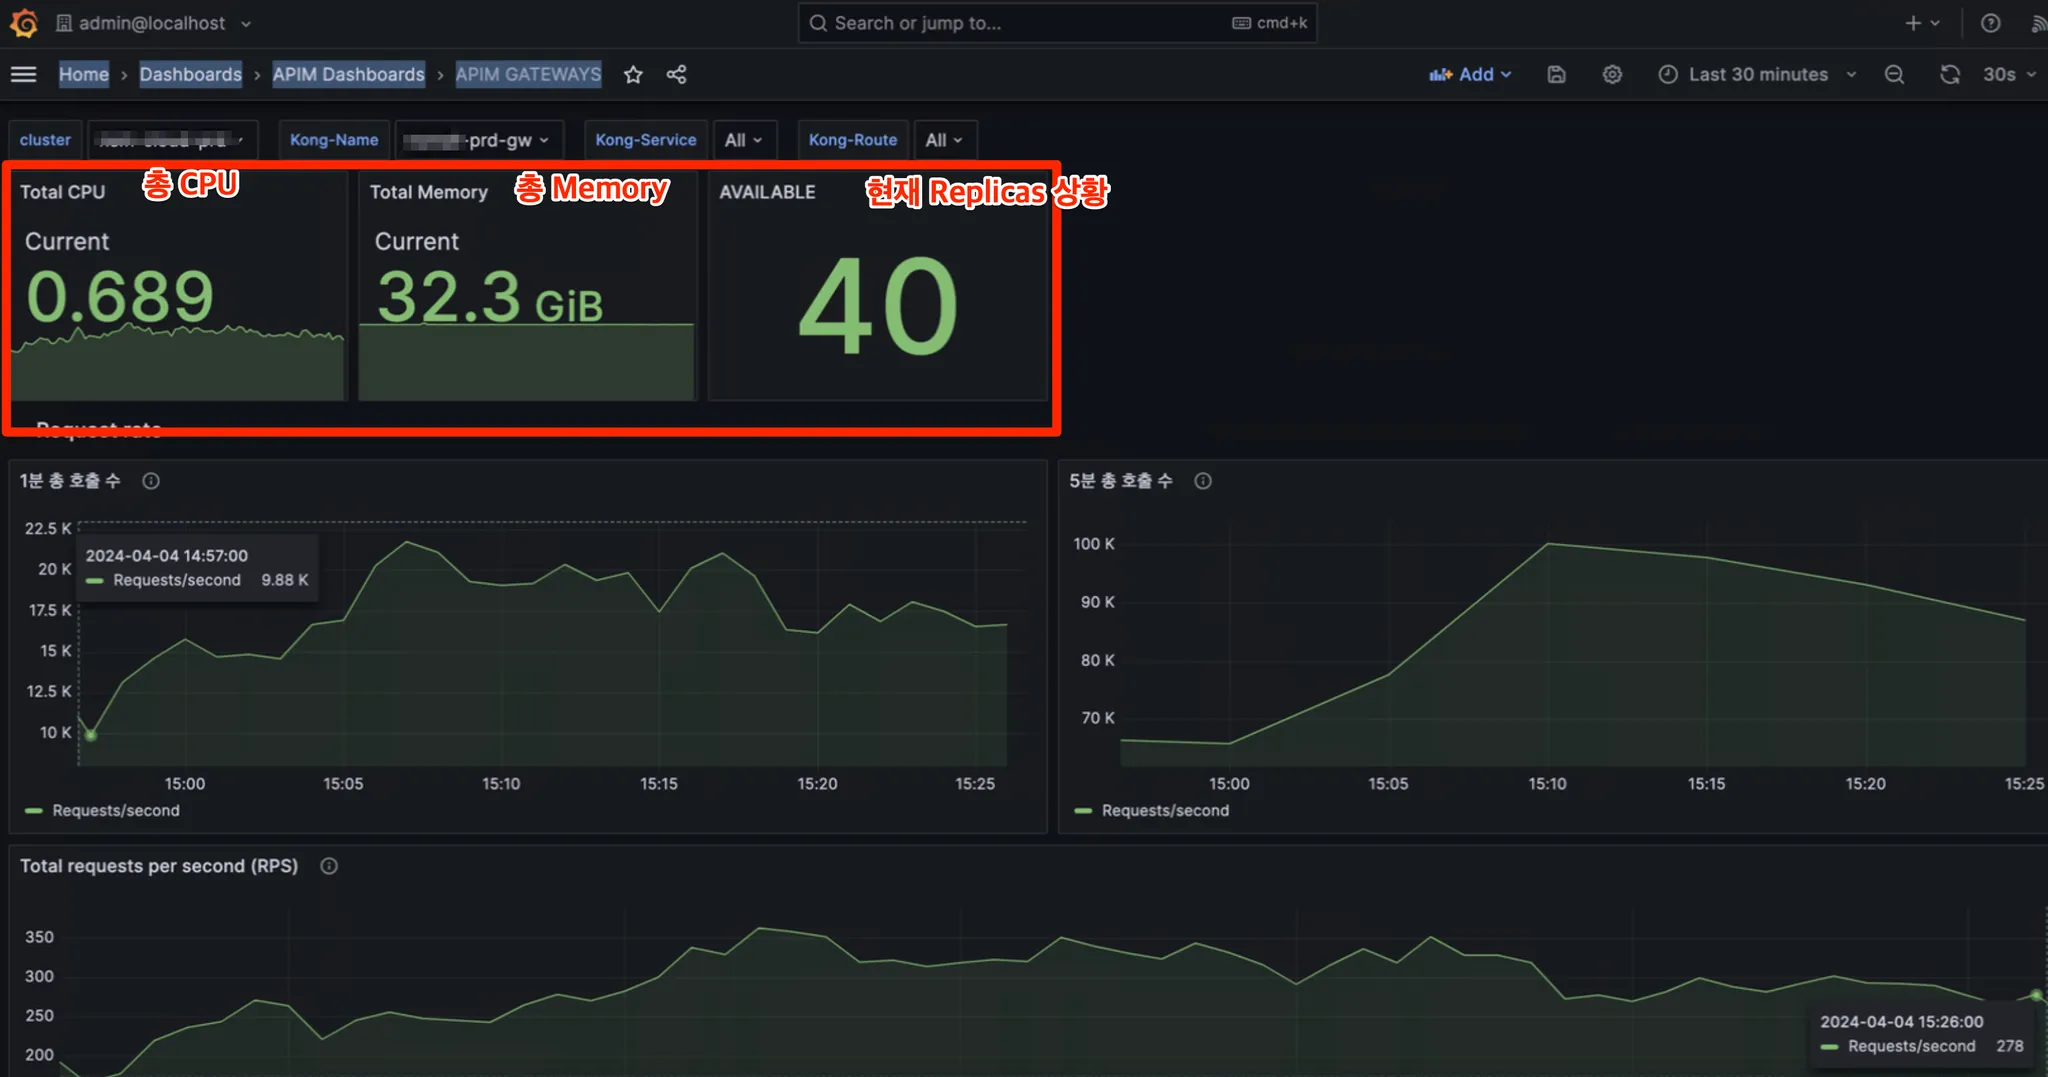
- Home > Dashboards > APIM Dashboards > APIM GATEWAYS
- Cluster, Kong-Name, Kong-Service, Kong-Route
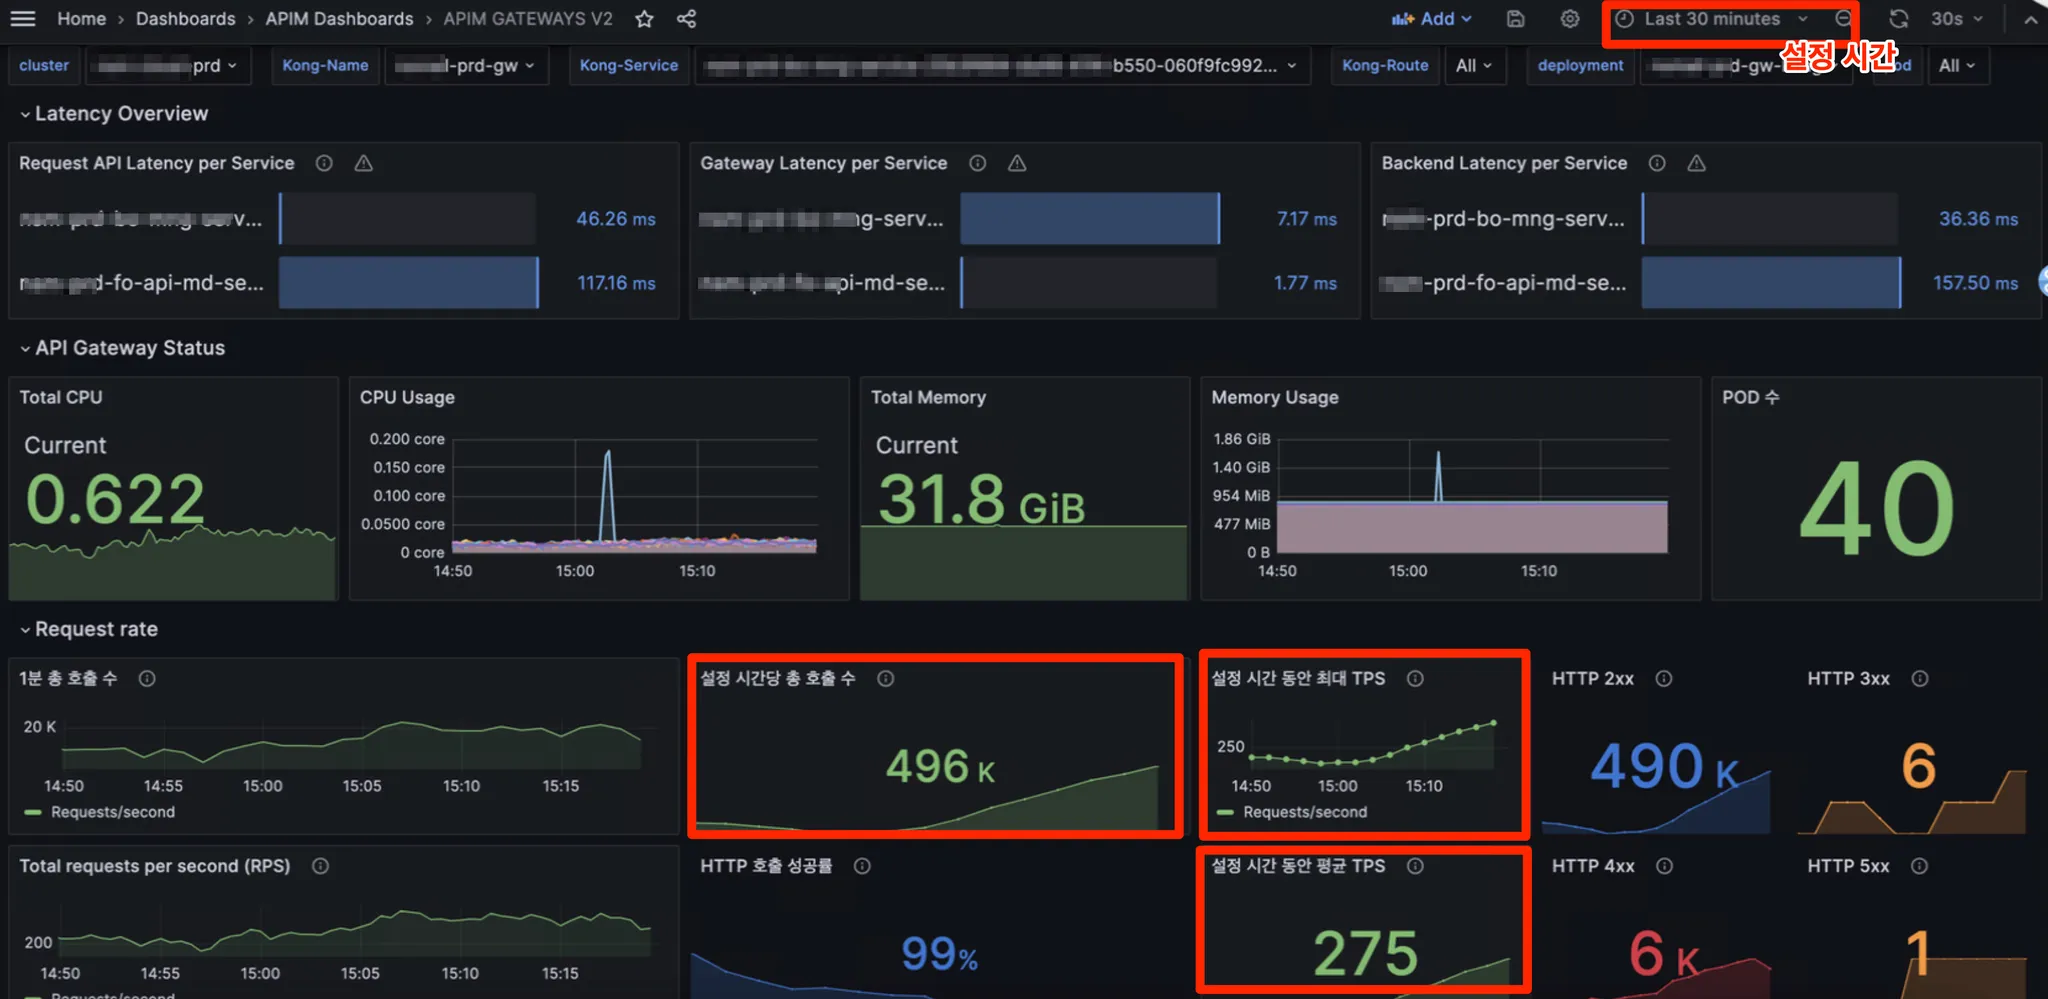
API Gateway Resource Metric. v2
Version with more detailed indicators of the gateway.
- Home > Dashboards > APIM Dashboards > APIM > GATEWAYS V2
- Cluster, Kong-name, Kong-service, Kong-Route, Deployment, Pod
APIM Logging/Monitoring Data Cumulative Equation Sample Guide
Amount of APIM Logging data
APIM API Log:
- Frequency: Anytime.
- Single Amount of Data: 2KB + HTTP Body Size.
- Monthly Data Collection Scale:
- Log With Body: When set to True
- Assumption: Average Body Size Assuming 10KB with 3000 calls per minute (50 calls per second)
- (2 KB + 10 KB) * 3000 calls * 60 minutes * 24 hours * 30 days = 1555 GB
- Log With Body: When False is set
- Assumption: With an average body size of 0 KB and 3000 calls per minute (50calls per second)
- (2 KB + 0 KB) * 3000 calls * 60 minutes * 24 hours * 30 days = 259 GB
- Log With Body: When set to True
Amount of APIM Monitoring data
Kong GW Metrics (Latency, Connections, etc.)
- Cycle: 15s (default)
- Single data amount: 20KB
- Monthly data collection scale: 20KB * 4 (4 times per minute) * 60 minutes * 24 hours * 30 days =3.5 GB