Performance Testing and Regular Maintenance
API Gateway Performance Testing
Checkpoints in Performance Testing
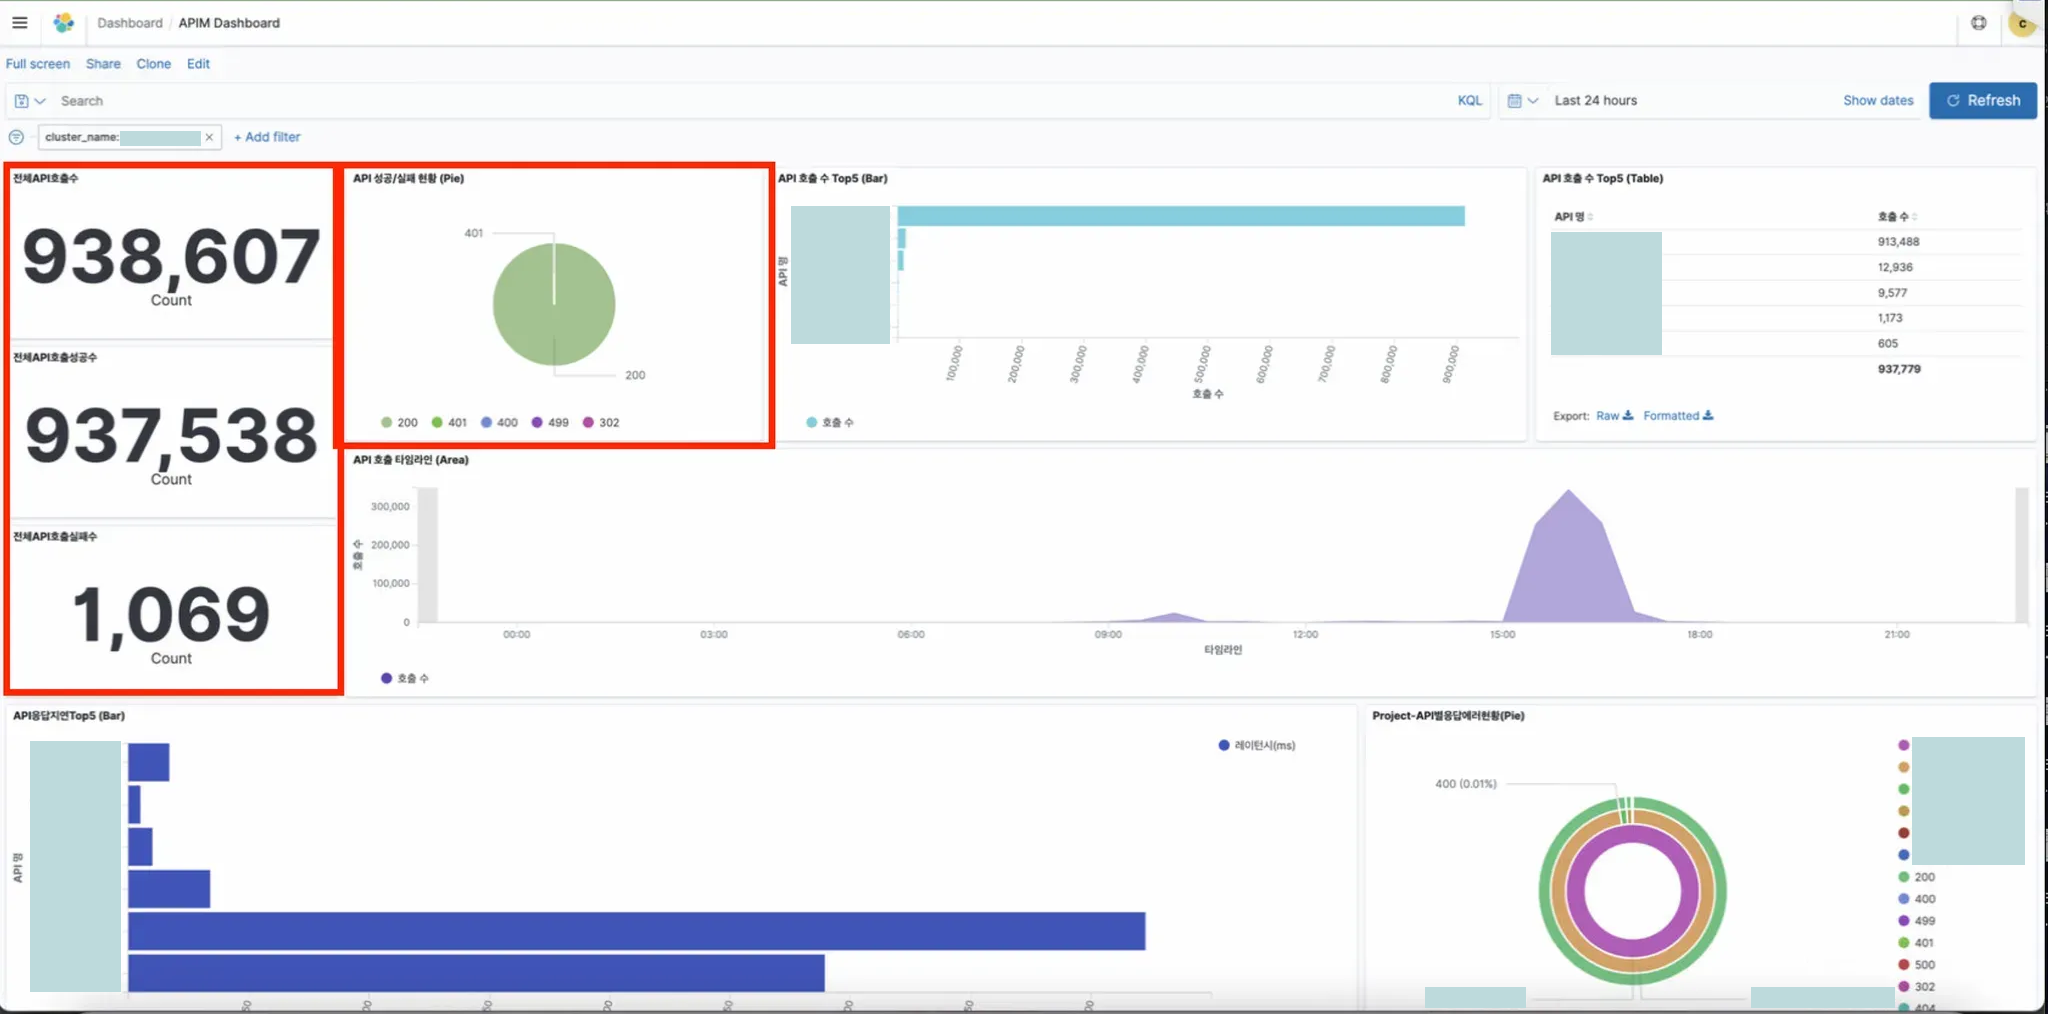
- Total Calls, Total Call Successes, Total Call Failures, Success/Failure Status:
The number of failures may not be fatal errors that occurred in the actual application, such as 401 and 499, so need to check the status code (success/failure status)
- Top 5 API Calls - Bar, Table
You can see the status of the APIs that are mainly called during performance testing.
- Top 5 API Response Delays
- Shows APIs with slow response delays when calling APIs.
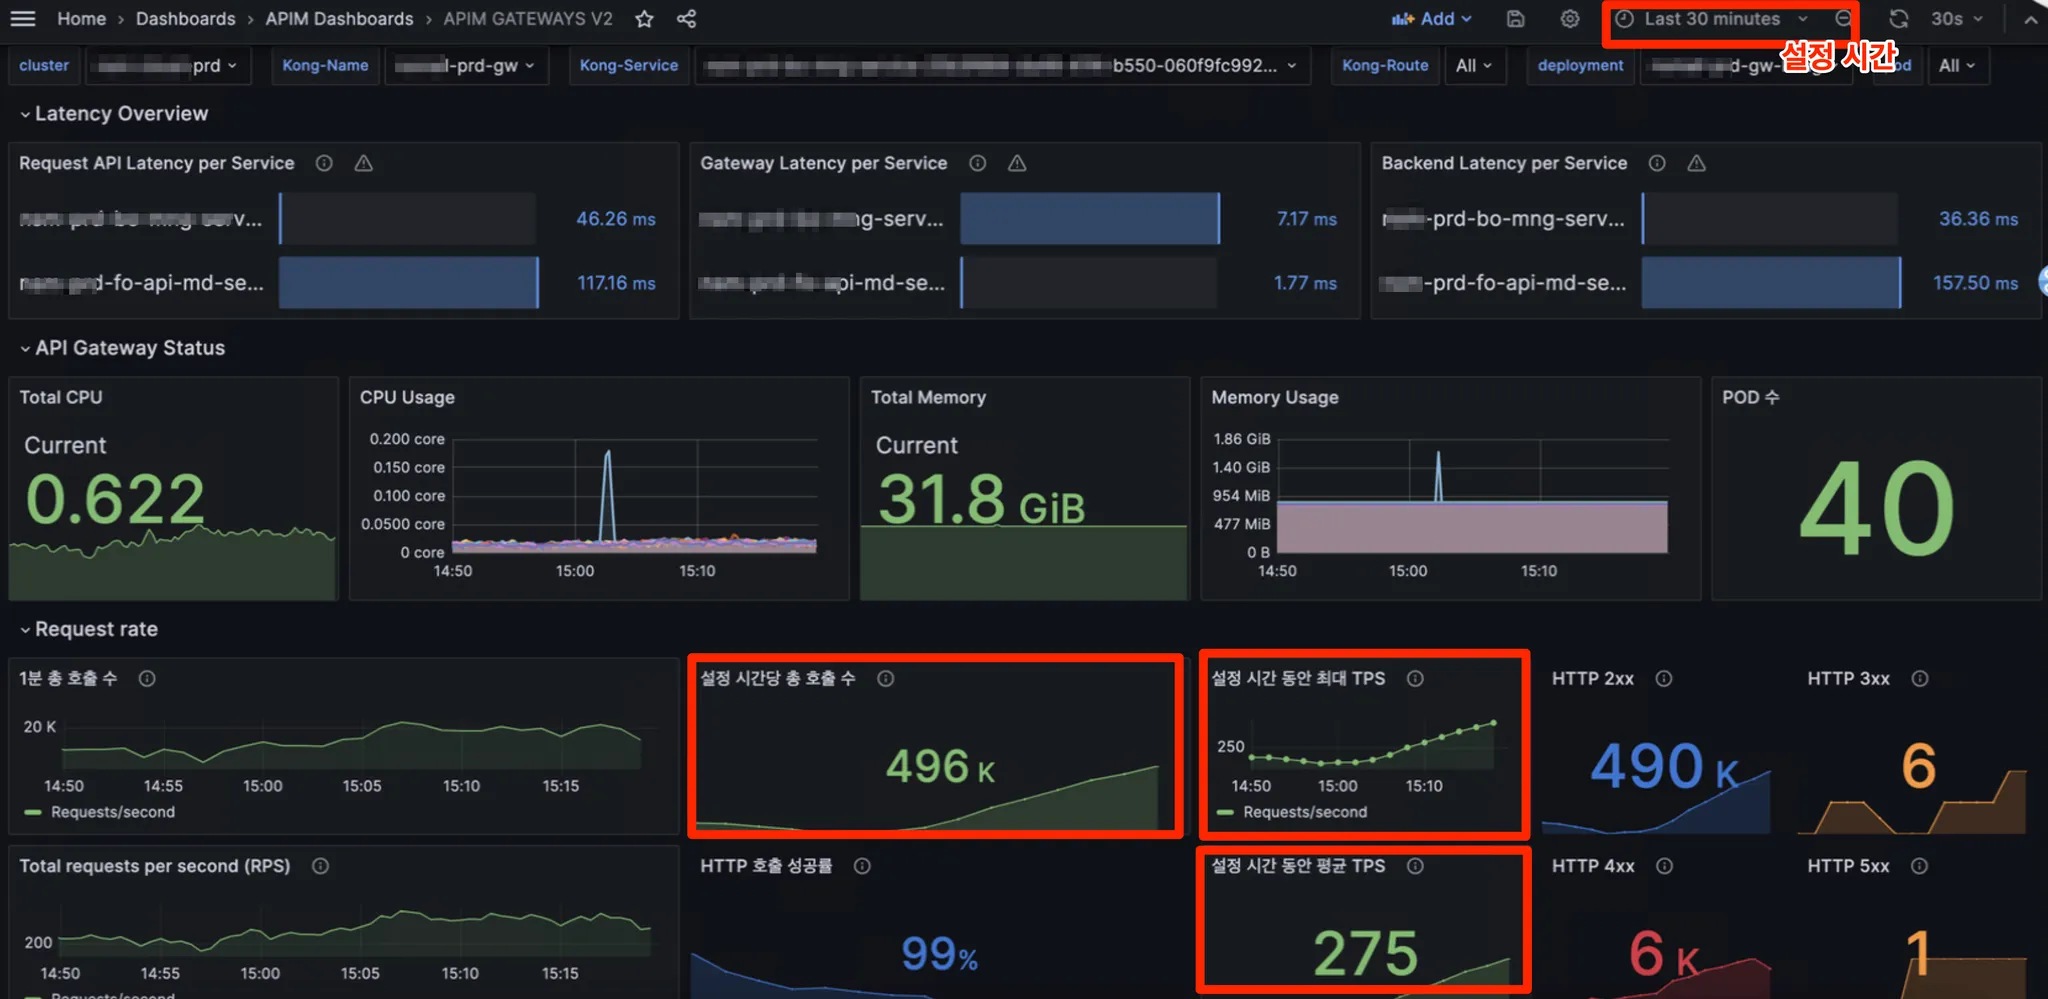
- Gateway Response Delay: Delay caused by Gateway
- Backend response delay: Backend application response delay
- API Response Delay: The result of Gateway Response Delay and Backend Response Delay
- Since all response delay values are measured in milliseconds (ms), a 100ms delay is only0.1 seconds, which is not significantly slow. Generally, a response time around 1000ms (1 second) is considered slow
- We also need to check the specs of Istio running as a sidecar.
Explanation of how performance is measured
- RPS Test: Measurement of requests per second
- Bulk Test: Measurement under conditions where request data size and response data size are configured.
- Delay Test: Measurement of performance in an environment where delay is enforced
- Aging Test: Continuous test for a long time, and measurement of memory leakage, and increases in storage capacity
| Setting | Value | Note |
|---|---|---|
| CPU | 2 Core | 2 worker process |
| Memory | 2 Gib | |
| Replicas | 1 unit | Whether the gateway is redundant |
| Requests per second | 1000 unit | RPS |
| Request data size | 100 KB | Bulk (Request) |
| Response data size | 100 KB | Bulk (Response) |
| Forced response delay | 1 second | Delay |
| Test time | 8 hours | Aging |
Complex Condition (RPS+Bulk+Delay+Aging) Test Results
- Total time taken: 8 hours Aging
- Total requests: 28,800,000 calls
- Successful requests: 28,800,000 calls
- Success/Failure rate: Success 100.0% (Failure 0.0%)
- Average response time: 15ms
Regular Maintenance Checklist
APIM Component Regular Maintenance
- Verify that the APIM Component Pod is running normally
$ kubectl get pods -n {APIM_NAMESPACE}
NAME                                        READY     STATUS     ...
deploy-apim-devlopers-portal-backend         1/1      Running
deploy-apim-devlopers-portal-frontend        1/1      Running
deploy-apim-bff                              1/1      Running
deploy-apim-analysis-manager                 1/1      Running
deploy-apim-gateway-manager                  1/1      Running
deploy-apim-tenant-manager                   1/1      Running
deploy-apim-tenant-manager-console           1/1      Running
deploy-apim-policy-manager                   1/1      Running
apim-mariadb-master-0                        1/1      Running
statefulset-pgauth-0                         1/1      Running
- Check the APIM Component Database Storage capacity
$ kubectl exec -it apim-mariadb-master-0 bash -n {APIM_NAMESPACE}
(mariadb container) $ df -h
...
/dev/nvme8n1    4.9G  451M  4.4G  10% /bitnami/mariadb
...

$ kubectl exec -it statefulset-pgauth-0  bash -n {APIM_NAMESPACE}
(postgresql container) $ df -h
...
/dev/nvme10n1   4.9G  624M  4.3G  13% /pgdata
...
- Console Access
Check the access URL (Verify using Ingress information) - The host names below are examples.
$ kubectl get ingress -n {APIM_NAMESPACE}
NAME                                        HOSTS
deploy-apim-devlopers-portal-backend       apim.sk.com
deploy-apim-devlopers-portal-frontend      apim-tenant.sk.com
deploy-apim-bff                            apim-developers.sk.com
Verify if you can access it properly in a web browser with the above information:
- APIM Console
- Tenant Manager Console
- Developers Portal

API Gateway Regular Maintenance
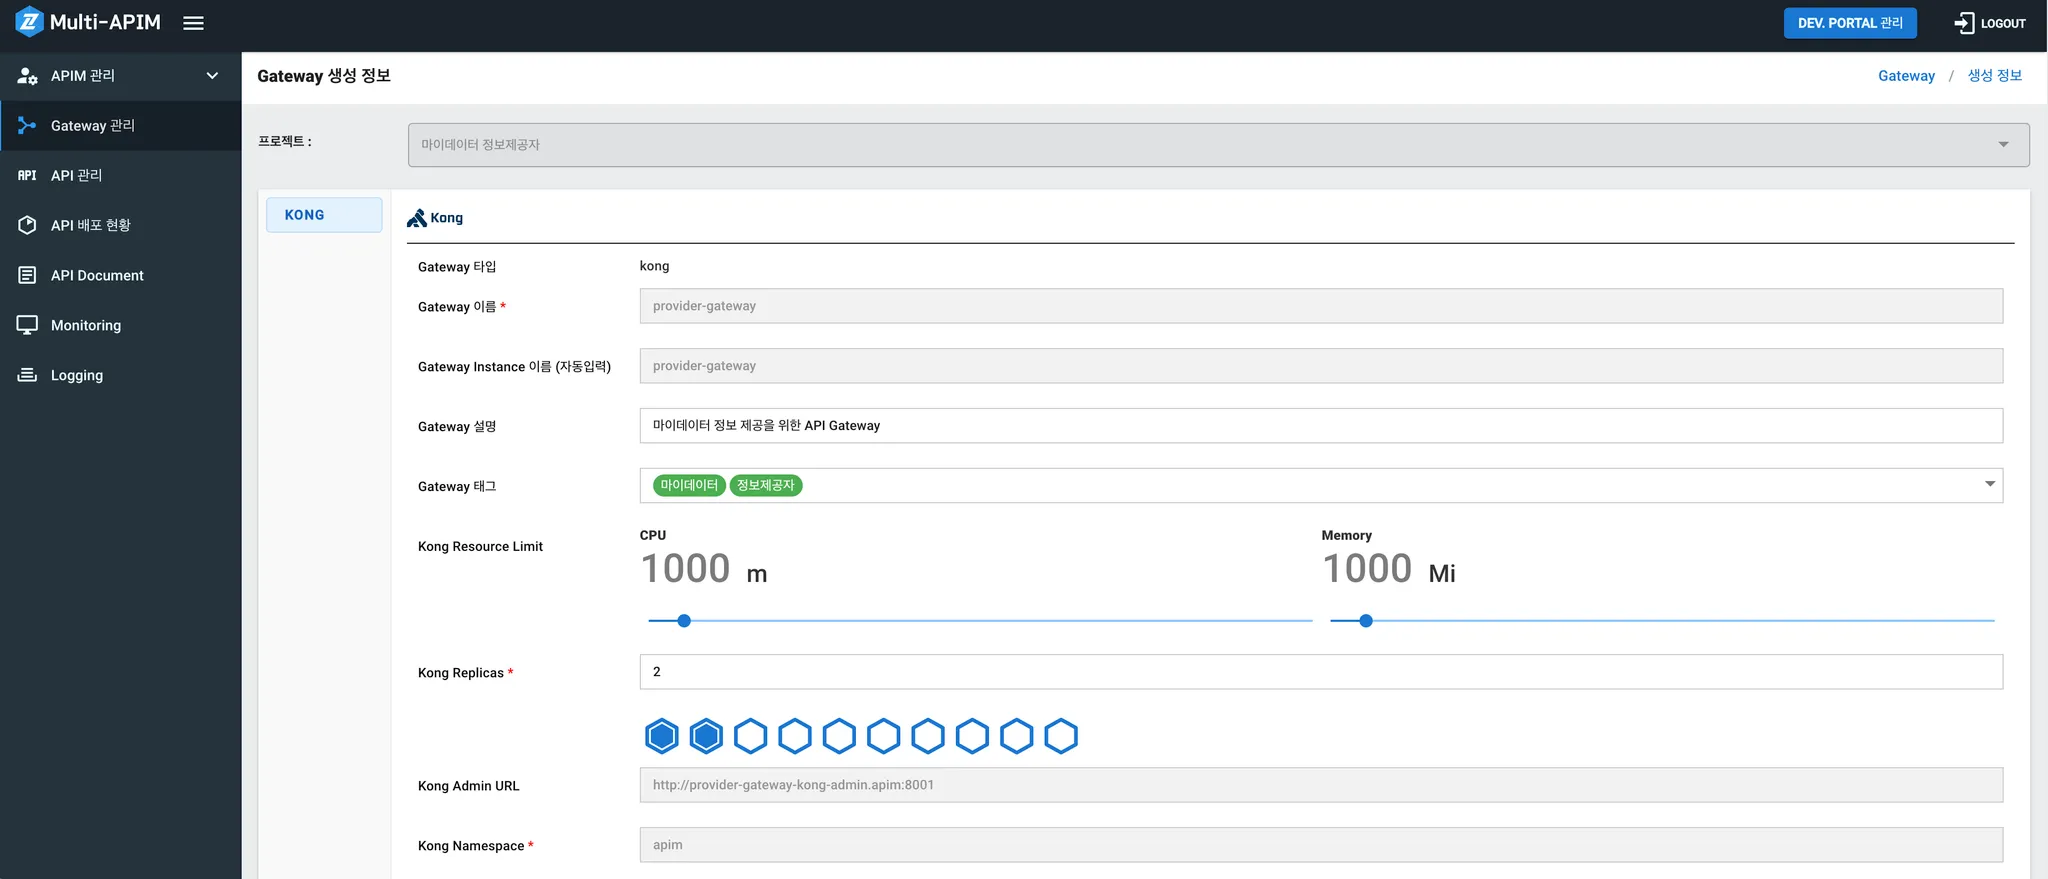
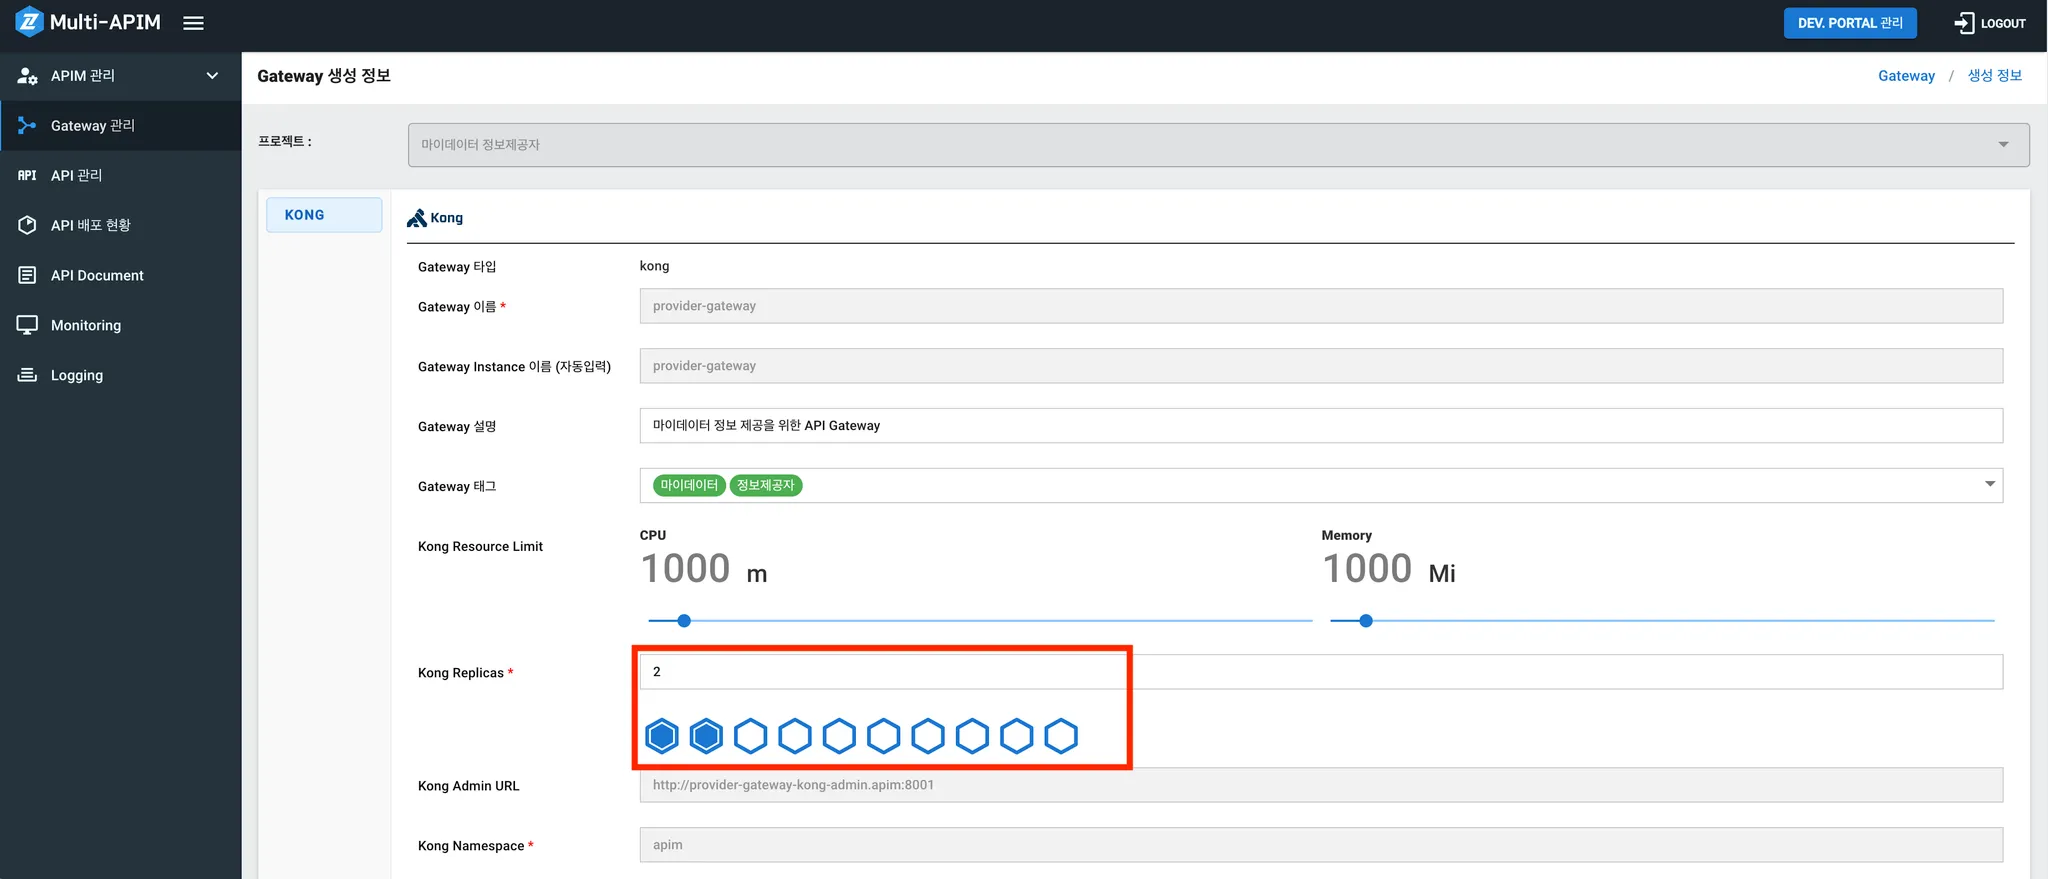
- Access the APIM Console screen and check the Gateway status normally
- APIM Console > Gateway Management > Select Gateway
- Check if the hexagonal shapes are fully filled according to the configured number of Replicas → If there is an issue (e.g., pod pending), the hexagonal shapes will show a spinning animation.
- Verify normal calls through Logging data (Refer to API logging items)
- Kibana > Dashboard > APIM Dashboard
- Check the number of calls and the success/failure status
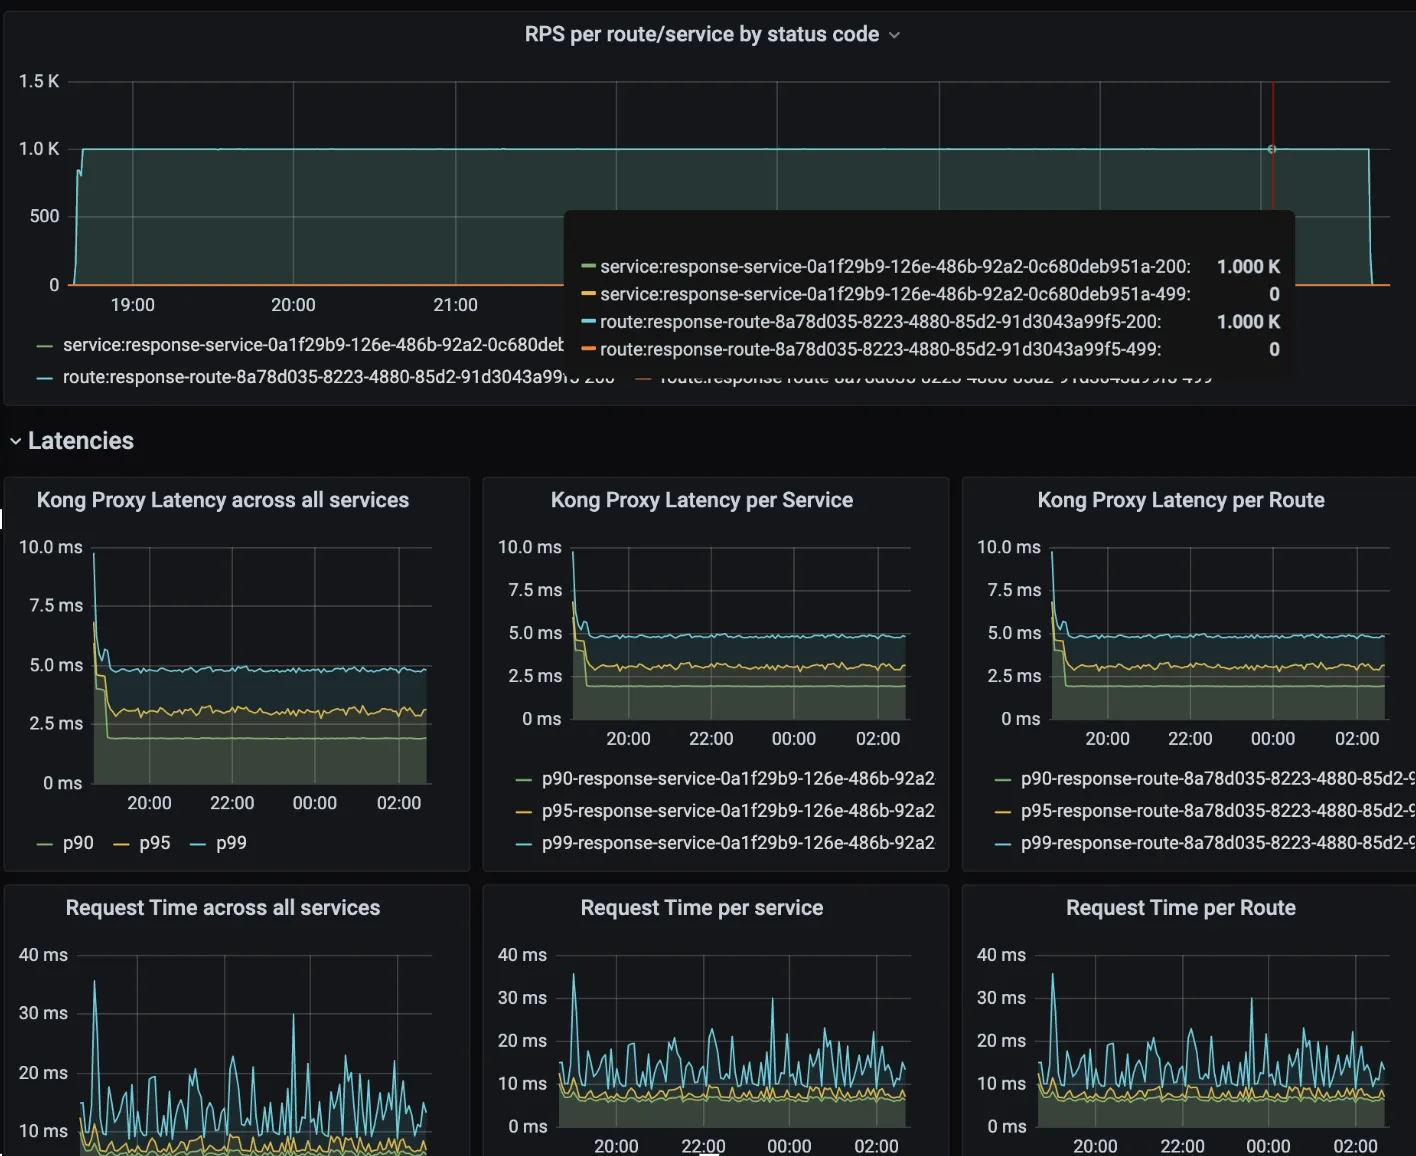
- Check the API Gateway Resources through Monitoring data (Refer to API Gateway monitoring items): Grafana > Dashboards > Browse > APIM Dashboard:
- Dashboard related to API calls
- Check the number of calls per second
- Check API latency
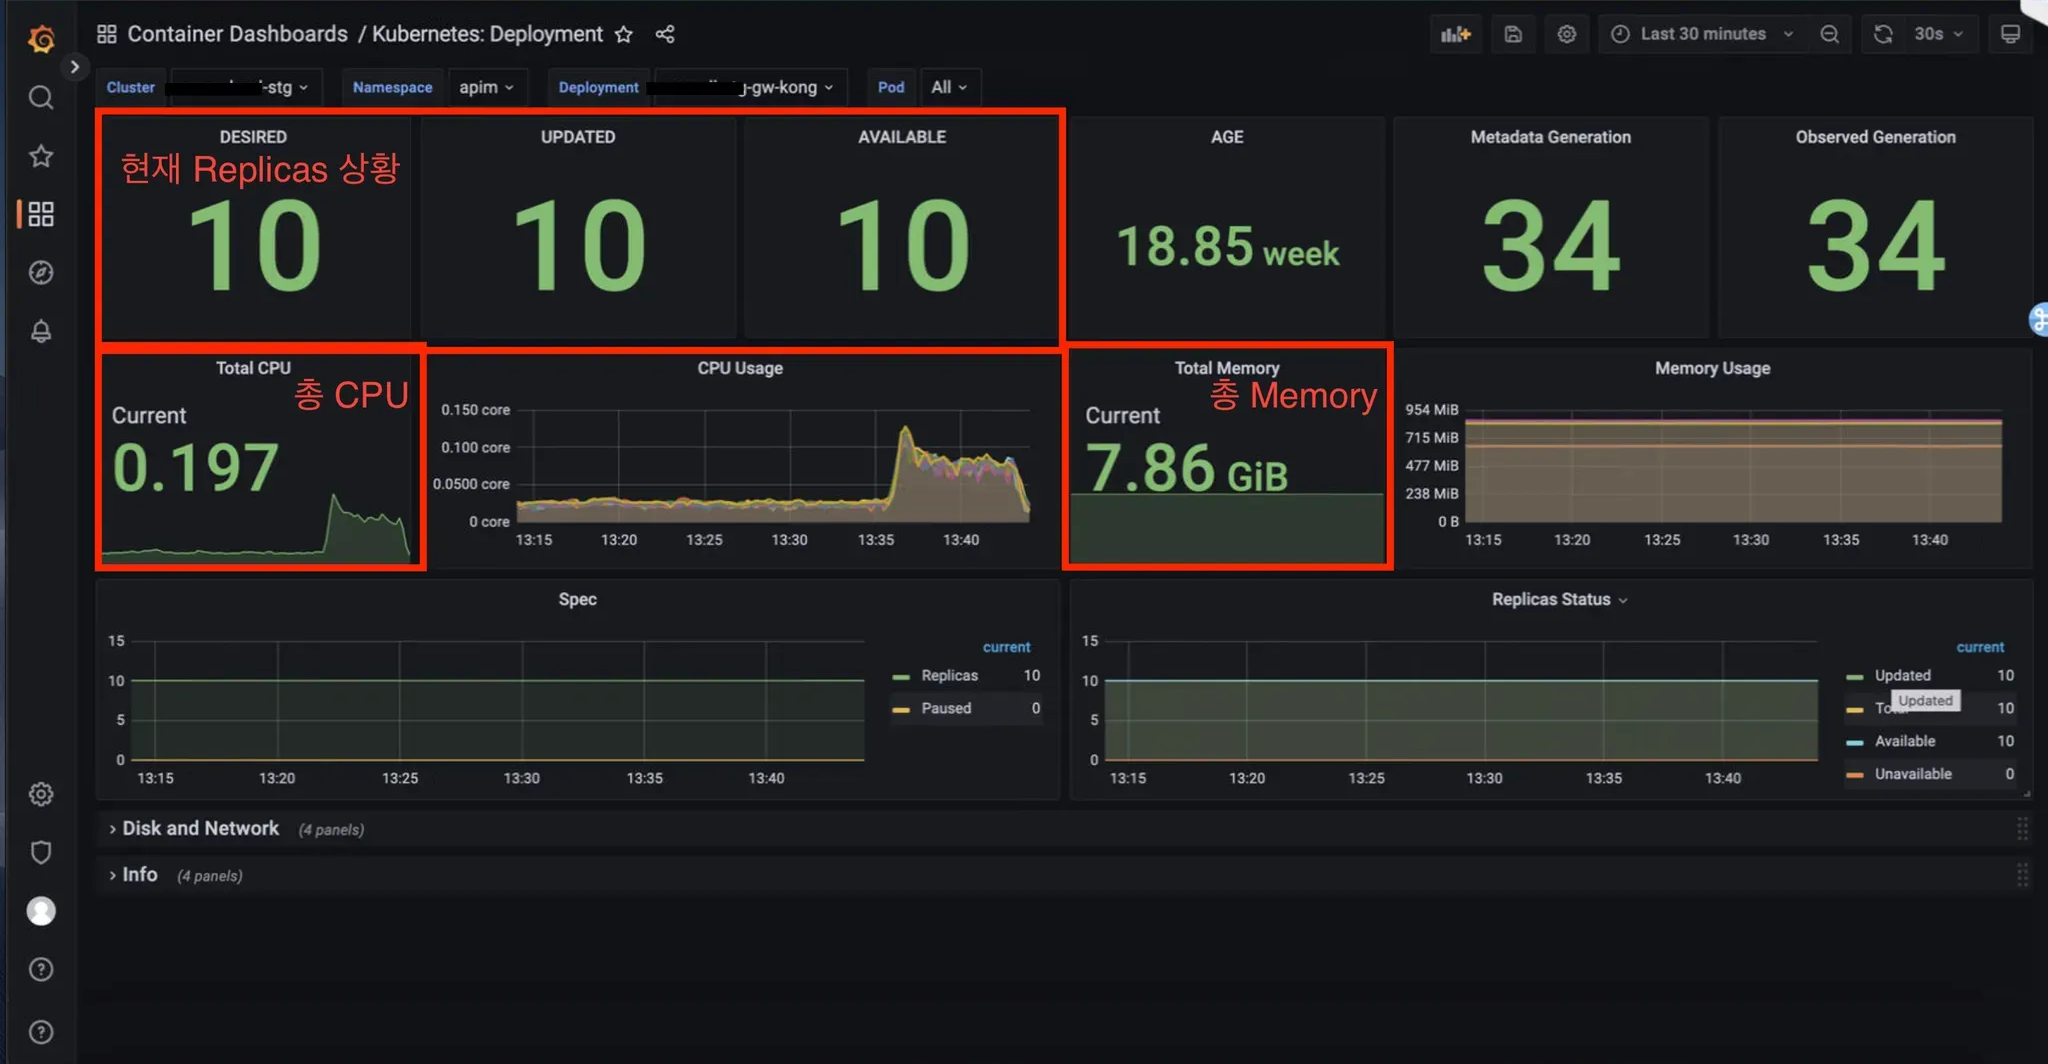
- Grafana > Dashboard Browse > Container Dashboards > Kubernetes: Deployment:
- Check API Gateway Resource
- Check CPU, Memory