Metrics Dashboard
Cloud ZCP 提供强大的监控功能,主要通过平台内的集成仪表板和 Grafana 中更高级的可视化实现。
ZCP 控制台允许具有项目权限的用户检查其项目中容器的信息。除了控制台仪表板中显示的基本资源使用情况外,详细的指标数据通过专用仪表板收集和可视化,主要使用 Grafana。该平台通过 Prometheus Agent 从注册的数据平面集群集中收集所有指标,并将其存储在控制平面集群的中央存储库(Cortex)中。这种架构支持从多个数据平面集群收集和可视化指标,并为基于租户 ID 的多项目环境提供隔离的指标数据空间。
监控仪表板
主要有两种类型的仪表板:
- 项目仪表板:您可以通过 Cloud ZCP 控制台访问此仪表板。
- Grafana 仪表板:您可以在 Grafana 上访问高级监控指标。
项目仪表板
- 在侧边菜单中,选择 Monitoring 以访问项目监控仪表板:

- 项目监控仪表板显示 CPU、内存使用情况、文件系统、网络 I/O、存储使用情况和项目中容器的 Ingress Controller 请求的图形表示。
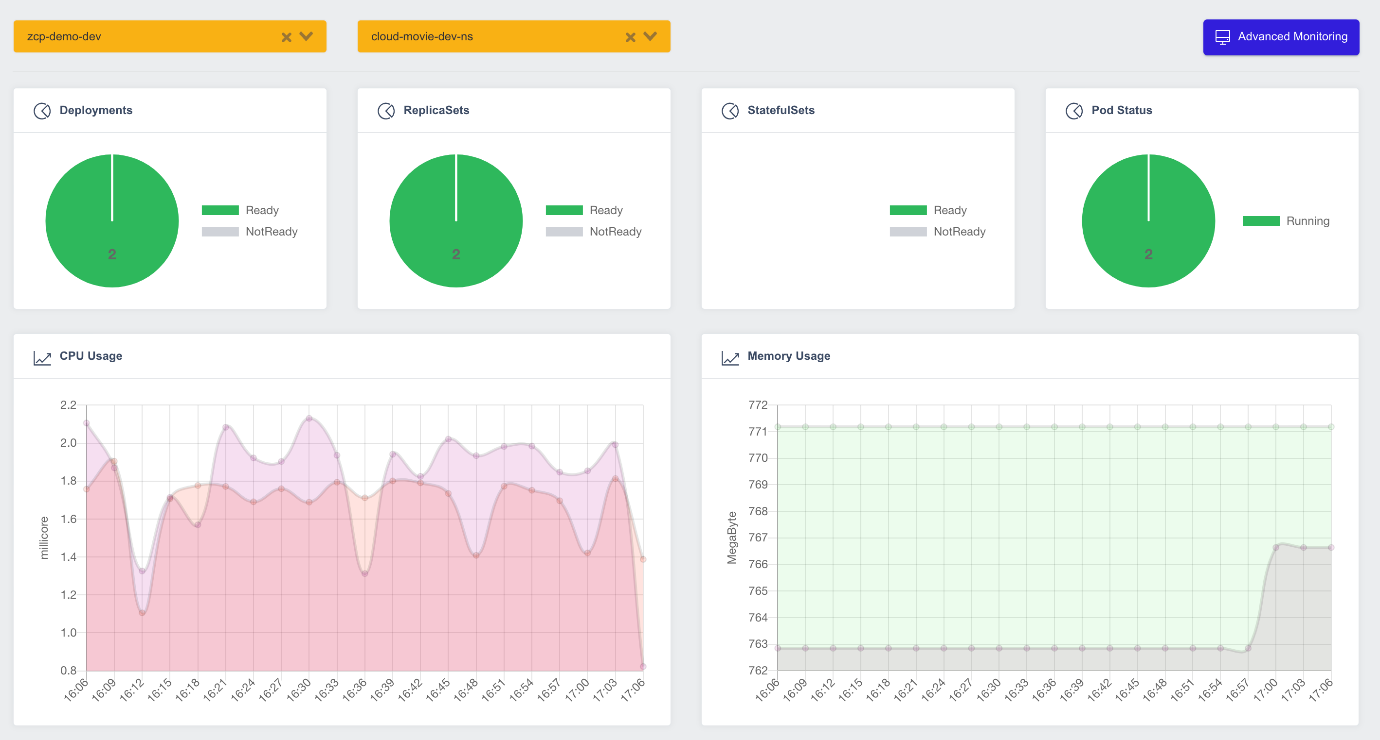
-
它还显示可用/不可用的部署数量、就绪/未就绪的副本集和有状态集,以及按状态(失败、待处理、运行、成功)显示的 Pod 状态。
-
项目用户将看到一个集成仪表板,显示基于其项目中使用的集群和命名空间(由部署组创建)的已部署应用程序的状态。
Grafana 仪表板
要获取更详细的信息和更广泛的仪表板,请单击控制台监控屏幕右上角的 Advanced Monitoring 按钮:
![]()
通过 Web 控制台访问 Grafana 时,您将自动登录。或者,您可以通过其域 URL 直接访问 Grafana,并使用相同的 Cloud ZCP 账户凭据登录。
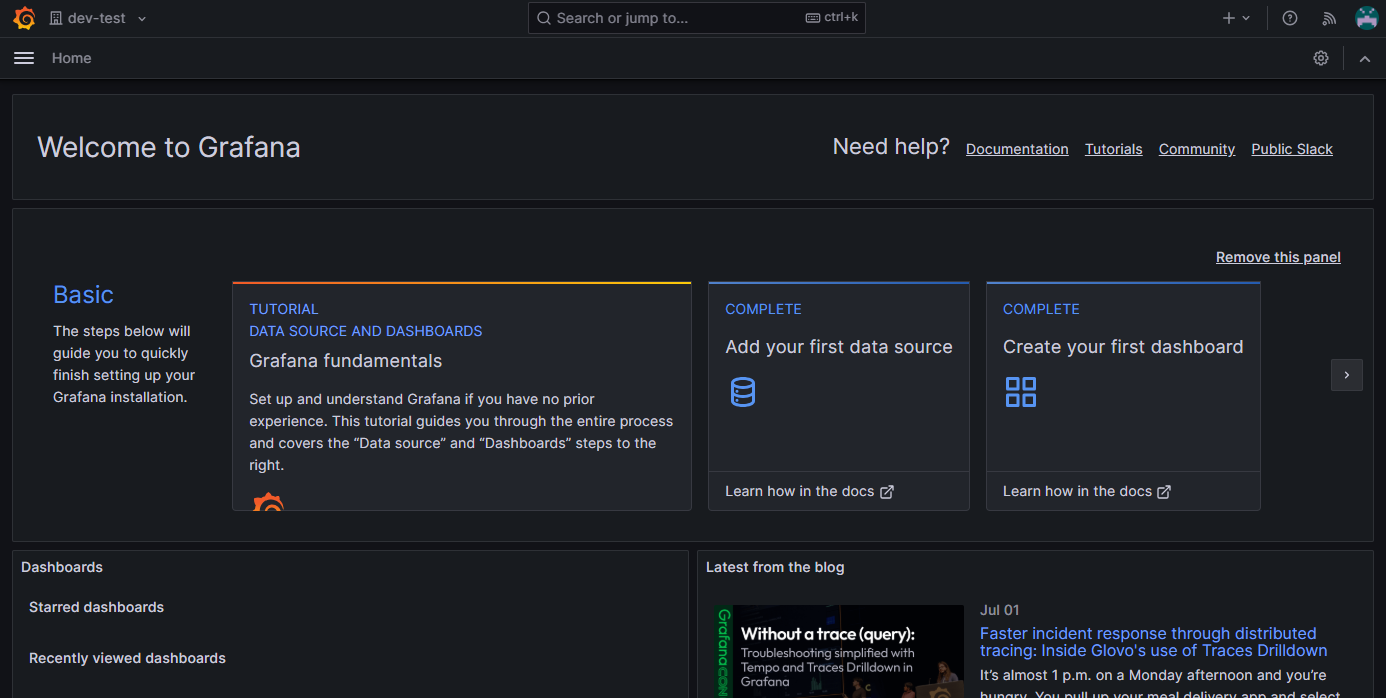
在 Grafana 中,您可以通过仪表板监控收集的指标数据。单击左侧的仪表板图标,然后转到浏览选项卡以查看可用的仪表板。可用的仪表板可能会根据您的权限和组织而有所不同。
有关更多详细信息,请参见 Grafana 监控仪表板 页面。