Overview
The GPU Overview screen enables operators to monitor GPU health across the system, identify GPUs with issues, track active alerts, and quickly navigate to detailed investigation screens. All displayed data is scoped according to the selected Cluster, Node, and Project filters.
Header Section

| Item | Description |
|---|---|
| Infra | Infrastructure monitoring tab for GPU health and issue tracking. |
| Platform | Platform-based GPU monitoring tab. |
| Cluster | Cluster filter. |
| Node | Node filter. |
| Project | Project filter. |
Usage
- Navigate to the GPU Overview menu.
- Select the Infra tab.
- Choose a Cluster, Node, or Project to narrow the monitoring scope if needed.
- The system automatically updates all displayed data based on the selected filters.
Metric Cards

The metric cards provide a quick summary of GPU health and status across the selected scope.
- The currently selected card is highlighted to indicate that its filter is active.
- The Serving card is informational only and does not function as a data filter.
| Card | Description |
|---|---|
| Total GPU | Total number of Full GPUs. |
| Issue GPU | Total number of GPUs currently experiencing issues. |
| Software | Number of GPUs with software-related issues. |
| Hardware | Number of GPUs with hardware-related issues. |
| Serving | Number of workloads currently affected by SLO alerts. |
| Function | User Action | Expected Result |
|---|---|---|
| View All GPUs | Click the Total GPU card. | The system displays all GPUs within the current scope and removes any active status-based filters. |
| View Issue GPUs | Click the Issue GPU card. | The system displays only GPUs that are currently identified as Issue GPUs. The Data Center View and GPU List are filtered accordingly. |
| View Software Issues | Click the Software card. | The system displays only GPUs with alerts classified as software-related issues. The Data Center View and GPU List are filtered accordingly. |
| View Hardware Issues | Click the Hardware card. | The system displays only GPUs with alerts classified as hardware-related issues. The Data Center View and GPU List are filtered accordingly. |
Data Center View
The Data Center View provides a visual representation of the physical GPU layout within the data center, helping operators quickly identify affected racks or GPUs.
- GPU information is refreshed automatically every 3 seconds.
- Hover over a GPU to quickly view current telemetry metrics:
- GPU Status
- SM Activity
- Temperature
- Power Consumption
- VRAM Usage
- Workload Information (if available)
Switch View Mode
The Data Center View supports two display modes: Floor and Rack:
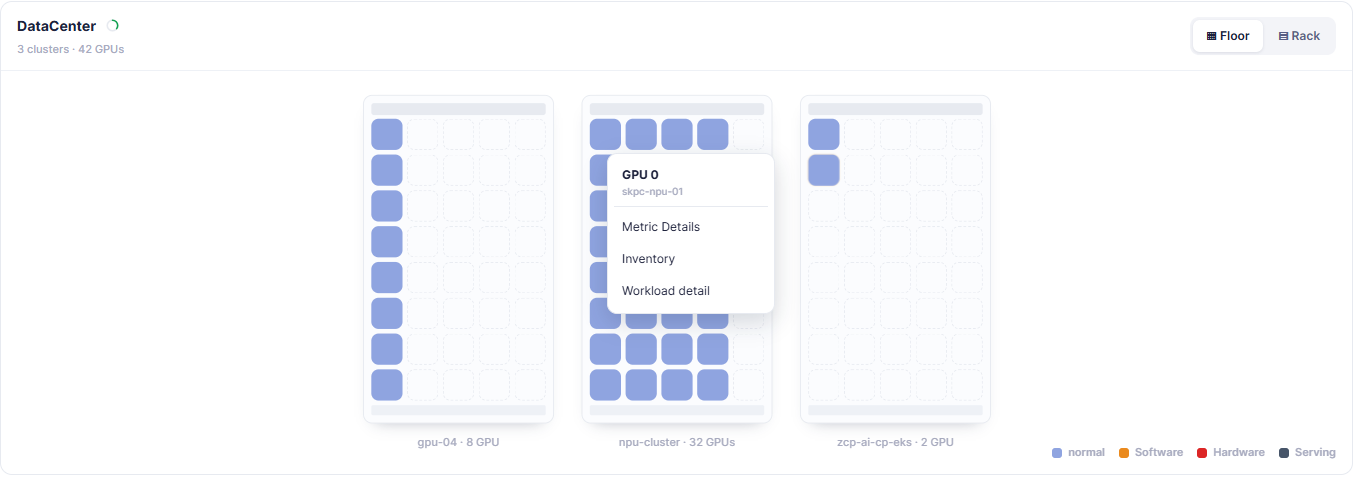
- Floor View is used for an overall infrastructure view.
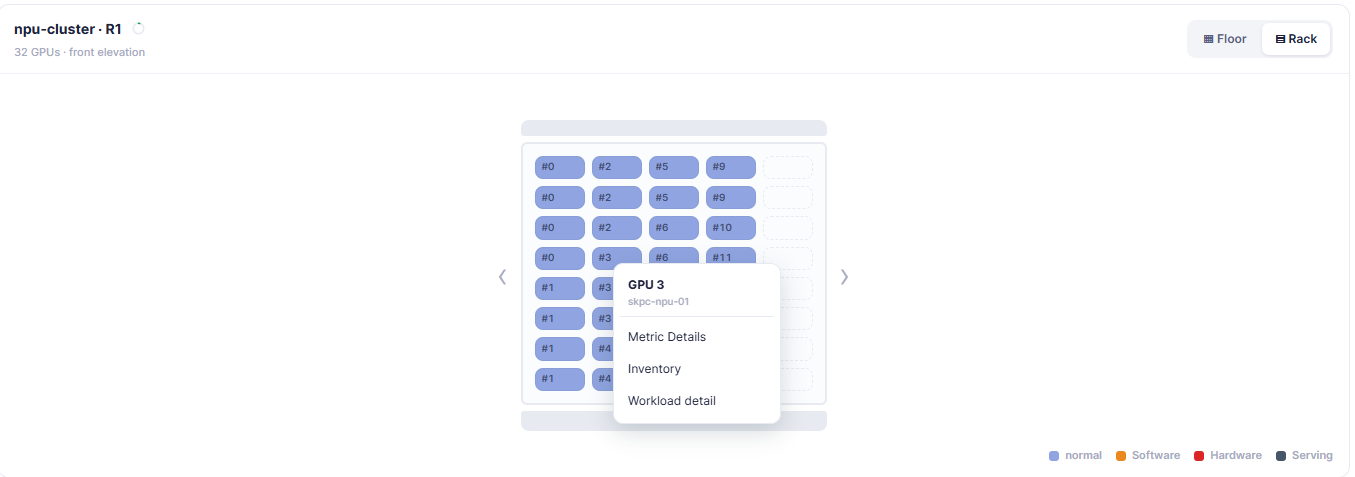
- Rack View is used for detailed GPU-level investigation.
- Switching between Floor and Rack views does not affect the currently applied filters or displayed data.
Observe the GPU color in the Data Center View, then compare it with the Color Legend at the bottom of the screen to quickly identify the type of issue affecting the GPU.
| View | Purpose | Description |
|---|---|---|
| Floor | Displays the list of racks within the selected scope. | • Floor View is the default display mode. • Click Floor to display all racks within the selected scope. • Each rack shows its rack name, total GPU count, and GPU status through color-coded GPU blocks. • Hover over a GPU block to view related GPU information or alert details (if available). • Click a GPU block to display GPU information and available actions, then select Metric Details, Inventory, or Workload Detail (if available) to navigate to the corresponding screen. • Use Floor View to quickly identify abnormal racks or GPUs before performing detailed investigation. |
| Rack | Displays the detailed layout of GPUs inside a specific rack. | • Rack View is designed for in-depth GPU investigation. • Click Rack to switch from Floor View to Rack View. • The Data Center title is replaced with the selected rack name (for example, gpu-04 - R0), along with the total number of GPUs in the rack. • Each GPU is displayed as a numbered GPU Block (#0, #1, #2, ...) representing its physical position within the rack. • GPU status is indicated by color according to the Color Legend. • Hover over a GPU Block to view related GPU information or alert details (if available). • Click a GPU Block to view GPU information and available actions, then select Metric Details, Inventory, or Workload Detail (if available) to navigate to the corresponding screen. • Use the Previous and Next navigation buttons to move between racks without returning to Floor View. |
Notes
- The colors represent the GPU status across the entire screen.

| Color | Meaning |
|---|---|
| Blue | Normal |
| Orange | Software Issue |
| Red | Hardware Issue |
| Dark Blue | Serving Issue |
Critical Alerts
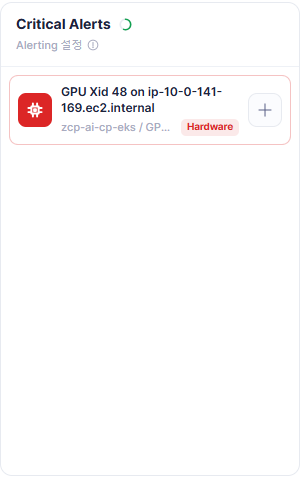
- Critical Alerts displays all currently open alerts.
| Item | Description |
|---|---|
| Alert Message | Alert message and issue summary |
| Responsibility | Issue ownership classification (Software or Hardware) |
| Alert Detail | Link to the alert details page |
- Alert data is refreshed automatically every 10 seconds.
View Alert Detail
- Locate the alert you want to investigate.
- Click the + button on the right side of the alert.
- The system navigates to the Alert Detail screen.
Open Alert Rule Configuration

- Click the Alerting Setting link above the alert list.
→ The system navigates to the Alert Rule Configuration screen.
Notes
- Alerts are displayed in descending order based on the most recent update.
- If no open alerts exist, the system displays "No Critical Alerts".
GPU List
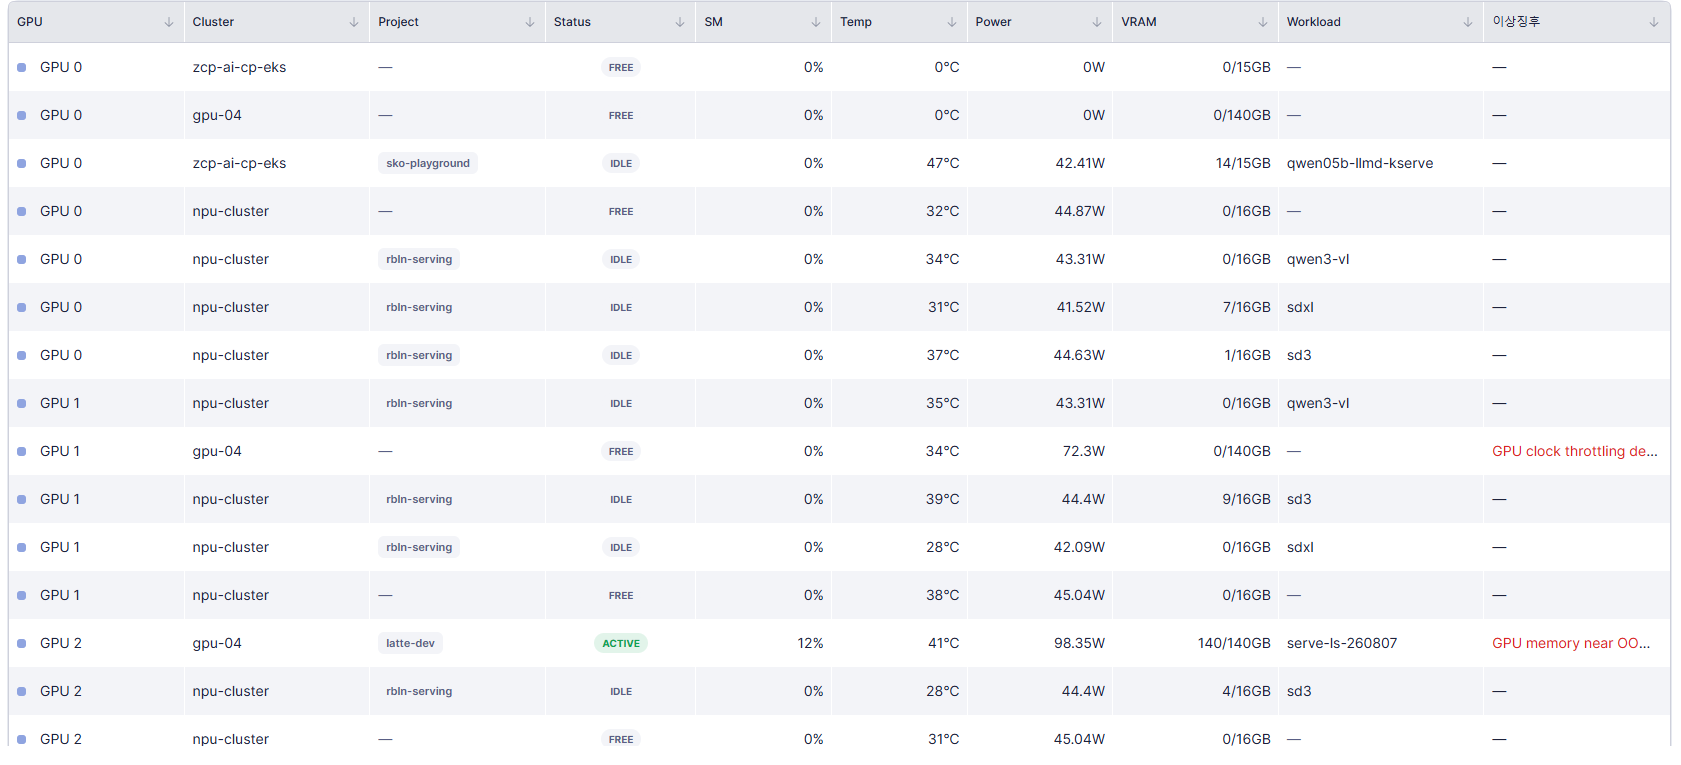
This section displays all GPUs within the current scope, along with their operational status and any detected abnormalities.
| Column | Description |
|---|---|
| GPU | GPU name or index |
| Cluster | Cluster hosting the GPU |
| Project | Project currently using the GPU |
| Status | Current GPU status |
| SM | GPU Utilization (%) |
| Temp | GPU temperature |
| Power | Current power consumption |
| VRAM | Current VRAM usage |
| Workload | Workload assigned to the GPU |
| Symptom | Reason why the GPU is flagged as abnormal |
View GPU Information
- Scroll to the GPU List section.
- Review the information for each GPU.
- Check the Status column to identify whether the GPU is FREE, IDLE, or in another state.
- Check Temp, Power, and VRAM to evaluate the GPU's operating condition.
- Check Workload to identify which workload is currently using the GPU.
- Check Symptom to determine the cause of any abnormal behavior.
Common Symptoms
| Symptom | Meaning |
|---|---|
| GPU XID errors detected | GPU XID errors have been detected. |
| GPU memory near OOM | GPU memory usage is approaching the out-of-memory threshold. |
| GPU clock throttling detected | GPU clock frequency has been throttled due to system conditions. |