Overview - NPU Platform
Overview
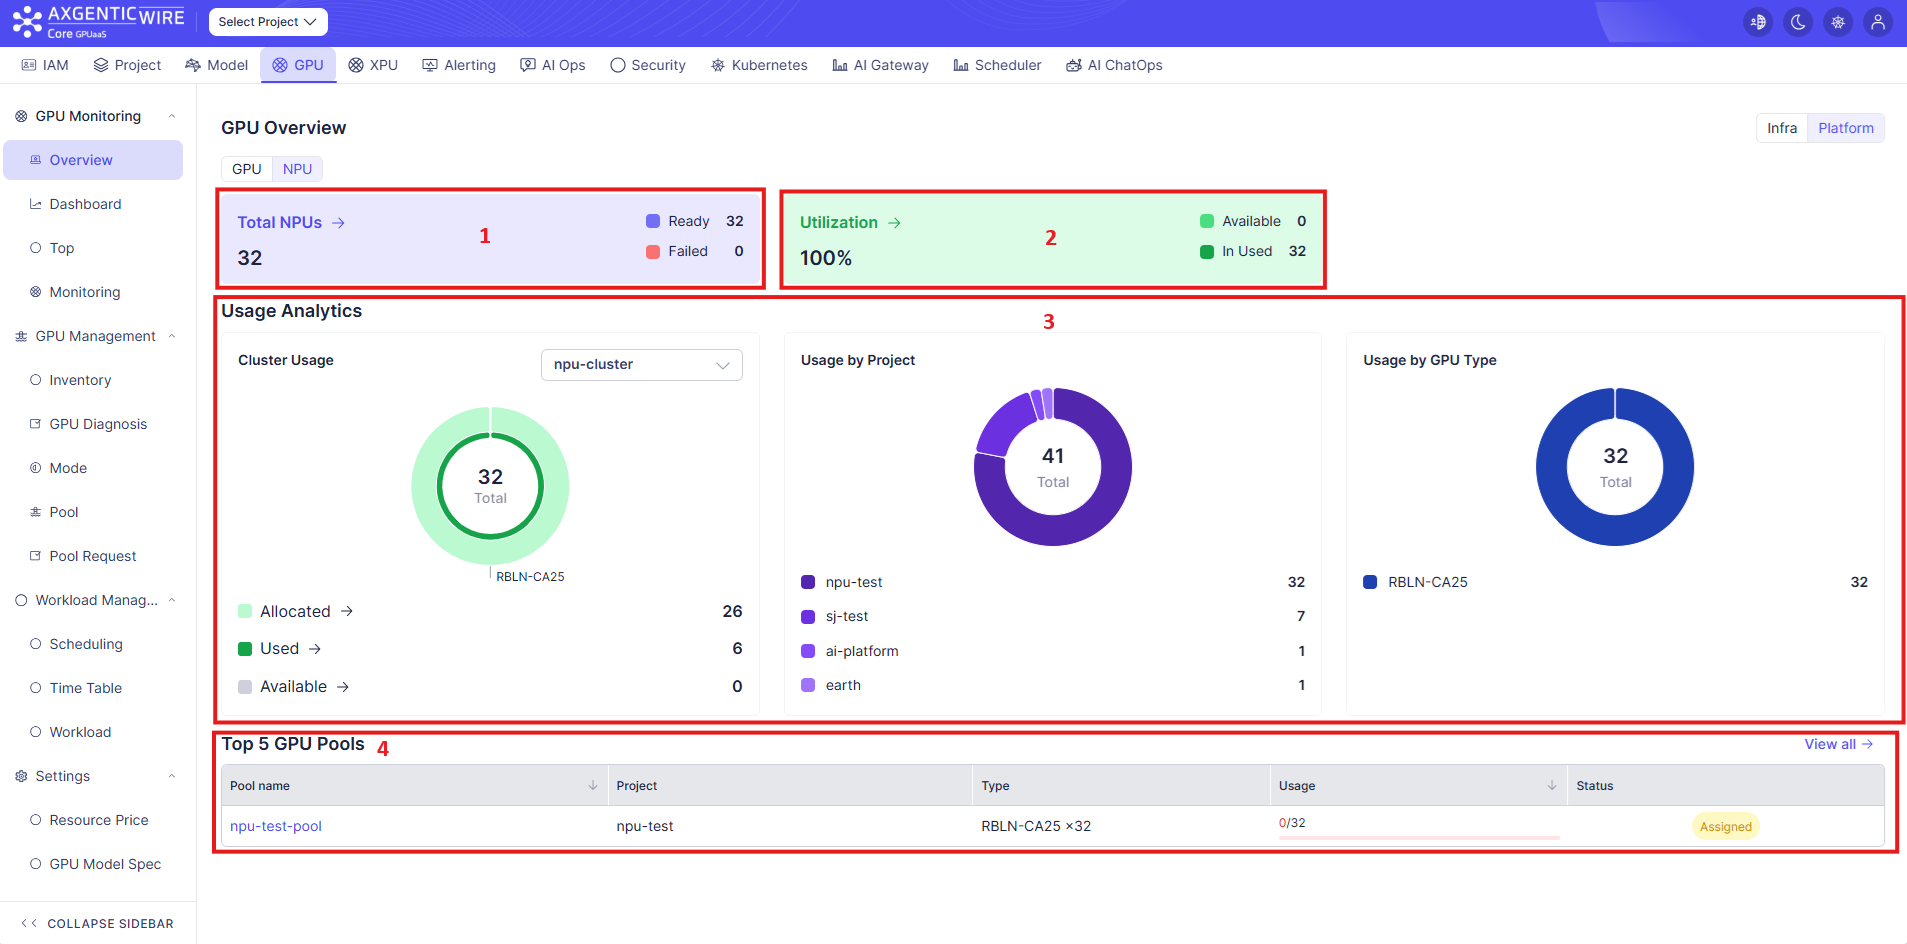
The NPU Dashboard is the main page for system administrators to monitor and manage Neural Processing Unit (NPU) resources in the computing infrastructure. It provides real-time visualizations of NPU allocation, utilization, and project-specific consumption using cards, charts, and tables. The dashboard complements the GPU Dashboard, offering unified resource monitoring across both compute accelerators.
Accessing the NPU Dashboard
Quick steps to open NPU Dashboard:
- Click GPU on the top bar.
- On tab Overview, click Platform on the top right corner.
- Then click NPU.
1. Total NPUs Card
- Purpose: Display the total number of NPU resources registered in the system and their operational status.
- Displayed information:
- Total NPUs: Total number of NPU accelerators across all clusters.
- NPU count by status: Breakdown of operational status Ready, Failed.
- Action: Clicking the Total NPU label navigates to the GPU Pools Management page for detailed resource inventory and pool administration.
-
Status Definitions:
- Ready: NPU is operational and available for task allocation.
- Failed: NPU has detected a fault and requires investigation.
2. Card Utilization
- Purpose: Display real-time NPU utilization (%) across the infrastructure, segmented by allocation state.
- Displayed information:
- Utilization: Percentage of total NPU capacity currently in active use. Utilization = (In Used / Total NPUs) × 100%.
- Available: Number of NPUs ready for new workload allocation.
- In Used: Number of NPUs currently executing workloads.
- Action: Clicking the Utilization label navigates to the GPU Capacity Management page for deeper analysis of usage trends and forecasting.
Note: NPU workload patterns often differ from GPUs due to inference vs. training model splits. Monitor separately for accurate capacity planning.
3. Usage Analytics Charts
3.1 Cluster Usage Chart
- Purpose: Visualize NPU resource allocation and utilization across clusters using a donut chart, providing instant insights into cluster-level resource distribution.
- Display information:
- Total: Total NPU count for the selected cluster.
- Used: NPUs actively executing workloads.
- Allocated: NPUs assigned to pools but not yet in use.
- Available: NPUs unassigned and available for new pool creation.
- Cluster Filter: Dropdown selector to view statistics for a specific cluster.
- Use cases:
- Compare allocation vs. utilization across different clusters.
- Identify clusters with high availability to direct new workloads.
- Spot clusters with allocation imbalances (high allocation, low utilization).
- Support capacity planning and workload distribution decisions.
- Interpretation logic:
- Used: NPUs actively processing workloads (from runtime metrics).
- Allocated: Assigned to pools but idle (difference between pool allocation and active use).
- Available: Not yet allocated (total - allocated - used).
- Chart slice size reflects actual resource counts, not percentages.
NPU-specific considerations: Unlike GPUs, NPUs typically run inference workloads with variable batch sizes. Monitor the Used/Allocated ratio to identify underutilized pools or opportunities for workload consolidation.
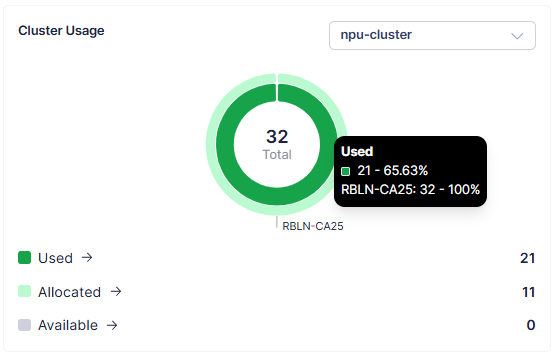
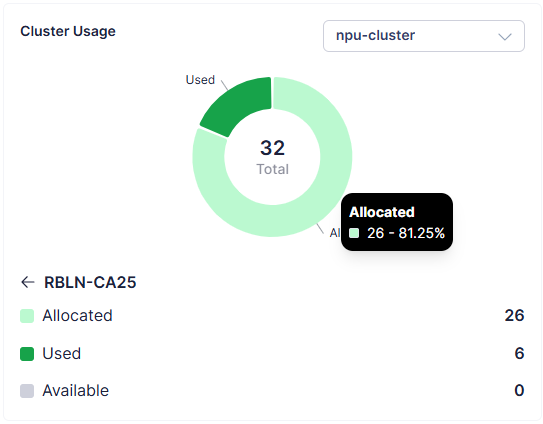
- Actions: When you hover over a colored segment in the donut chart, the tooltip displays information as below:
- Segment Name (e.g., "Used", "Allocated", "Available")
- Count of NPUs in that state - and the percentage
- Hardware Spec (e.g., "RBLN-CA25")
- Total number of NPUs in that state and percentage of total cluster capacity
You can also click on the chart area to switch between multi-ring donut chart and simple donut chart viewing mode.
3.2 Usage by Project Chart
- Purpose: Visualize NPU consumption across projects, showing which teams consume the most resources.
- Display information:
- Top 5 projects displayed with individual NPU counts in active use.
- Remaining projects grouped under Other category.
- Total: Aggregated NPU count across all projects.
- Use cases:
- Monitor which projects dominate resource consumption.
- Identify resource concentration and potential cost drivers.
- Track project-specific demand trends over time.
- Support chargeback and billing analysis.
- Interpretation logic: Slice size proportional to NPU count in use per project.
The Other category cannot be expanded in the chart. Use the NPU Pools page or Pending Requests table to view detailed per-project breakdowns.
- Actions:
- Click on each project row to hide/unhide it from the donut chart.
- Hover over each colored segment to see project name and number of NPUs count in active use.
3.3 Usage by NPU Type Chart
- Purpose: Illustrate resource utilization by NPU hardware specification (model, generation, etc.), enabling hardware-level consumption tracking.
- Display information:
- Top 5 NPU types shown individually with active usage count.
- Remaining types grouped under Other.
- Total: Aggregated NPU count across all types.
- Use cases:
- Identify which NPU models are most heavily utilized.
- Detect hardware-specific bottlenecks or saturation.
- Analyze trends to inform procurement and upgrade decisions.
- Support performance optimization by workload-to-hardware matching.
- Interpretation logic: Slice size proportional to active NPU count per hardware type.
- Actions: Hover over each colored segment to view a tooltip showing type name and total number of active NPUs of that type.
4. Top 5 NPU Pools Table
- Purpose: Provide a real-time overview of the main NPU resource pools, highlighting allocation status, utilization, and project assignments to support effective resource stewardship.
- Display information:
- Pool Name: Unique identifier for the NPU pool, clickable link to the pool's detail page.
- Project: Assigned project name; displays Unassigned if no project has been assigned.
- Type: NPU hardware specification and count (e.g., "RBLN-CA25 ×32", "RBLN-CA50 ×16")
- Usage: Shows Used/Total capacity (e.g., "0/32", "16/32"), visualized with a progress bar.
- Status: Operational and assignment status.
- Assigned (yellow) — pool is owned by a project.
- Unassigned (green) — no project owner, free for allocation.
- Supporting Behaviors:
- Sorting: Click column headers to sort by Pool Name or Usage percentage.
- View All: Access the NPU pool inventory and management interface.
- Progress Bar Colors:
- Green: Low usage (<33% capacity utilized).
- Yellow: Medium usage (33–66% capacity utilized).
- Red: High usage (>66% capacity utilized).
- Use cases:
- Quickly review the operational status and utilization of key pools.
- Identify unassigned pools available for new project allocation.
- Spot over-utilized pools that may benefit from workload rebalancing.
- Monitor pool health and plan maintenance windows if needed.