Log Lifecycle
Cloud ZCP provides comprehensive logging capabilities to monitor and manage your applications and the platform itself. The logging system is based on the OpenSearch Stack (OpenSearch, Fluentd, OpenSearch DashBoards). Understanding the log lifecycle involves how logs are collected, processed, stored, queried, and managed over time.
The platform manages several types of logs, including Application Logs and Audit Logs.
Log Collection
Log collection in Cloud ZCP involves gathering logs from various sources across the platform:
- Application Logs: Fluent-bit components are installed as Daemonsets on each node of the Data Plane Cluster specifically for log collection from running containers. Fluent-bit collects logs from user application containers and all system components running on each node.
- Audit Logs: Audit Logs manage three types of logs: Console, Kubernetes, and Keycloak. You can configure settings for collecting these logs. For Kubernetes logs, you need to select the managed clusters and configure settings for each cluster individually.
Log Processing
Once collected, logs undergo processing before storage:
- Data Plane Processing: FluentD is installed on Data Plane Clusters to process and send the collected logs to the Control Plane Cluster. This FluentD performs preliminary processing.
- Control Plane Processing: An additional FluentD is deployed in the Control Plane Cluster to organize the log pipeline between the Data Plane Cluster and the Control Plane Cluster. This FluentD performs secondary processing of logs passed from FluentD in the Data Plane before they are stored in Opensearch.
- Integrated Management: OpenSearch is applied to manage logs of all Data Plane Clusters registered in the Container Management Service in an integrated manner.
Log Storage
Processed logs are centralized for storage and management:
- Centralized Storage: All logs are stored in Opensearch central storage in the Control Plane Cluster.
- Deployment: Opensearch is deployed on three worker nodes dedicated to logging within the Control Plane Cluster to provide high availability.
- Integrated Management: OpenSearch is applied to manage logs of all Data Plane Clusters registered in the Container Management Service in an integrated manner.
- Indexing Strategy: Log storage indexes are created per project. Logs transmitted from Fluent-bit in the Data Plane are indexed in the format
[Realm].[Project-Name].[Cluster-Name]-%Y.%m.%d. This indexing format supports isolating and storing each project's logs in a separate index, supporting the security feature for multi-project log data.
Log Querying and Visualization
Accessing and analyzing stored logs is done primarily through OpenSearch Dashboards, which you access via the Logging menu in the ZCP Console.
- Discover: This is the main screen for querying and viewing logs. You can use search terms or filters to narrow down logs within a specified time range.
- Dashboard: Allows viewing multiple visualizations and information panels simultaneously.
- Visualize: Enables creating various visualizations (like charts, tables, metrics) from log data.
- Dev Tools: Provides an interface to call OpenSearch Rest APIs.
- Audit Log Viewing: Collected audit logs can be viewed. You can filter these logs by Event source (Console, Keycloak, Kubernetes) and by date range. Detailed audit logs, including payload information (if enabled during collection), can be viewed for individual entries.
Log Management and Retention
Managing the volume and retention of log data is crucial.
Index Management
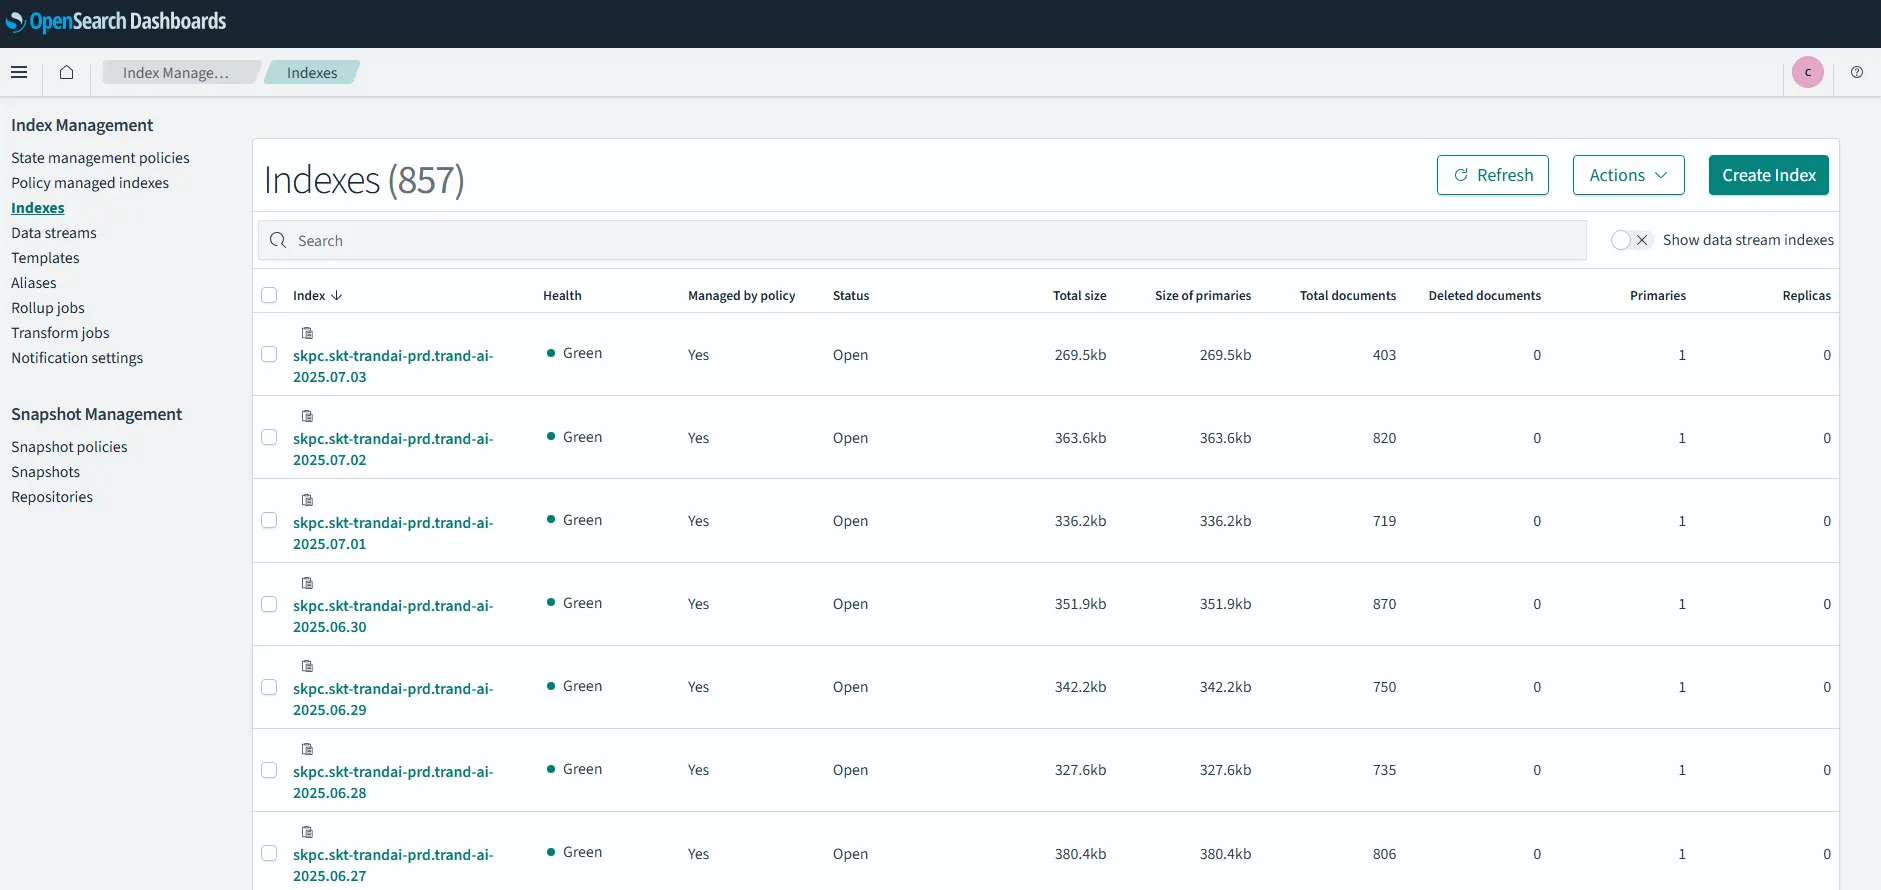
OpenSearch Dashboards provides an Index Management screen with menus to manage indexes. You can create, modify, and delete policies that manage indexes (Index Policies). You can also view saved indexes and apply policies to them.
Stack Management
Stack Management: The Stack Management screen includes menus to manage OpenSearch Dashboard's settings, including Index Patterns.
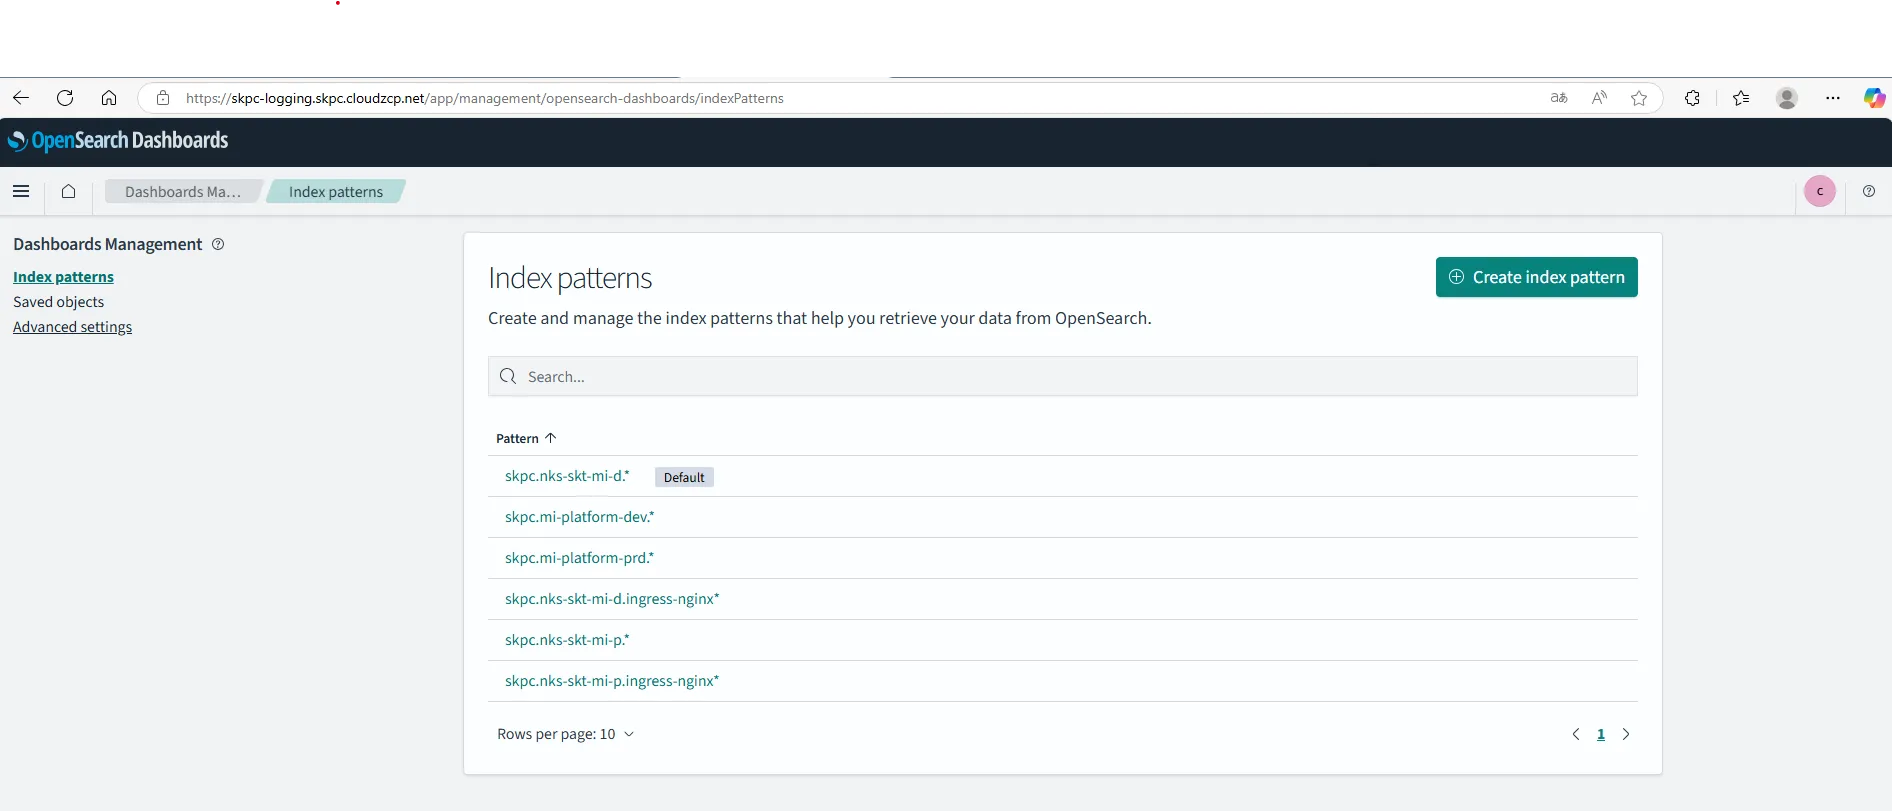
Index Patterns specify the target indexes for searching in OpenSearch Dashboards. You can create Index Patterns based on the log index format [Realm].[Project-Name].[Cluster-Name]-%Y.%m.%d.
Audit Log Retention Policies
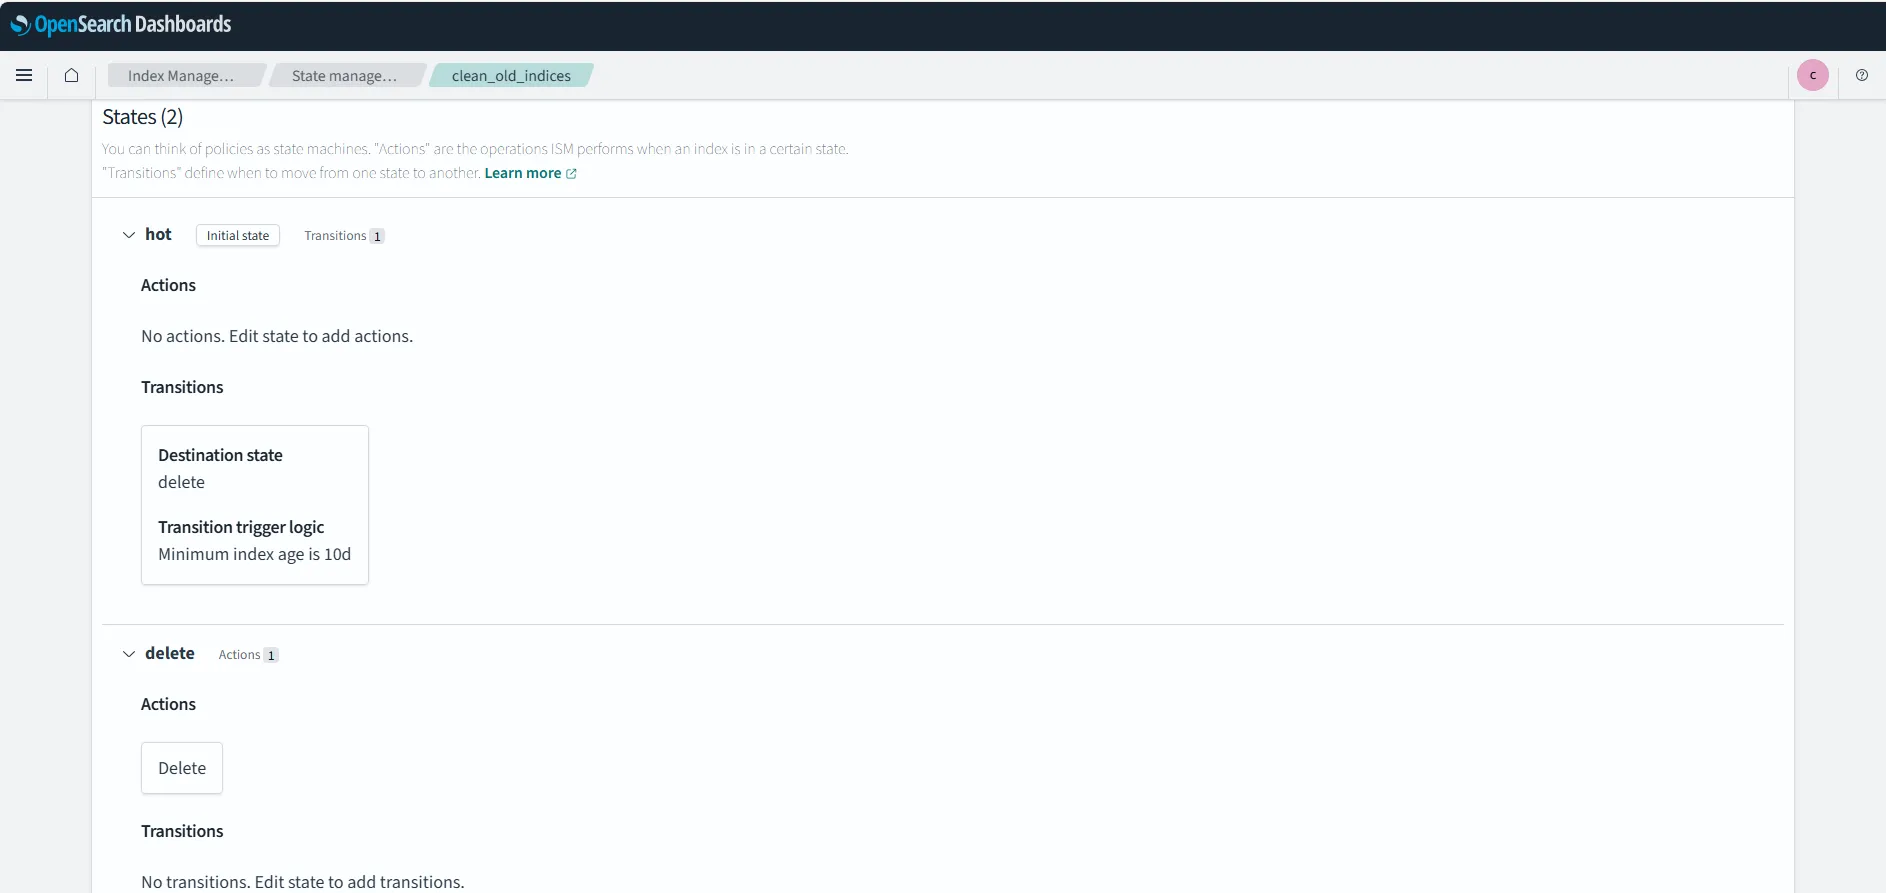
Retention policy is created from State management policy. Only administrator can view and manage them from OpenSearch Dashboards.
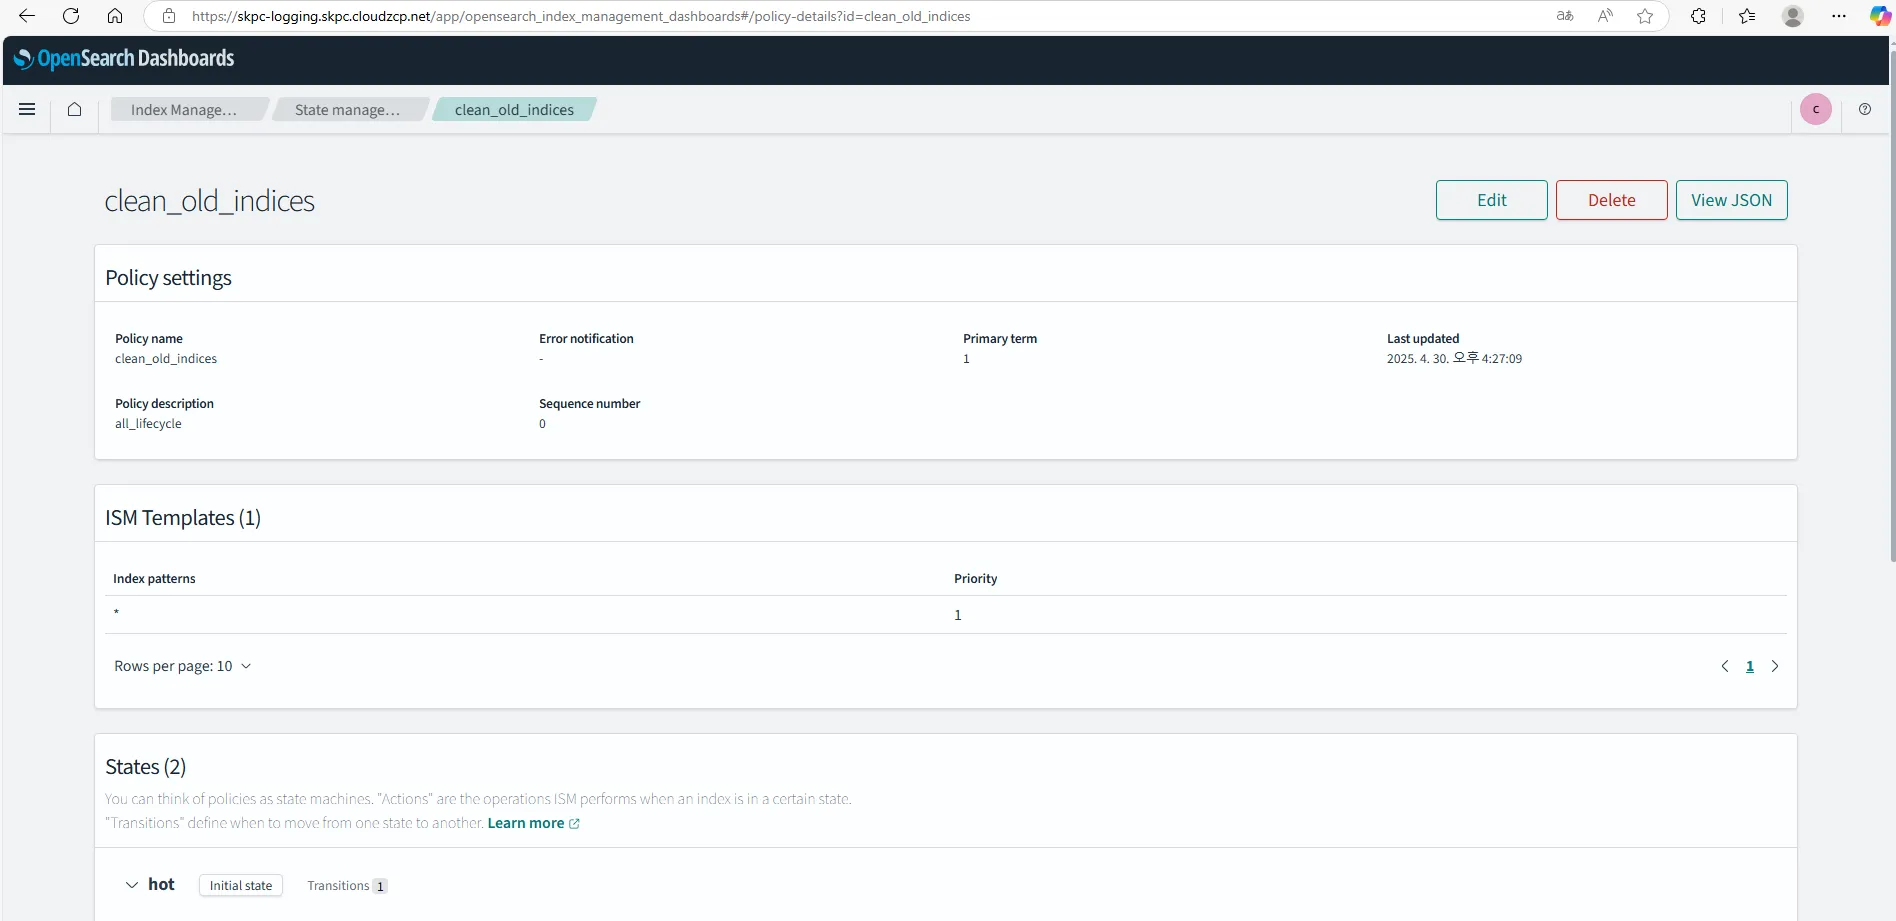
The system defines two states: hot and delete. Indexes remain in the hot state for 10 days, after which they transition to the delete state, where the delete action is triggered.
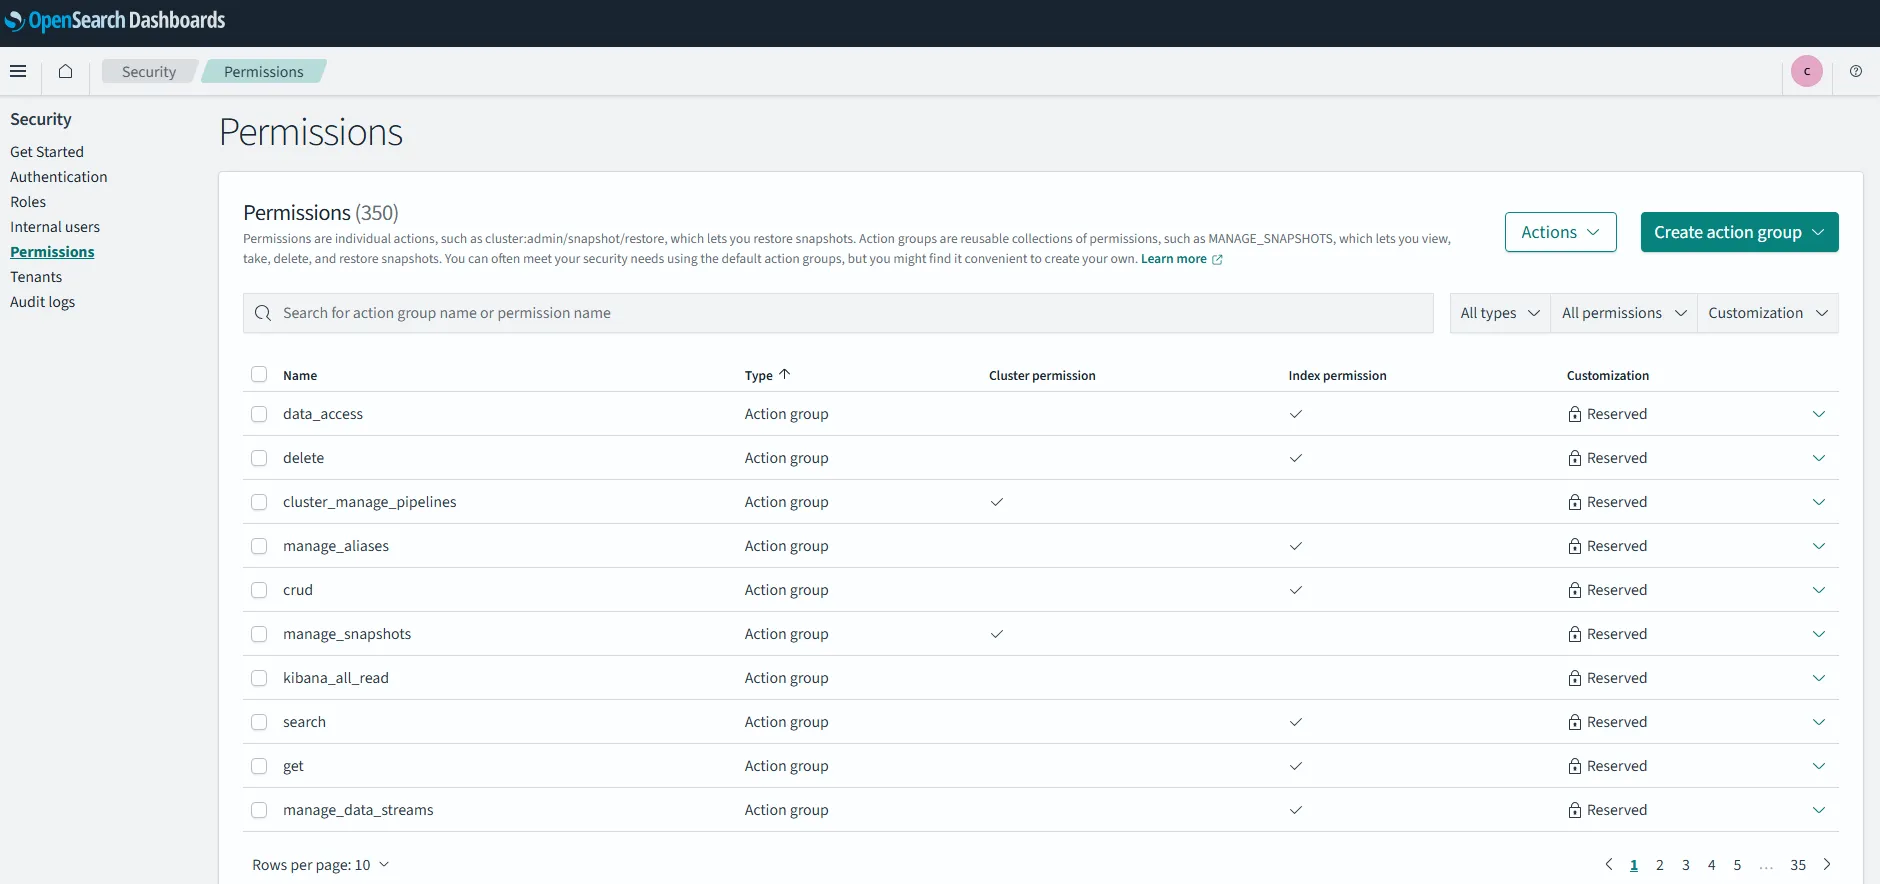
Security and Permissions
OpenSearch supports Index Policy for log management and Role and Permission management for security. The OpenSearch Dashboard Security menu allows setting up authentication, access control, roles, users, permissions, and tenants to manage and authorize log data in Multi Cluster. Tenants, categorized by project units, are important for securely sharing access to log data and saved objects.