GPU Inventory
Accessing the GPU Inventory Page
Project mode: Scheduler > GPU Inventory
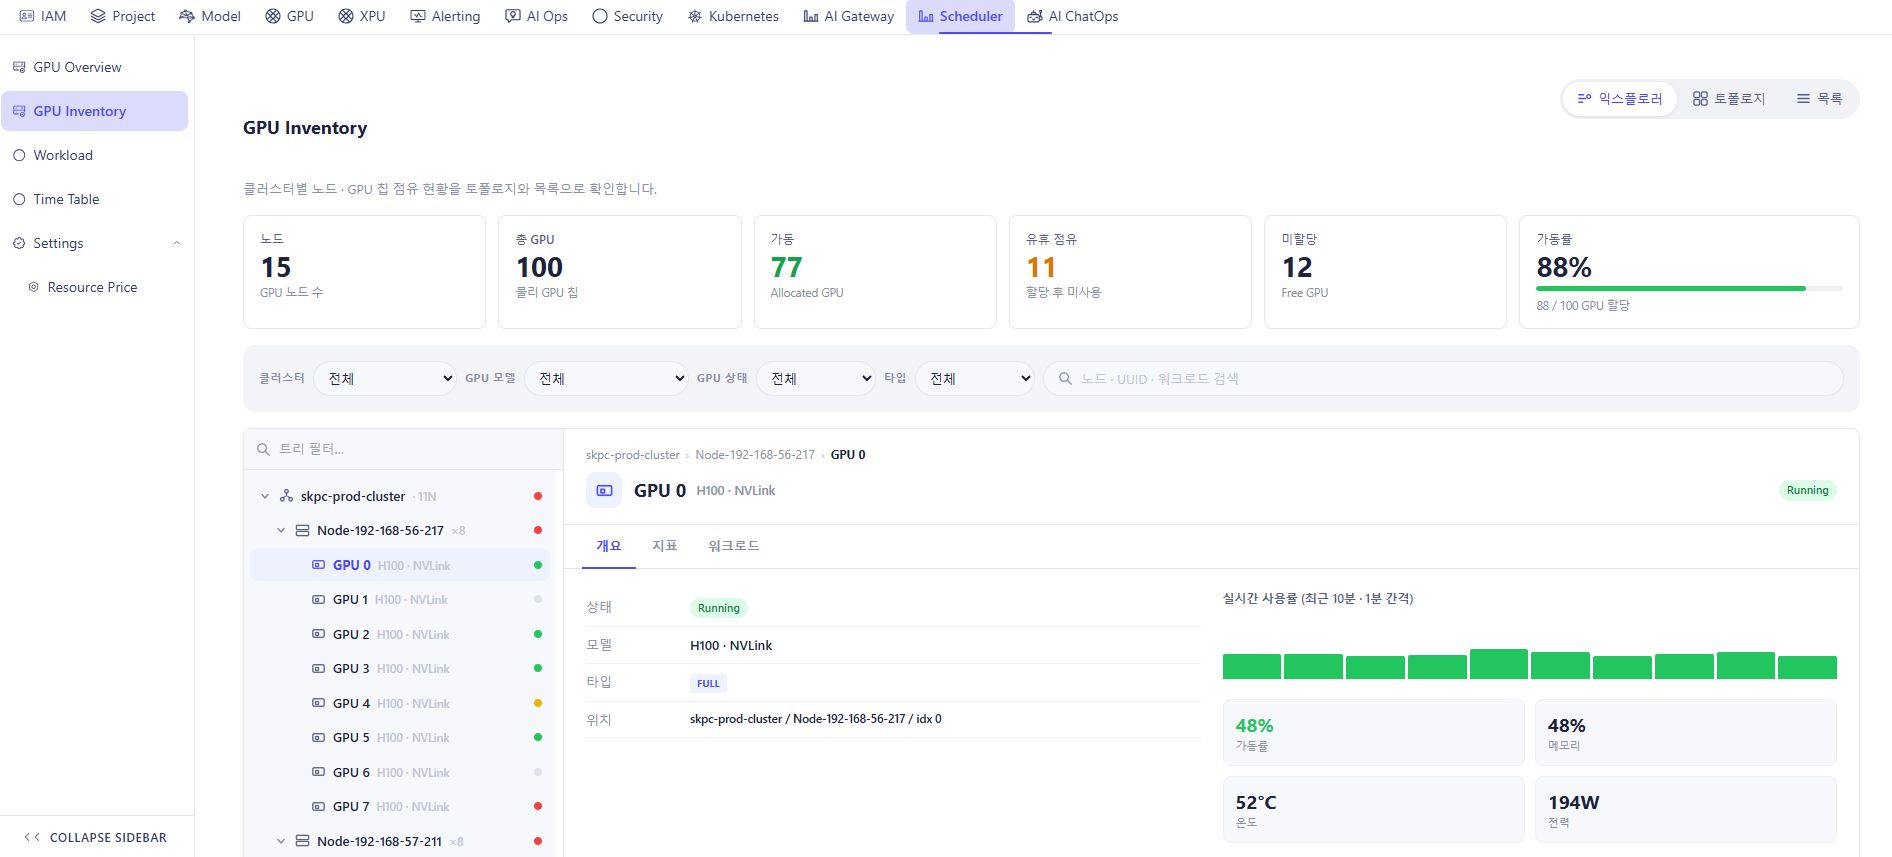
1. Summary Cards
| Card | Meaning |
|---|---|
| Node | Number of GPU nodes |
| Total GPU | Total physical GPU chips |
| behavior | Number of allocated GPUs |
| Idle occupancy | Allocated but unused GPUs |
| Unallocated | Free/unallocated GPUs |
| Operating rate | Percentage of GPUs in operation with a green progress bar |
2. Filter Bar
| Filter | Description |
|---|---|
| CLUSTER | Cluster dropdown, defaults to "entire" (all) |
| GPU MODEL | GPU model dropdown, defaults to "entire" |
| GPU STATUS | GPU status dropdown, defaults to "entire" |
| TYPE | GPU sharing-mode dropdown, defaults to "entire" |
| Search box | Searches "Node · UUID · Workload Search" |
3. Explorer Tab - Left-hand tree
- "Tree filter…" input above the tree.
- Hierarchy: Cluster → Node → GPU, e.g. skpc-prod-cluster (11N) → Node-192-168-56-217 (x8) → GPU 0 … GPU 7.
- Each GPU row shows its model (e.g. "H100 · NVLink")
- Status indicators: | Color | Meaning | | --- | --- | | 🟢 Green | Healthy / Operating normally | | 🟡 Yellow | Warning condition | | 🔴 Red | Critical issue detected | | ⚪ Gray | Idle, disconnected, or status unavailable |
- Selecting a GPU in the tree highlights that row (light purple background) and shows its detail on the right.
3.1. Cluster Detail
- Cluster detail information:
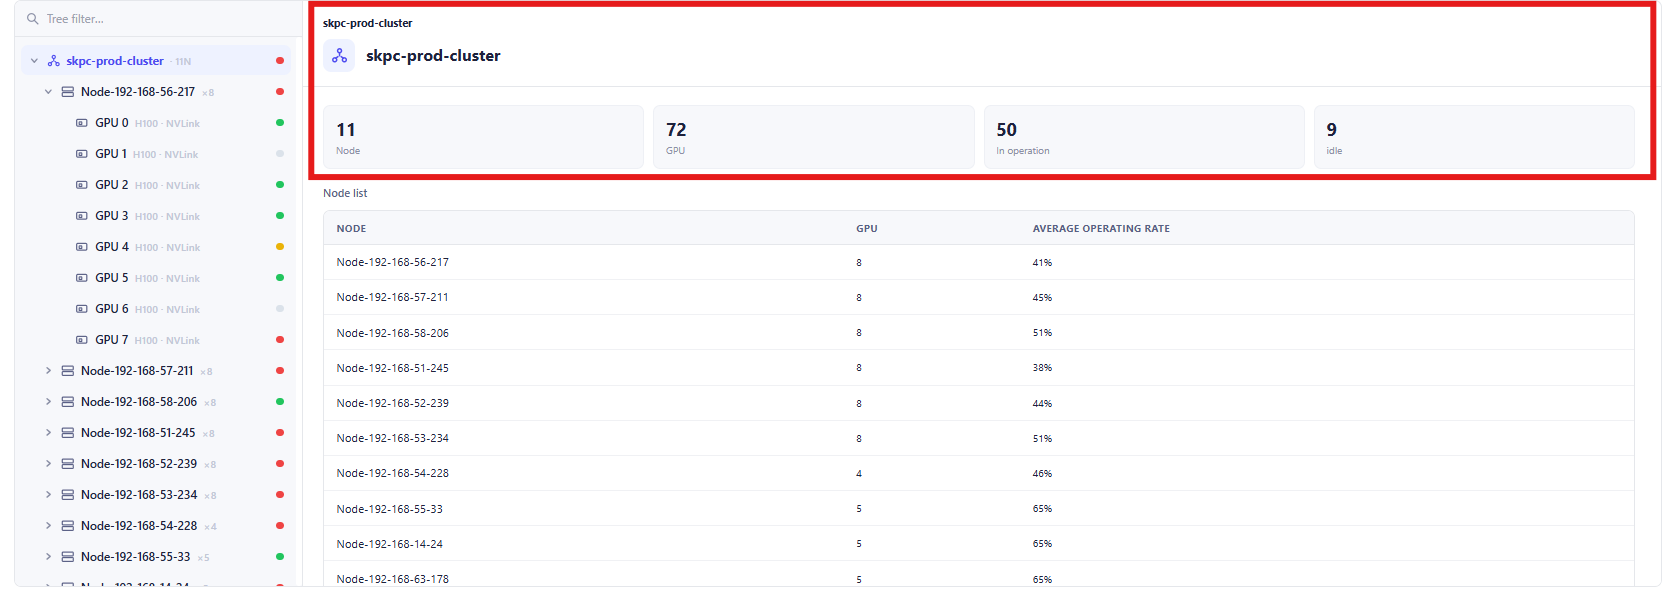
| Field | Description |
|---|---|
| Cluster Name | Name of the selected cluster. |
| Node | Total number of nodes in the cluster. |
| GPU | Total number of GPUs in the cluster. |
| In Operation | Number of GPUs currently running workloads. |
| Idle | Number of GPUs currently not assigned to workloads. |
- Node List Table
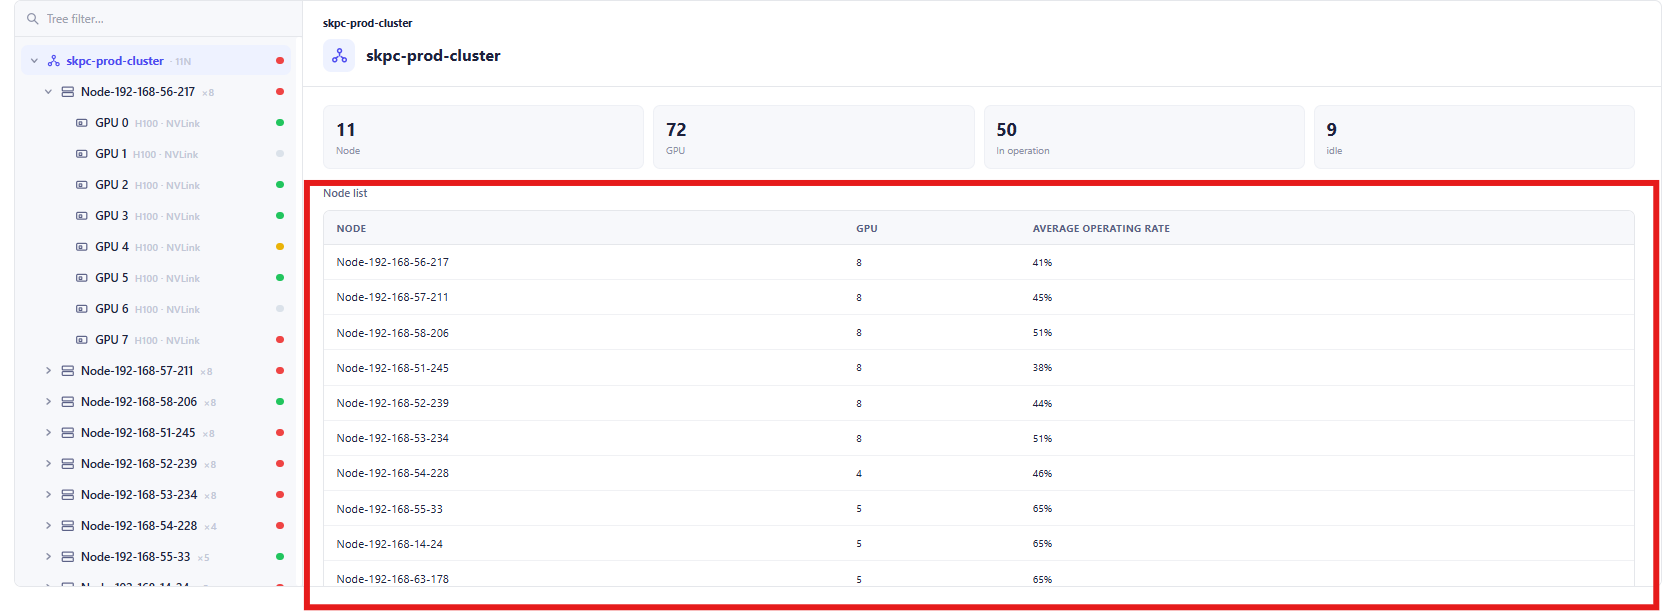
| Column | Description |
|---|---|
| Node | Node hostname or identifier. |
| GPU | Total GPUs available on the node. |
| Average Operating Rate | Average GPU utilization percentage across all GPUs on the node. |
3.2. Node Detail
- Node Detail Information
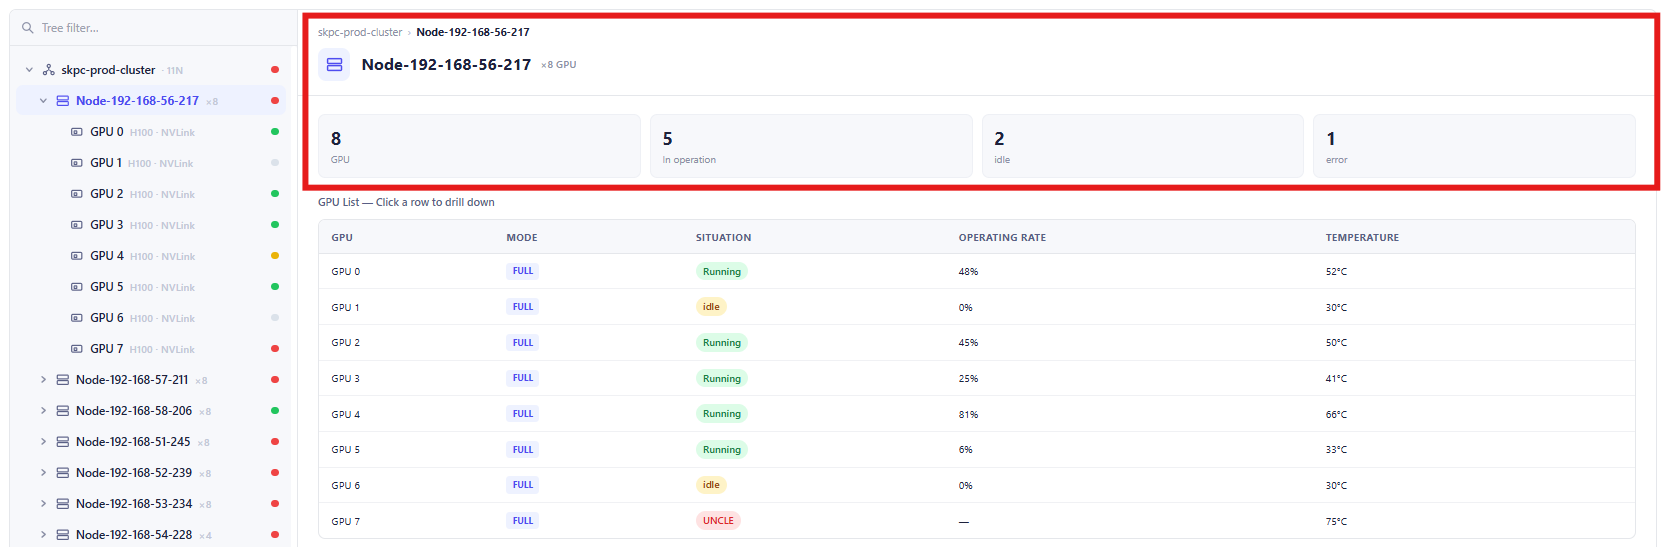
| Field | Description |
|---|---|
| Node Name | Name of the selected node. |
| Cluster | Cluster to which the node belongs. |
| GPU | Total number of GPUs installed on the node. |
| In Operation | Number of GPUs currently running workloads. |
| Idle | Number of GPUs currently not assigned to workloads. |
| Error | Number of GPUs currently reporting errors or abnormal conditions. |
- GPU List Table
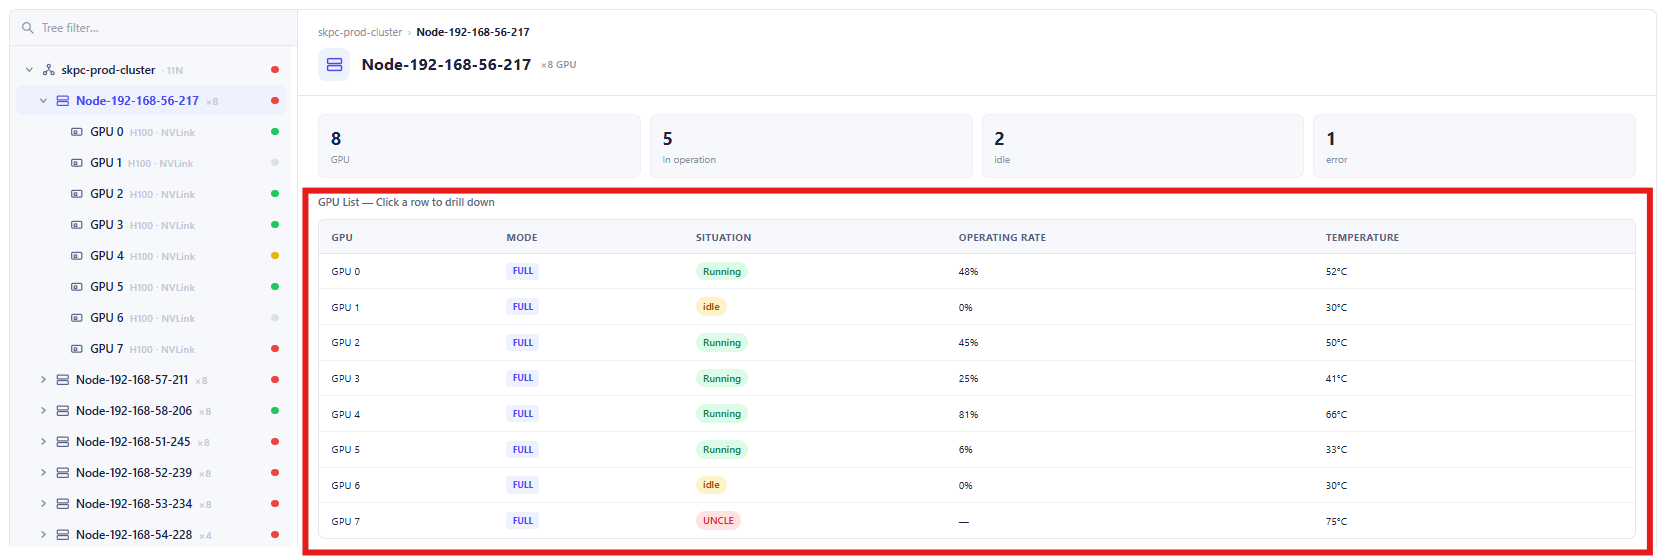
| Column | Description |
|---|---|
| GPU | GPU identifier within the node. |
| Mode | GPU operating mode or allocation mode. |
| Situation | Current operational status of the GPU. |
| Operating Rate | Current GPU utilization percentage. |
| Temperature | Current GPU temperature in degrees Celsius. |
3.3. GPU Detail
- Outline Tab:
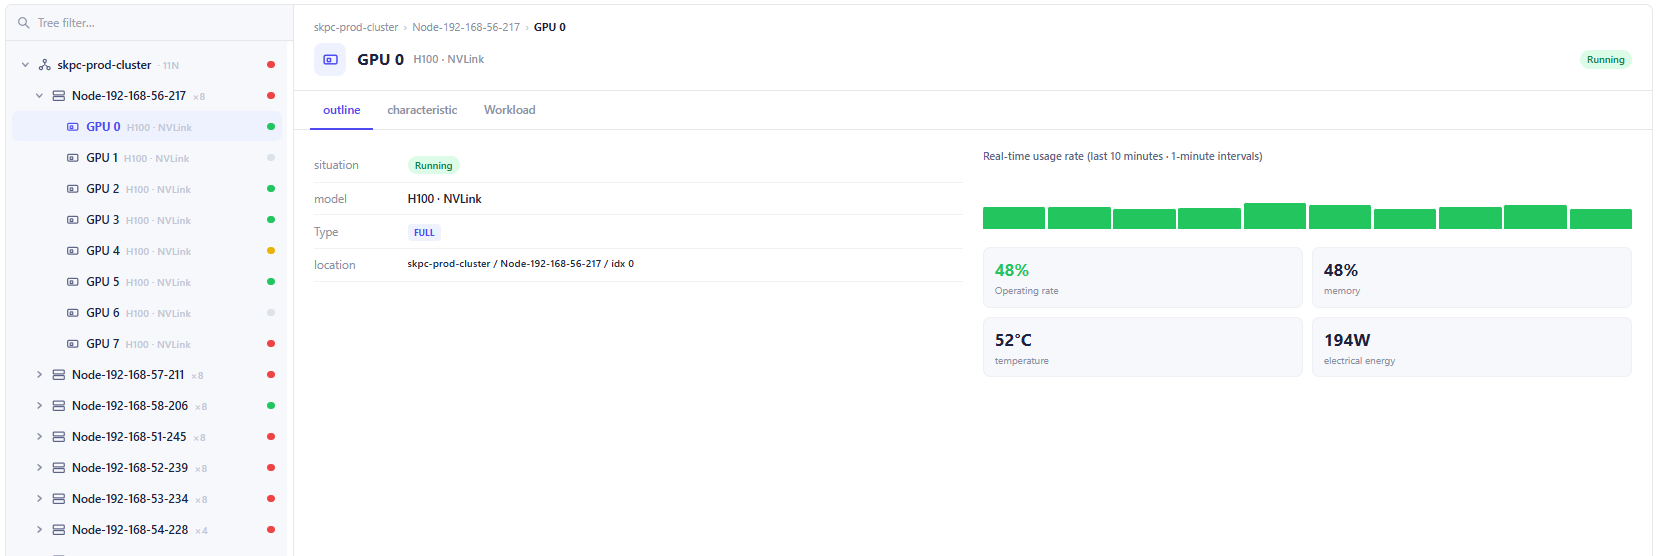
| Field | Description |
|---|---|
| GPU ID | Identifier of the selected GPU. |
| Model | GPU model and interconnect type. |
| Status | Current GPU operational status. |
| Type | GPU allocation mode. |
| Location | Physical location of the GPU within the cluster hierarchy. |
- Characteristic Tab:
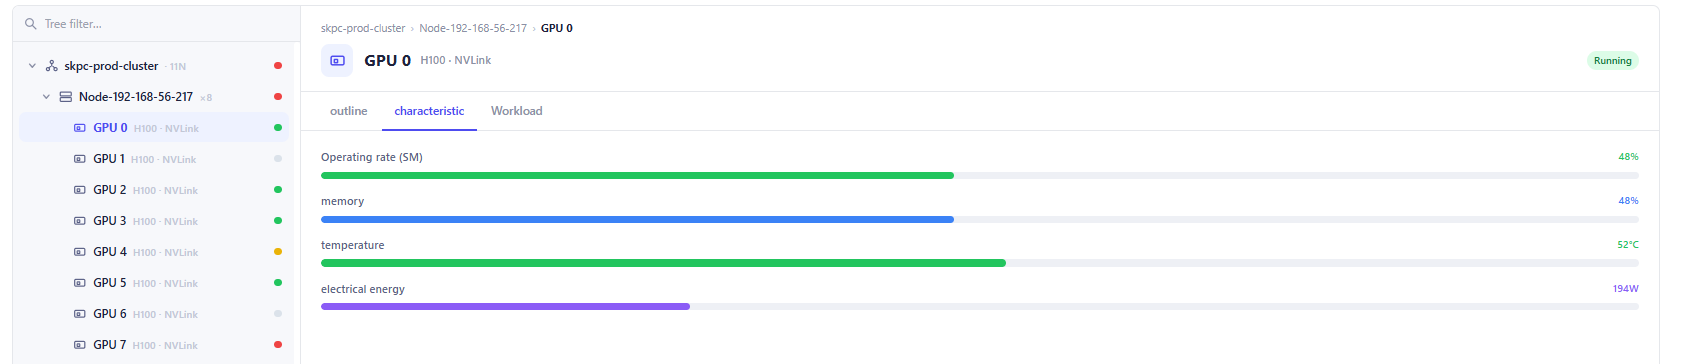
| Field | Description |
|---|---|
| Operating Rate (SM) | Current streaming multiprocessor utilization. |
| Memory | Current GPU memory utilization. |
| Temperature | Current GPU temperature. |
| Electrical Energy | Current GPU power consumption. |
- Workload Tab:
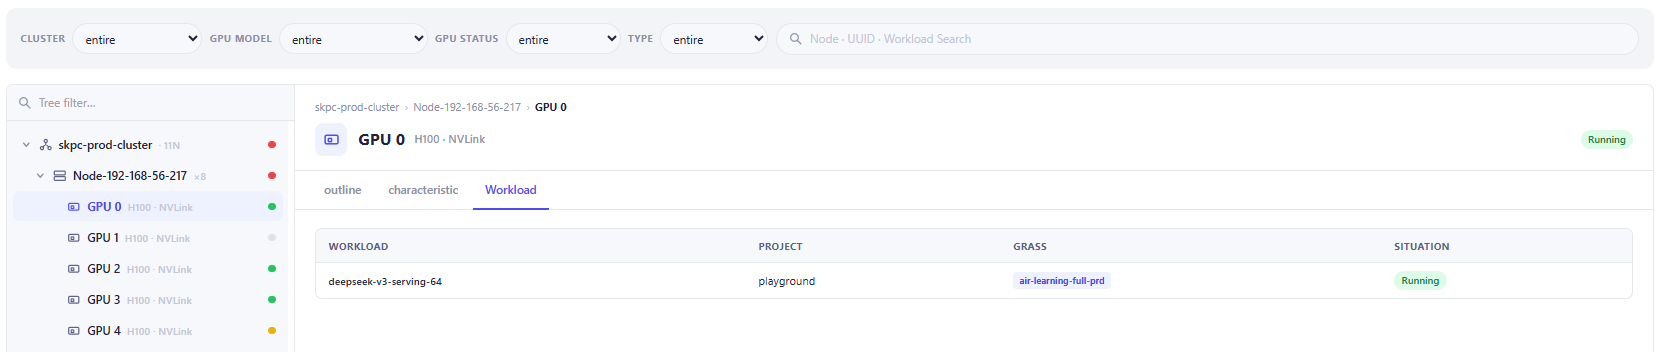
| Column | Description |
|---|---|
| Workload | Name of the workload currently assigned to the GPU. |
| Project | Project associated with the workload. |
| Grass | Resource pool, namespace, or execution environment. |
| Situation | Current workload status. |
4. Topology Tab
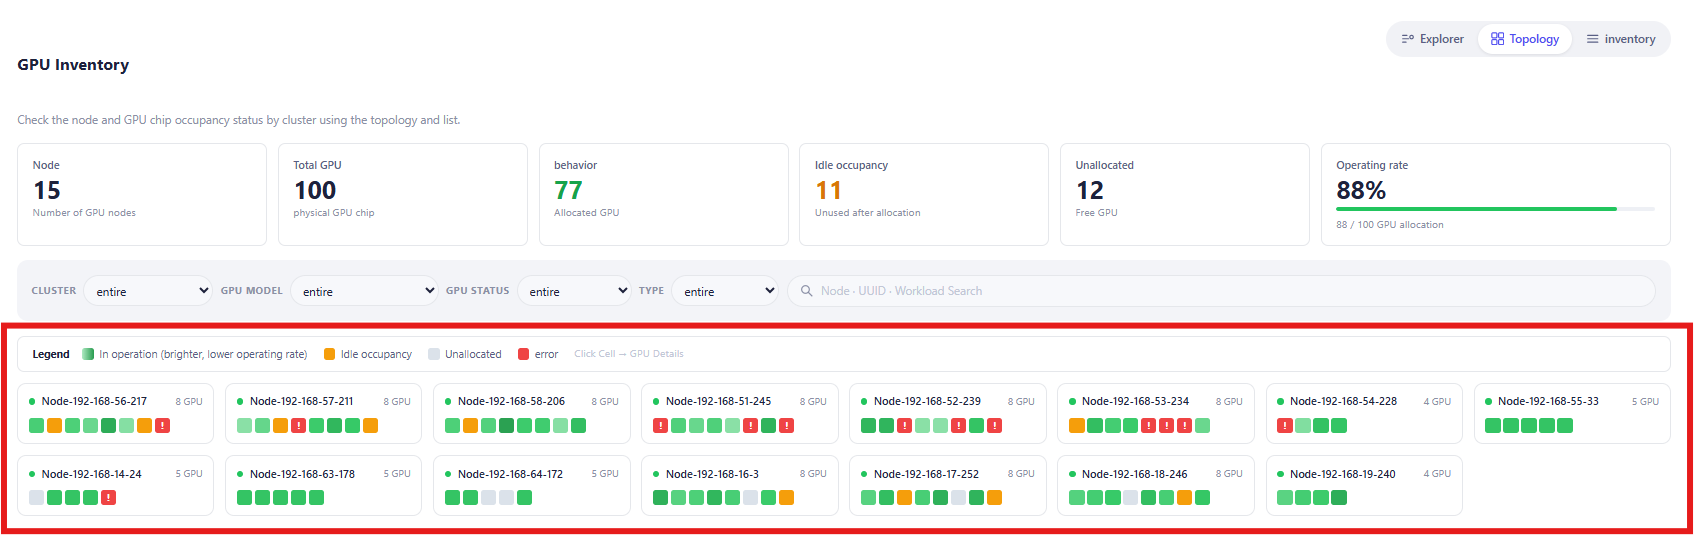
The topology view provides a visual representation of all nodes and GPUs within the inventory.
Each node card contains:
| Field | Description |
|---|---|
| Node Name | Hostname of the node. |
| GPU Count | Number of GPUs installed on the node. |
| GPU Blocks | Visual indicators representing individual GPUs. |
| Status Indicator | Color-coded status of each GPU. • Green: In Operation (GPU is actively running workloads.) • Orange: Idle Occupancy (GPU is allocated but currently idle.) • Gray: Unallocated (GPU is available and not assigned.) • Red: Uncle (GPU has reached the maximization.) |
The GPU Detail panel appears when a user clicks an individual GPU block within the topology view.
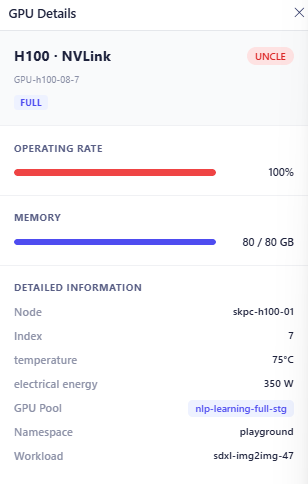
| Field | Description |
|---|---|
| Model | GPU model and interconnect type. |
| GPU Identifier | Unique GPU identifier. |
| Allocation Type | GPU allocation mode. |
| Status | Current operating status. |
| Operating | Current GPU utilization |
| Memory | Current memory consumption |
| Field | Description |
|---|---|
| Node | Host node where the GPU is installed. |
| Index | GPU index within the node. |
| GPU Pool | GPU resource pool assigned to the workload. |
| Namespace | Kubernetes namespace or project namespace. |
| Workload | Current workload using the GPU. |
5. Inventory Tab
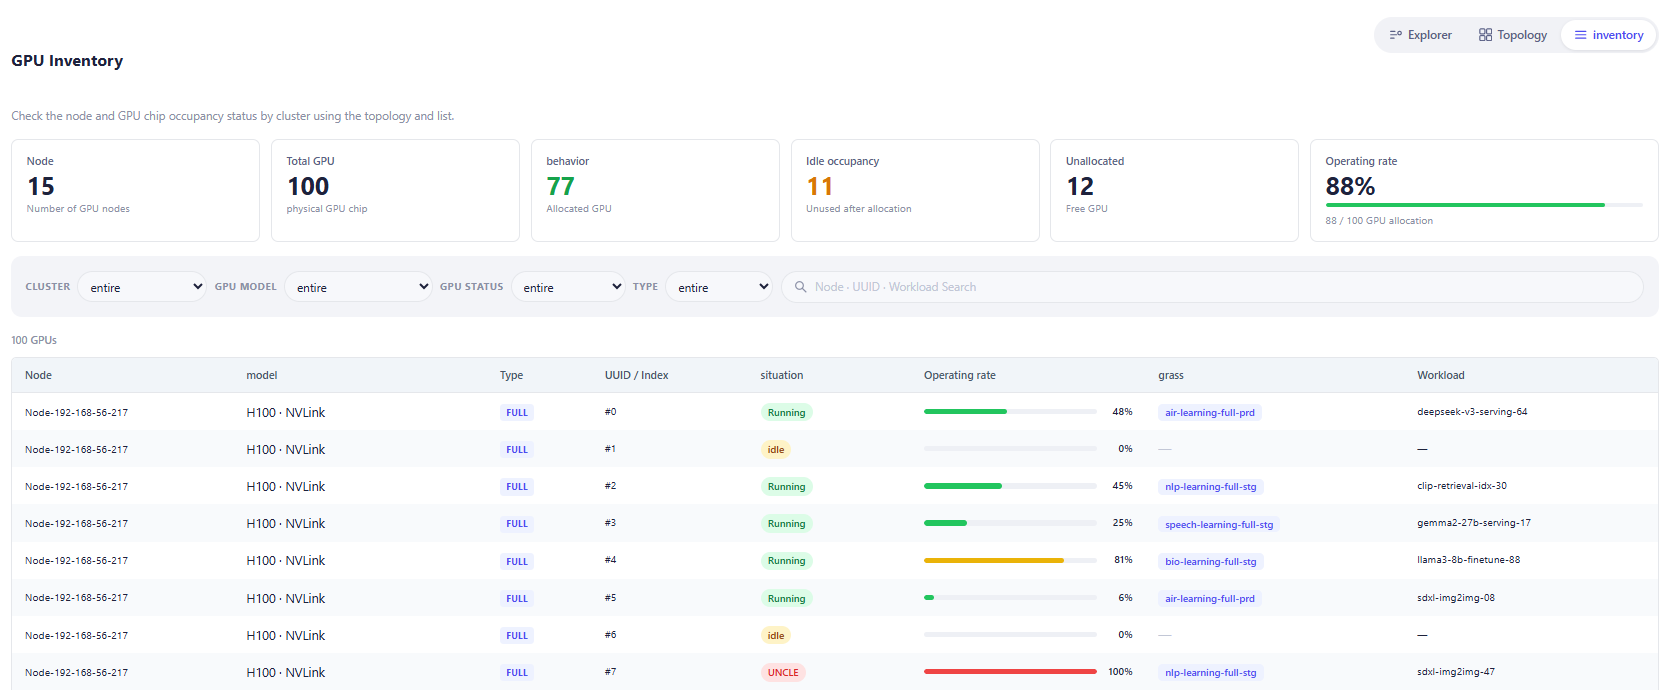
| Column | Description |
|---|---|
| Node | Host node containing the GPU. |
| Model | GPU model and interconnect type. |
| Type | GPU allocation type. |
| UUID / Index | GPU index or unique identifier within the node. |
| Situation | Current operating status of the GPU. • Running: GPU is actively executing a workload. • Idle: GPU is allocated but not currently being utilized. • UNCLE: GPU is in an abnormal state and requires investigation. • Error: GPU has reported a failure condition. |
| Operating Rate | Current GPU utilization percentage. |
| Grass | GPU pool or resource group assigned to the workload. |
| Workload | Workload currently consuming the GPU resource. |
The GPU Detail side panel is displayed when a user clicks a GPU row from the Inventory table.
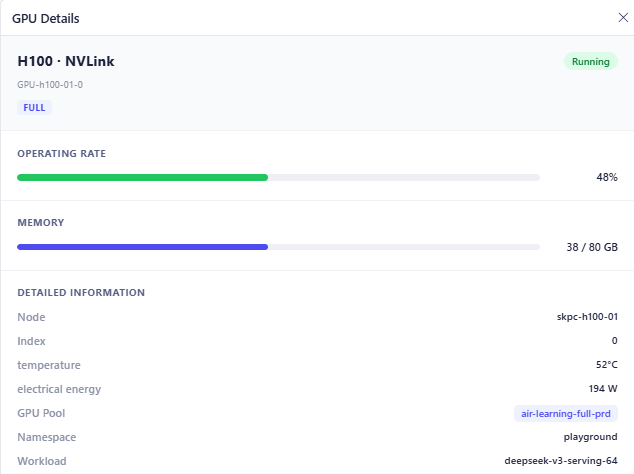
| Field | Description |
|---|---|
| Model | GPU model and interconnect type. |
| GPU Identifier | Unique GPU identifier. |
| Allocation Type | GPU allocation mode. |
| Status | Current GPU state. |
| Operating Rate | Current GPU utilization percentage. |
| Memory | Current memory consumption versus total capacity. |
| Field | Description |
|---|---|
| Node | Host node where the GPU is installed. |
| Index | GPU device index within the node. |
| Temperature | Current GPU temperature. |
| Electrical Energy | Current power consumption. |
| GPU Pool | Resource pool assigned to the GPU workload. |
| Namespace | Namespace or project using the GPU. |
| Workload | Workload currently running on the GPU. |