1. Overview
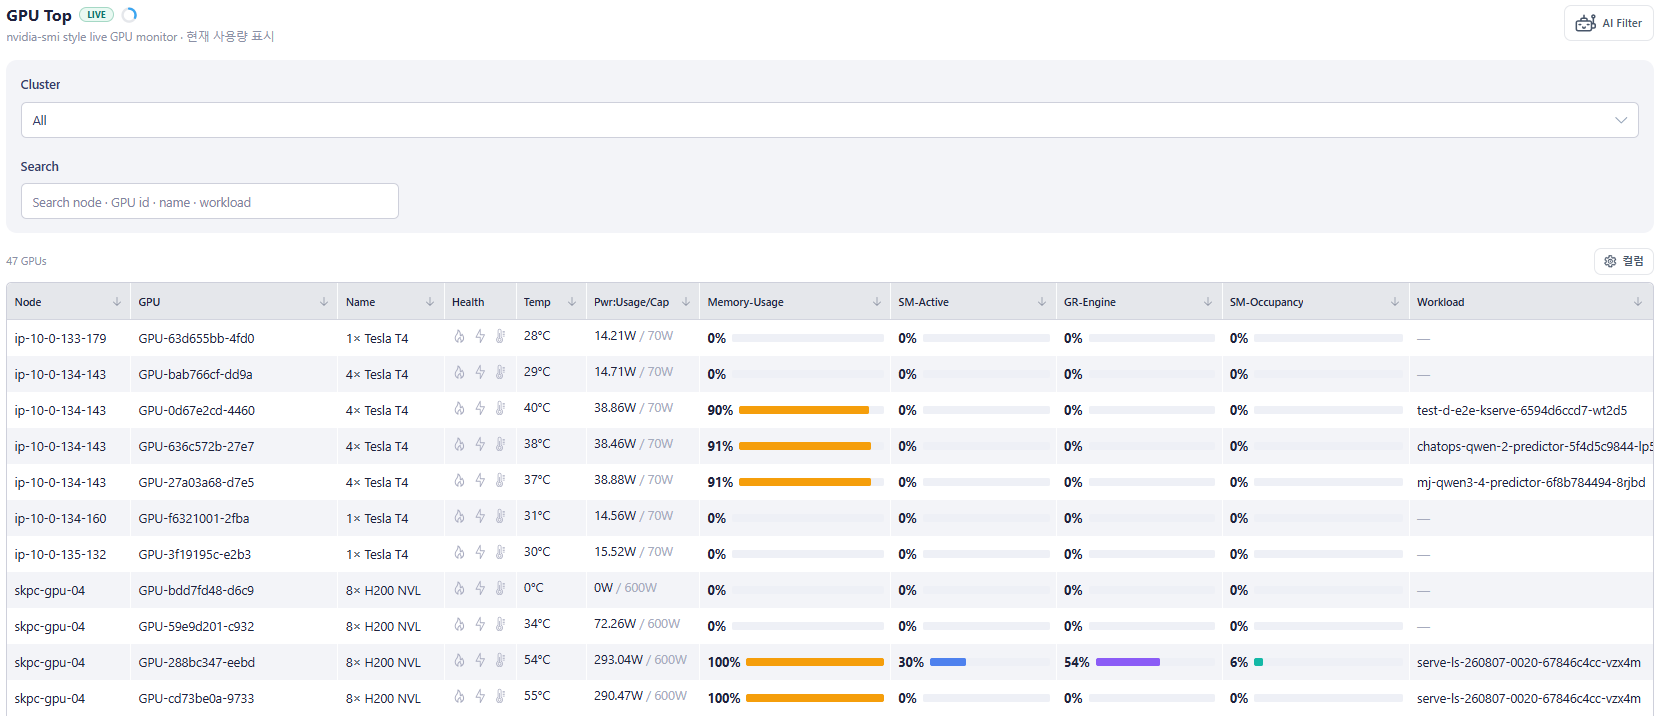
GPU Top is a real-time GPU monitoring screen modeled after nvidia-smi. It presents every GPU in the system in a single table. The goal: at a glance, know which GPU is running hot, which is being throttled, what workload is on it, and whether it is actually computing or merely occupying space.
| Item | Value |
|---|---|
| Menu location | GPU → GPU Monitoring → Top |
| Auto-refresh interval | 3 seconds |
2. Page Header
| Element | Meaning |
|---|---|
| LIVE badge | LIVE Data is coming from the real backend. DEMO means fixture data is being used (local dev only). … means the page is still connecting. |
| Ring ◔ (Poll Ring) | A 3-second countdown to the next refresh. Flashes green the moment new data arrives. |
| AI Filter button | Opens/closes the natural-language filtering assistant panel on the right edge of the screen. |
3. Filter Bar
| Filter | Description |
|---|---|
| Cluster | Limit to a specific cluster. Defaults to All (fan-out across all clusters). |
| Search | Free-text search using case-insensitive substring matching across: • Node name • GPU ID (full value) • GPU / product name • Name of the running workload Examples: type skpc-gpu-04 to view only that node, or type qwen to view only GPUs running Qwen workloads. |
4. Data Table
Above the table you will see the number of GPUs matching the current filters (e.g. 47 GPUs) and a ⚙ Columns button to show/hide individual columns.
Column reference
| Column | Content | Notes |
|---|---|---|
| Node | Hostname of the node hosting the GPU | Only the segment before the first dot is shown (e.g. ip-10-0-134-143) |
| GPU | Shortened GPU UUID | Hover to reveal the full UUID |
| Name | <GPU count on node>× <product name> | e.g. 8× H200 NVL, 4× Tesla T4 |
| Health | Three throttle status icons | See section 4.1 |
| Temp | Current temperature (°C) | Color-coded by threshold — see section 4.2 |
| Pwr:Usage/Cap | Power draw / power limit (W) | e.g. 97.63W / 600W |
| Memory-Usage | % of VRAM | |
| SM-Active | % of cycles with at least one warp resident on an SM | |
| GR-Engine | % of time the Graphics/Compute engine is active | |
| SM-Occupancy | Ratio of resident warps to maximum warps | Measures how full the SMs are, not how busy |
| Workload | Name of the pod/workload holding the GPU | Click to open Workload Information. Shows — when the GPU is idle |
Most columns are sortable — click the arrow in the header to toggle ascending/descending.
4.1. Health column — three throttle icons
Values come from DCGM's clocksEventReasons (the reason the GPU downclocked itself), not inferred from temperature thresholds.
| Icon | Active color | Name | Meaning & action |
|---|---|---|---|
| 🔥 Fire | Red | HW Thermal Protection | Hardware is self-protecting against overheating — critical. Check the node's cooling and airflow. |
| ⚡ Bolt | Yellow | Power Brake | Power cap reached, clocks reduced. Performance drops but it is not dangerous. |
| 🌡 Thermometer | Blue | SW Thermal Slowdown | Driver-level soft thermal downclock. An early warning before it escalates to HW Thermal. |
A gray icon means the corresponding event is not present (normal).
4.2. Temperature color thresholds
| Temperature | Color | Status |
|---|---|---|
| < 85 °C | Normal | OK |
| 85 – 89 °C | Yellow | Warning — approaching the throttle threshold |
| ≥ 90 °C | Red | Critical — throttling is imminent or already active |
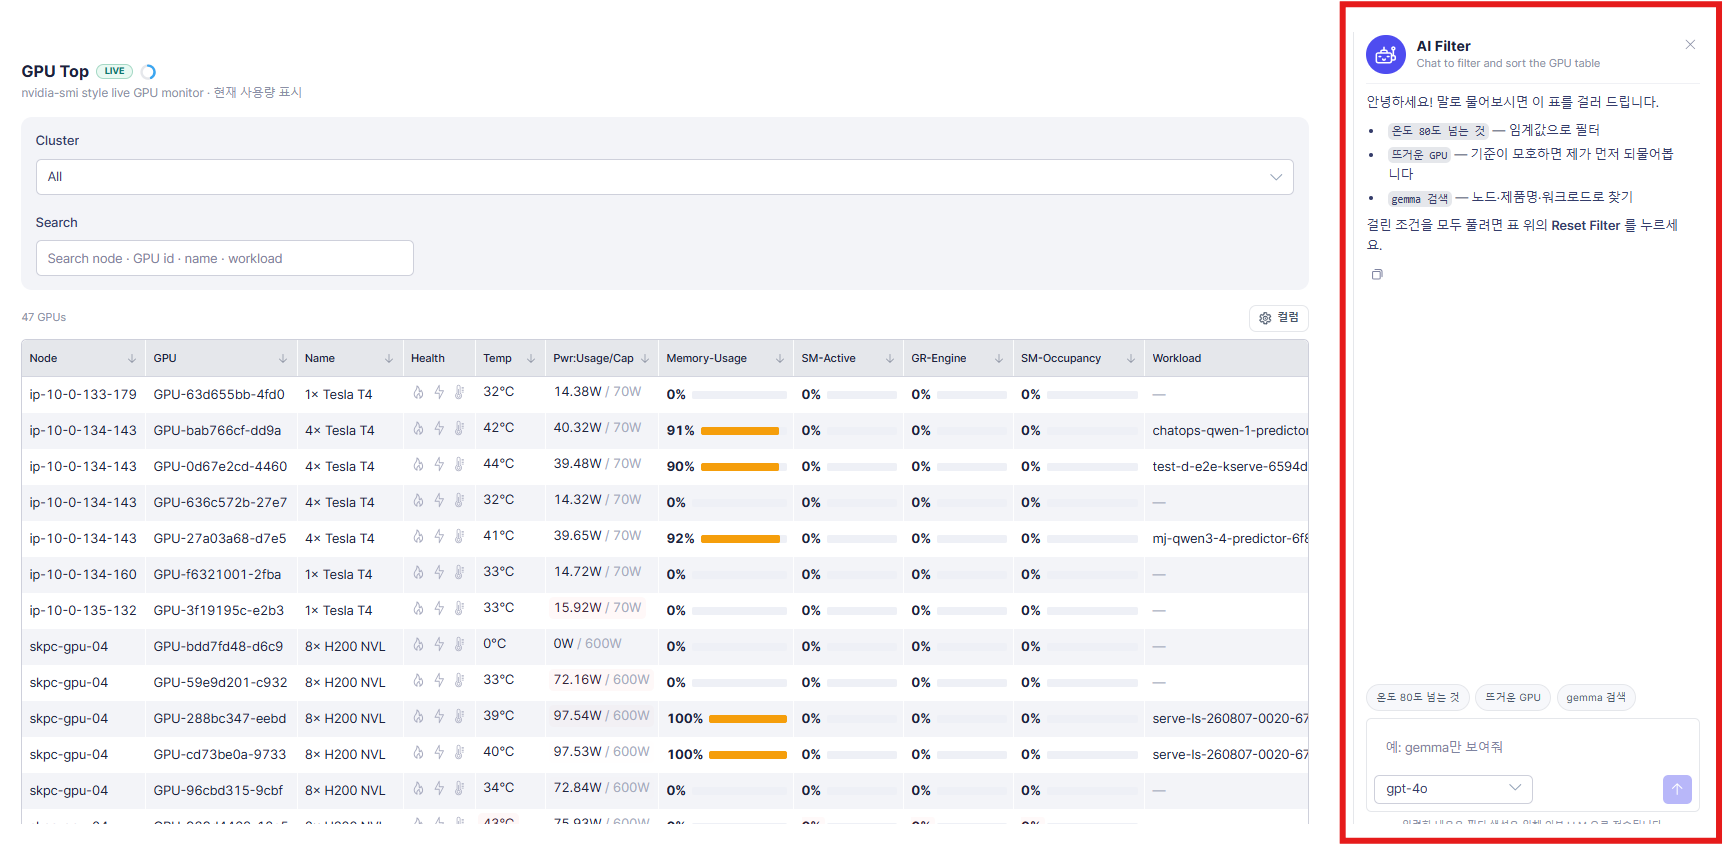
5. AI Filter Panel
Ask in plain language instead of typing keywords into the Search box and clicking column headers.