Dashboard
Overview
The dashboard is the main page for system administrators to get an at-a-glance view of the overall status of the GPU management system. It provides visualizations of real-time GPU usage, project-specific allocations, and request statuses using cards, charts, and tables.
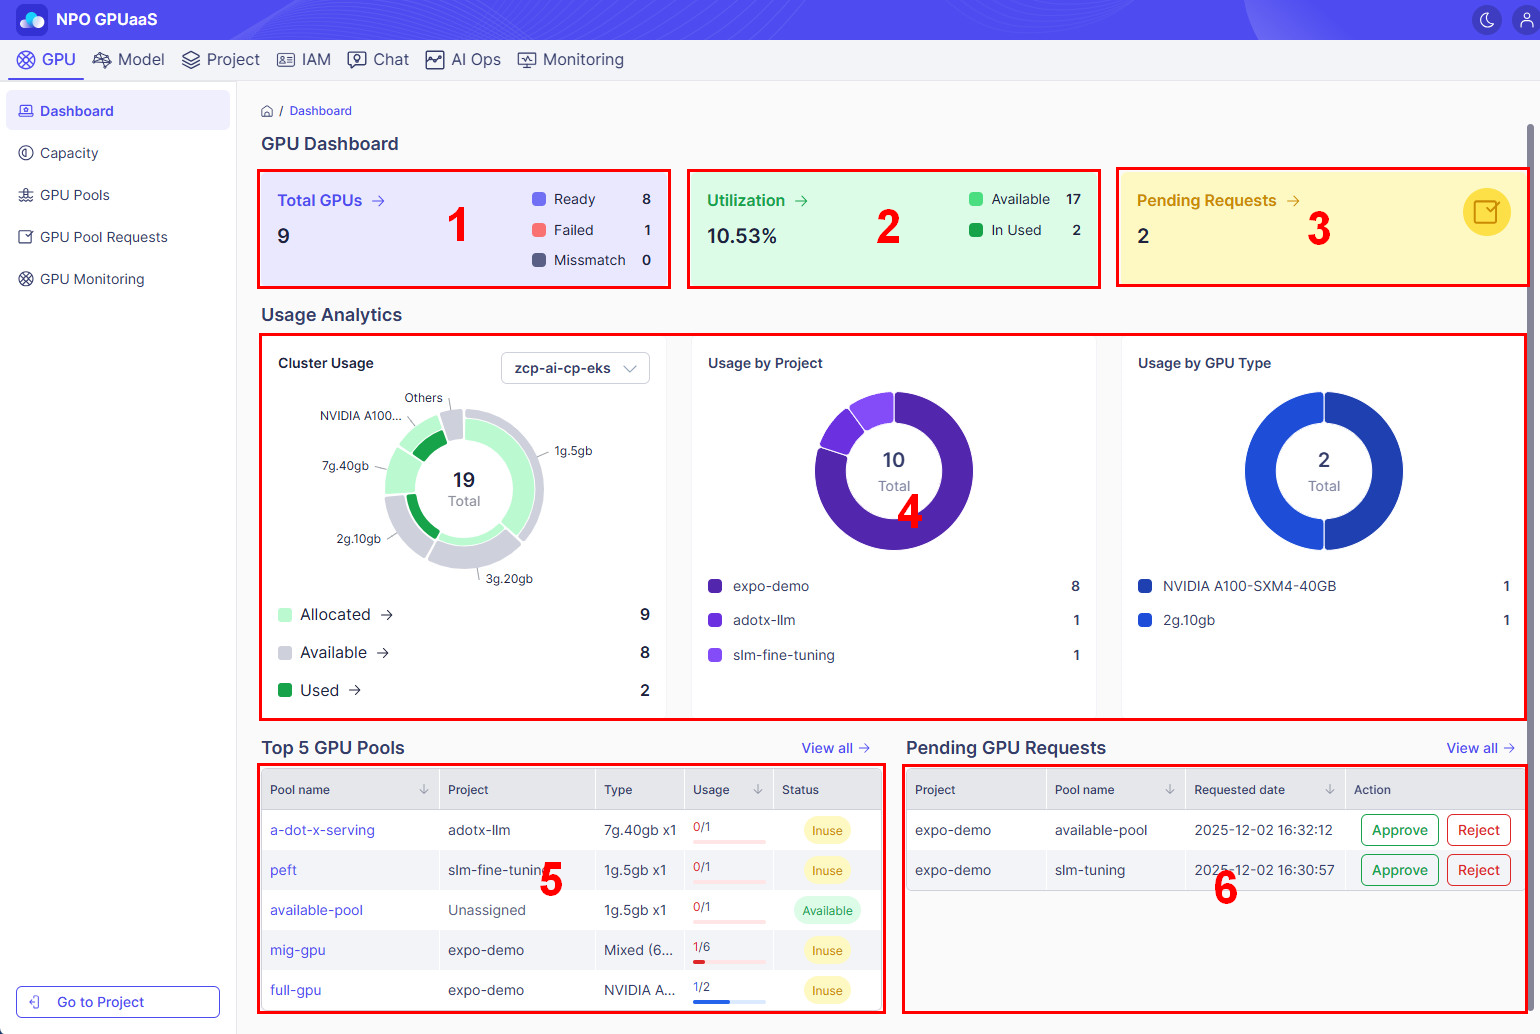
1 ~ 3 Card Section - Summary of Key Metrics (Total GPUs Card, Utilization Card, and Pending Requests Card)
-
Usage Analysis Chart - GPU Usage Analysis
-
Top GPU Pools Table - List of Main GPU Pools
-
Pending GPU Requests Table - List of Pending Requests
Card Section
Total GPUs Card
- Purpose: Display the total number of GPU resources registered in the system.
- Color: Theme default.
- Displayed information:
- Total GPUs: Total number of GPUs across the infrastructure.
- GPU count by status: GPU counts for each status: Ready, Failed, and Mismatched.
- Action: Clicking the card navigates to the GPU Pools Management page for further details.
- Use cases:
- Provide a quick overview of infrastructure scale, including a breakdown of operational status.
- Serve as a reference for utilization calculations.
Utilization Card
- Purpose: Displays overall GPU utilization (%) in real-time by 'Available' and 'In Use'.
- Color: Green tones.
- Displayed information:
- Utilization: Percentage of GPUs currently in use.
- Available: Number of GPUs ready for allocation.
- In Used: Number of GPUs currently allocated and running workloads.
- Action: Clicking the card navigates to the GPU Capacity Management page for a deeper dive into usage analytics.
- Use cases:
- Enable users to monitor resource consumption
- Quickly identify available capacity and determine if additional resources are needed.
info
Utilization = (In Used / Total GPUs) × 100%
Pending Requests Card
- Purpose: Displays the number of GPU requests pending approval.
- Color: Yellow tones.
- Displayed information:
- Pending Requests: Count of requests with status REQUESTED.
- Icon: Checkbox icon to signal pending actions.
- Action: Clicking the card navigates to the GPU Pool Requests page with the REQUESTED filter applied.
- Use case: Instantly monitor unprocessed requests and prioritize actions accordingly.
warning
A high number of pending requests may require immediate attention to avoid delays in resource allocation.
Usage Analytics Chart
Cluster Usage Chart
- Purpose: Visualize the allocation status of GPUs by specification using a polar donut chart, delivering instant insights into cluster-wide resource distribution.
- Color: Green tones.
- Display information:
- Total: The total GPU count for the selected cluster.
- Allocated: Number of GPUs assigned to pools but not currently in use (green).
- Available: Number of GPUs not yet allocated and available for new assignments (light green).
- Used: Number of GPUs currently being utilized by running pods (gray).
- Use cases:
- Compare allocation, usage, and availability across GPU specs.
- Identify usage patterns and resource bottlenecks.
- Support decision-making for scaling and resource planning.
- Interpretation logic:
- Allocated: Represents GPUs allocated to pools but not yet used.
- Used: Represents GPUs actively used by workloads (usedProfile from allCounts API).
- Available: Represents GPUs that are neither allocated nor in use (Available from cluster-capacity).
- Allocated + Used: Represents all GPUs allocated to pools (from cluster-capacity).
- Chart slice size reflects actual numbers for each status/spec.
Usage by Project Chart
- Purpose: Shows the percentage of GPU usage by project. You can visually see how much each project accounts for in the total usage.
- Color: Purple tones.
- Display information:
- Top 5 projects are shown individually with number of GPUs in use.
- The other projects are grouped under Other
- Total: Total number of GPUs in use by all projects
- Use cases:
- Monitor which projects are consuming the most GPU resources.
- Detect concentration and usage trends.
- Track project-specific changes over time.
- Interpretation logic: Slice size = usage amount per project.
note
"Other" cannot be expanded; details are available via tooltip.
Usage by GPU Type Chart
- Purpose: Illustrate GPU usage by hardware type with a donut chart for quick reference (A100, H100, etc.).
- Color: Blue tones.
- Display information:
- Top 5 types shown individually with number of GPUs in use.
- The other types are grouped under "Other".
- Total: Total GPUs in use by type.
- Use cases:
- Identify the most and least utilized GPU types.
- Detect type-based availability and saturation.
- Analyze hardware trends and inform future procurement.
- Interpretation logic: Slice size = usage count per GPU type.
Top 5 GPU Pools Table
- Purpose: Provide a real-time overview of the main GPU pools, highlighting usage, assignment, and status to support effective resource management.
- Display information:
- Pool Name: Name of the GPU pool, clickable to navigate to the pool’s details page.
- Project: Assigned project name; if unassigned, displayed as Unassigned.
- Type: GPU model and quantity information (e.g., 7g.40gb x1, 1g.5gb x1, Mixed).
- Usage: Shows Used/Total GPUs (e.g., 0/1, 1/6), visualized with a progress bar.
- Status: Pool Status (Healthy/Unhealthy)
- Inuse: Active pool, currently in use.
- Available: Pool is available for assignment.
- Unassigned: No project assigned.
- Features:
- Sorting: Sort by Pool Name and Usage.
- View All: Access the complete GPU pool list.
- Usage: Usage is indicated by progress bar color.
- Low Usage: Green color.
- Medium Usage: Yellow color.
- High Usage: Red color.
- Use case: Monitor usage and status of key pools, identify unassigned pools and plan allocations.
- Monitor the usage rate and operational status of key GPU pools.
- Identify Unassigned pools for future allocation planning.
- Quickly review pool health and prioritize management actions.
Pending GPU Requests Table
- Purpose: Display the top 5 most recent pending GPU Pool requests, allowing administrators to efficiently manage approval workflows.
- Display information:
- Project: Name of the project in which the request was created
- Pool Name: Name of the requested GPU pool.
- Requested Date: Date and time when the request was created.
- Action: Approve or Reject the request (allows the administrator to Approve or Reject the request).
- Features:
- Sorting: Sort by Pool Name or Requested Date.
- Actions:
- Approve: Instantly approve the request.
- Reject: Opens a modal to input the rejection reason (mandatory)
- View All: Access the complete list of GPU Pool requests
- Use Case:
- Quickly identify and process older or urgent requests.
- Streamline approval and rejection, minimizing administrative delays.
- Processing Method:
- Click Approve then request is approved
- Click Reject then input reason in modal then request is rejected
note
- Data updates automatically after processing.
- Rejection requires a reason to ensure transparency and traceability.