Monitoring Architecture
아키텍처 개요
ZCP는 Prometheus Agent을 사용하여 여러 데이터 플레인 클러스터에서 메트릭을 수집하고 이를 컨트롤 플레인 클러스터 내의 Cortex에 중앙 집중식으로 저장합니다. 이는 Grafana를 통해 클러스터 전체 및 프로젝트별 워크로드를 모니터링하기 위한 통합 대시보드를 제공하며, 필요에 따라 대시보드를 사용자 정의할 수 있는 유연성을 제공합니다.
시스템은 각 데이터 플레인 클러스터에 Prometheus를 배포하여 메트릭을 수집하고, 이후 remote_write API를 사용하여 컨트롤 플레인 클러스터의 Cortex 저장소로 전송합니다.
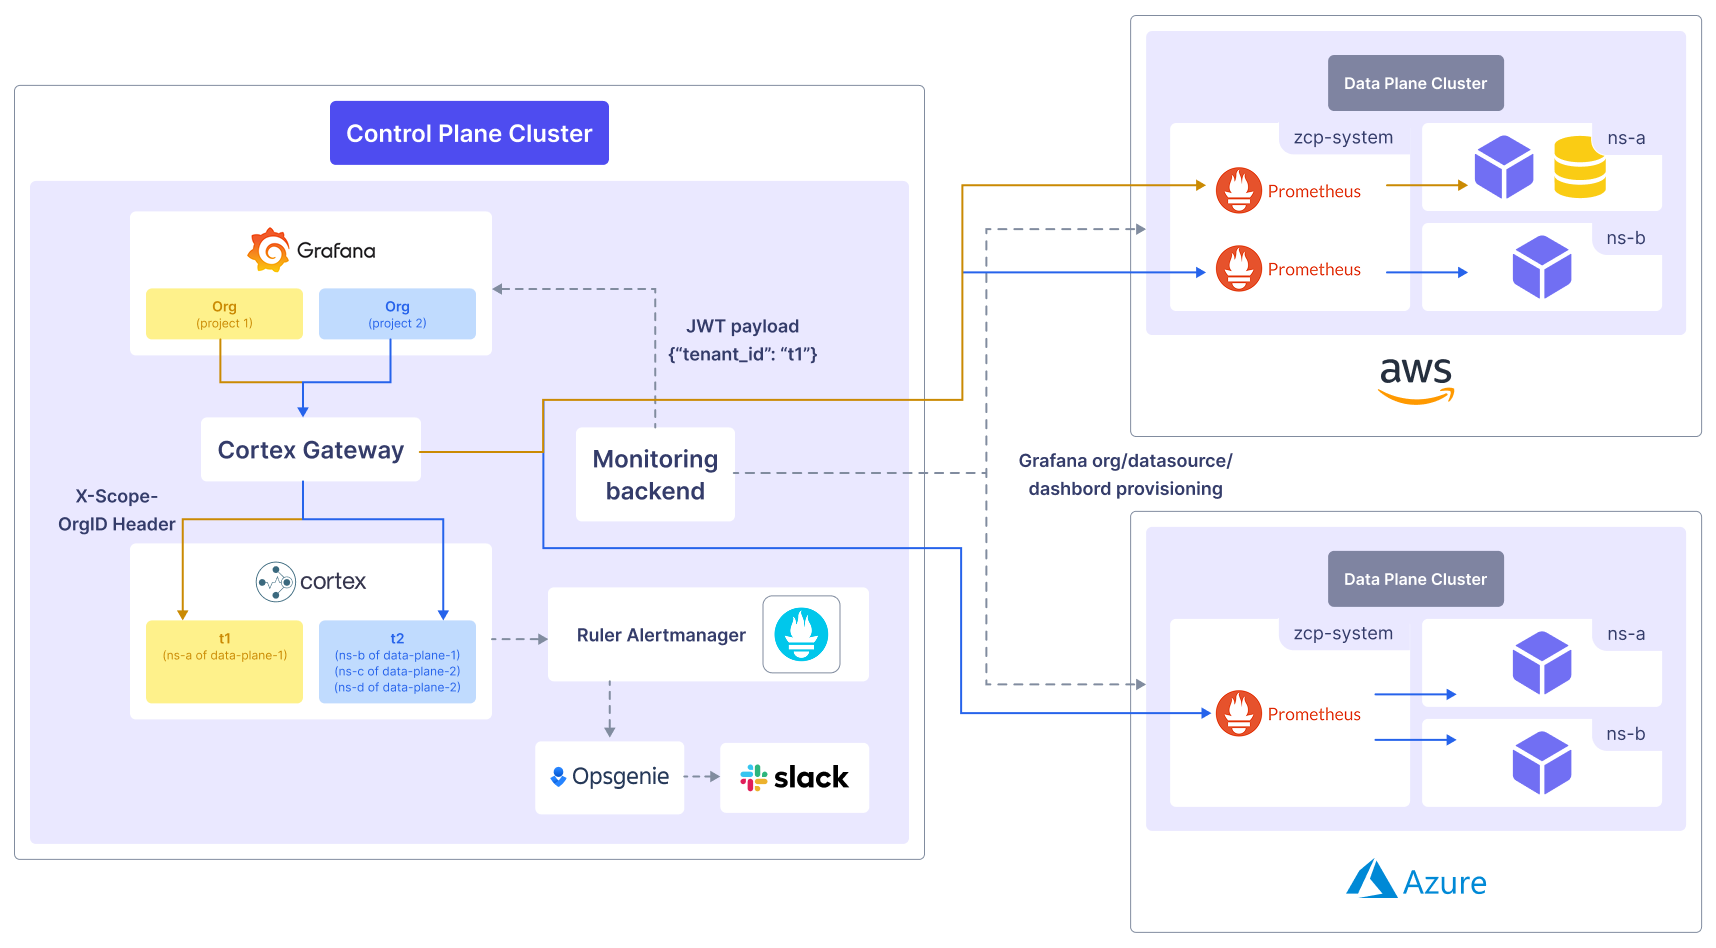
컨트롤 플레인 클러스터에서는 Cortex Gateway가 배포되어 데이터 플레인 클러스터에서 실행 중인 Prometheus 에이전트로부터 메트릭 데이터를 수신합니다. Cortex 구성 요소는 여러 클러스터에 걸쳐 메트릭 저장 및 시각화를 처리합니다. 또한, Cortex Rule and Alertmanager 구성 요소는 수집된 메트릭을 기반으로 알람 규칙을 설정하여 미리 정의된 임계값이 초과될 때 운영자에게 알림을 트리거합니다.
Prometheus 에이전트 관리, 다중 프로젝트 지원 및 Grafana 조직 및 대시보드 구성을 담당하는 Monitoring Backend Component도 컨트롤 플레인 클러스터 내에 위치합니다.
구성 요소 및 역할
제어 플레인 구성 요소
| Component | Roles |
|---|---|
| Grafana | - 수집된 메트릭을 시각화합니다. |
| Monitoring Backend | - Grafana 조직, 데이터 소스 및 대시보드를 관리합니다. - 데이터 플레인 클러스터에 Prometheus를 배포합니다. |
| Cortex Gateway | - 다중 테넌트 인증을 처리합니다. - Cortex 구성 요소에 요청을 라우팅합니다. |
| Distributor | - 수신 메트릭을 검증합니다. - 고가용성(HA)을 추적합니다. - 로드 밸런싱을 수행합니다. |
| Ingester | - 메트릭을 장기 저장소에 저장합니다. |
| Querier | - PromQL 쿼리를 실행합니다. |
| Query frontend (선택 사항) | - 읽기 성능을 향상시킵니다. - 큐잉, 분할 및 캐싱을 처리합니다. |
| Ruler (선택 사항) | - 알림 및 기록 규칙을 위한 PromQL 쿼리를 실행합니다. |
| Alertmanager (선택 사항) | - 알림을 위한 다중 테넌트 지원을 추가합니다. |
| Configs (선택 사항) | - 룰러 및 알림 관리자의 설정을 저장합니다. |
| Compactor | - 여러 블록을 단일 최적화된 블록으로 병합합니다. - 저장 비용을 줄입니다. - 쿼리 속도를 높입니다. |
| Store Gateway | - 블록 샤딩 및 복제를 처리합니다. - 쿼리 결과를 캐시합니다. |
| Index Cache | - 조회 성능을 향상시킵니다. |
| Chunks Cache | - 더 빠른 접근을 위해 검색된 데이터 청크를 저장합니다. |
| Metadata Cache | - 테넌트 목록 및 블록 매핑과 같은 메타데이터를 캐시합니다. |
데이터 플레인 구성 요소
| Component | Roles |
|---|---|
| Prometheus | - 시계열 데이터베이스 역할을 합니다. - 메트릭을 수집하고 저장합니다. - 알림을 트리거합니다. |
| Prometheus Node Exporter | - 노드 수준 시스템 메트릭을 수집합니다. |
| Kube State Metrics | - Kubernetes API 관련 메트릭을 수집합니다. |