Monitoring Architecture
Tổng Quan Kiến Trúc
ZCP thu thập các chỉ số từ nhiều cụm Data Plane bằng cách sử dụng Prometheus Agent và lưu trữ chúng một cách tập trung trong Cortex trong Cụm Control Plane. Nó cung cấp các bảng điều khiển tổng hợp tích hợp sẵn để giám sát khối lượng công việc trên toàn cụm và theo dự án thông qua Grafana, với tính linh hoạt để tùy chỉnh bảng điều khiển khi cần thiết.
Hệ thống triển khai Prometheus trên mỗi Cụm Data Plane để thu thập các chỉ số, sau đó được truyền đến kho Cortex trên Cụm Control Plane bằng cách sử dụng remote_write API.
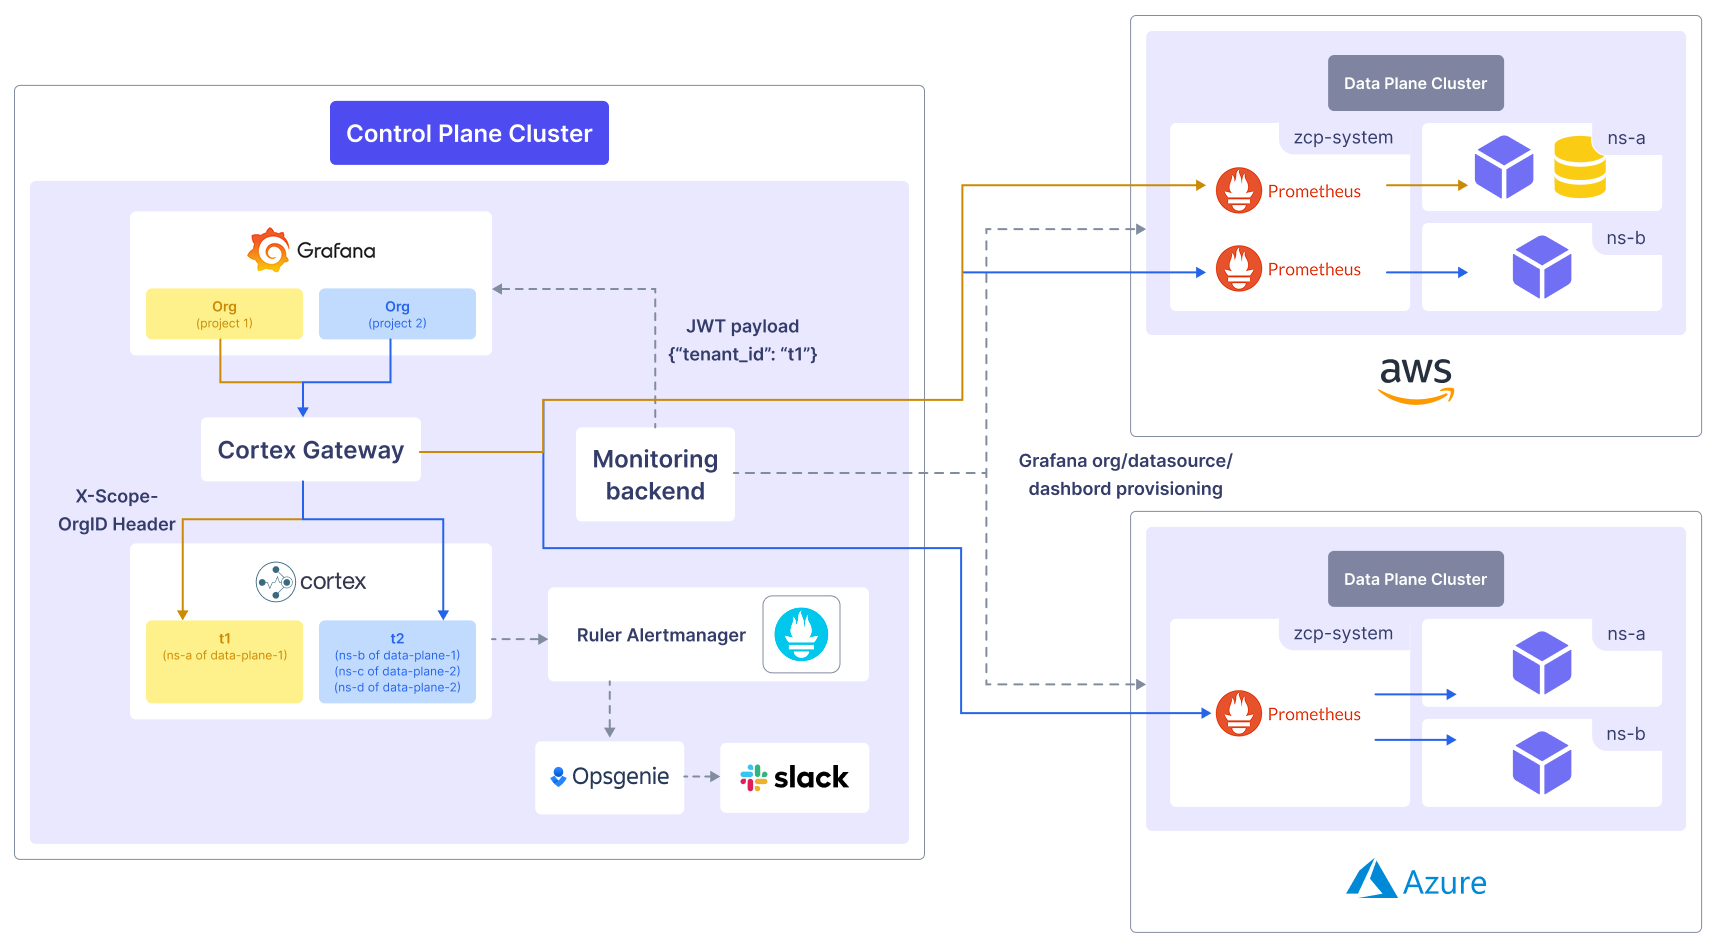
Trong Cụm Control Plane, một Cortex Gateway được triển khai để nhận dữ liệu chỉ số từ các Đại lý Prometheus đang chạy trên các Cụm Data Plane. Các thành phần Cortex xử lý việc lưu trữ và trực quan hóa các chỉ số trên nhiều cụm. Thêm vào đó, các thành phần Cortex Rule and Alertmanager cho phép các quy tắc cảnh báo dựa trên các chỉ số đã thu thập, kích hoạt thông báo cho các nhà điều hành khi các ngưỡng đã định trước bị vượt qua.
Monitoring Backend Component, chịu trách nhiệm quản lý các Đại lý Prometheus, hỗ trợ nhiều dự án và cấu hình các Tổ chức và bảng điều khiển Grafana, cũng được đặt trong Cụm Control Plane.
Các Thành Phần và Vai Trò
Các Thành Phần Của Control Plane
| Component | Roles |
|---|---|
| Grafana | - Trực quan hóa các chỉ số đã thu thập |
| Monitoring Backend | - Quản lý các tổ chức Grafana, nguồn dữ liệu và bảng điều khiển - Triển khai Prometheus trên các Cụm Data Plane |
| Cortex Gateway | - Xử lý xác thực đa người dùng - Chuyển hướng các yêu cầu đến các thành phần Cortex |
| Distributor | - Xác thực các chỉ số đến - Theo dõi tính khả dụng cao (HA) - Thực hiện cân bằng tải |
| Ingester | - Lưu trữ các chỉ số trong lưu trữ dài hạn |
| Querier | - Thực hiện các truy vấn PromQL |
| Giao diện truy vấn (Tùy chọn) | - Tăng cường hiệu suất đọc - Xử lý hàng đợi, phân tách và lưu cache |
| Ruler (Tùy chọn) | - Chạy các truy vấn PromQL cho cảnh báo và quy tắc ghi |
| Alertmanager (Tùy chọn) | - Thêm hỗ trợ đa người dùng cho cảnh báo |
| Cấu hình (Tùy chọn) | - Lưu trữ cài đặt cho Ruler và Alertmanager |
| Compactor | - Gộp nhiều khối thành một khối tối ưu hóa - Giảm chi phí lưu trữ - Tăng tốc độ truy vấn |
| Store Gateway | - Xử lý phân mảnh và sao chép khối - Lưu cache kết quả truy vấn |
| Bộ nhớ cache chỉ mục | - Cải thiện hiệu suất tìm kiếm |
| Bộ nhớ cache chunks | - Lưu trữ các khối dữ liệu đã lấy để truy cập nhanh hơn |
| Bộ nhớ cache metadata | - Lưu cache metadata, chẳng hạn như danh sách người dùng và ánh xạ khối |
Các Thành Phần Của Data Plane
| Component | Roles |
|---|---|
| Prometheus | - Hoạt động như một cơ sở dữ liệu chuỗi thời gian - Thu thập và lưu trữ các chỉ số - Kích hoạt cảnh báo |
| Prometheus Node Exporter | - Thu thập các chỉ số hệ thống cấp nút |
| Kube State Metrics | - Thu thập các chỉ số liên quan đến API Kubernetes |