Giao diện nút hiển thị tất cả các nút GPU trong cụm và cho thấy cách bố trí vật lý và trạng thái riêng lẻ của từng GPU được cài đặt trên mỗi nút một cách chi tiết. Điều này rất cần thiết để chẩn đoán các vấn đề ở cấp phần cứng và xác định sự khác biệt về hiệu suất hoặc các vấn đề nhiệt giữa các GPU trong một nút.
Truy cập Màn hình Nút
Từ Cluster List, nhấp vào thẻ cụm sẽ điều hướng đến Node View của cụm tương ứng.
Màn hình hỗ trợ two view modes (Grid View and Table View), cho phép người dùng xem và quản lý dữ liệu theo nhiều cách khác nhau.
Chế độ Bảng
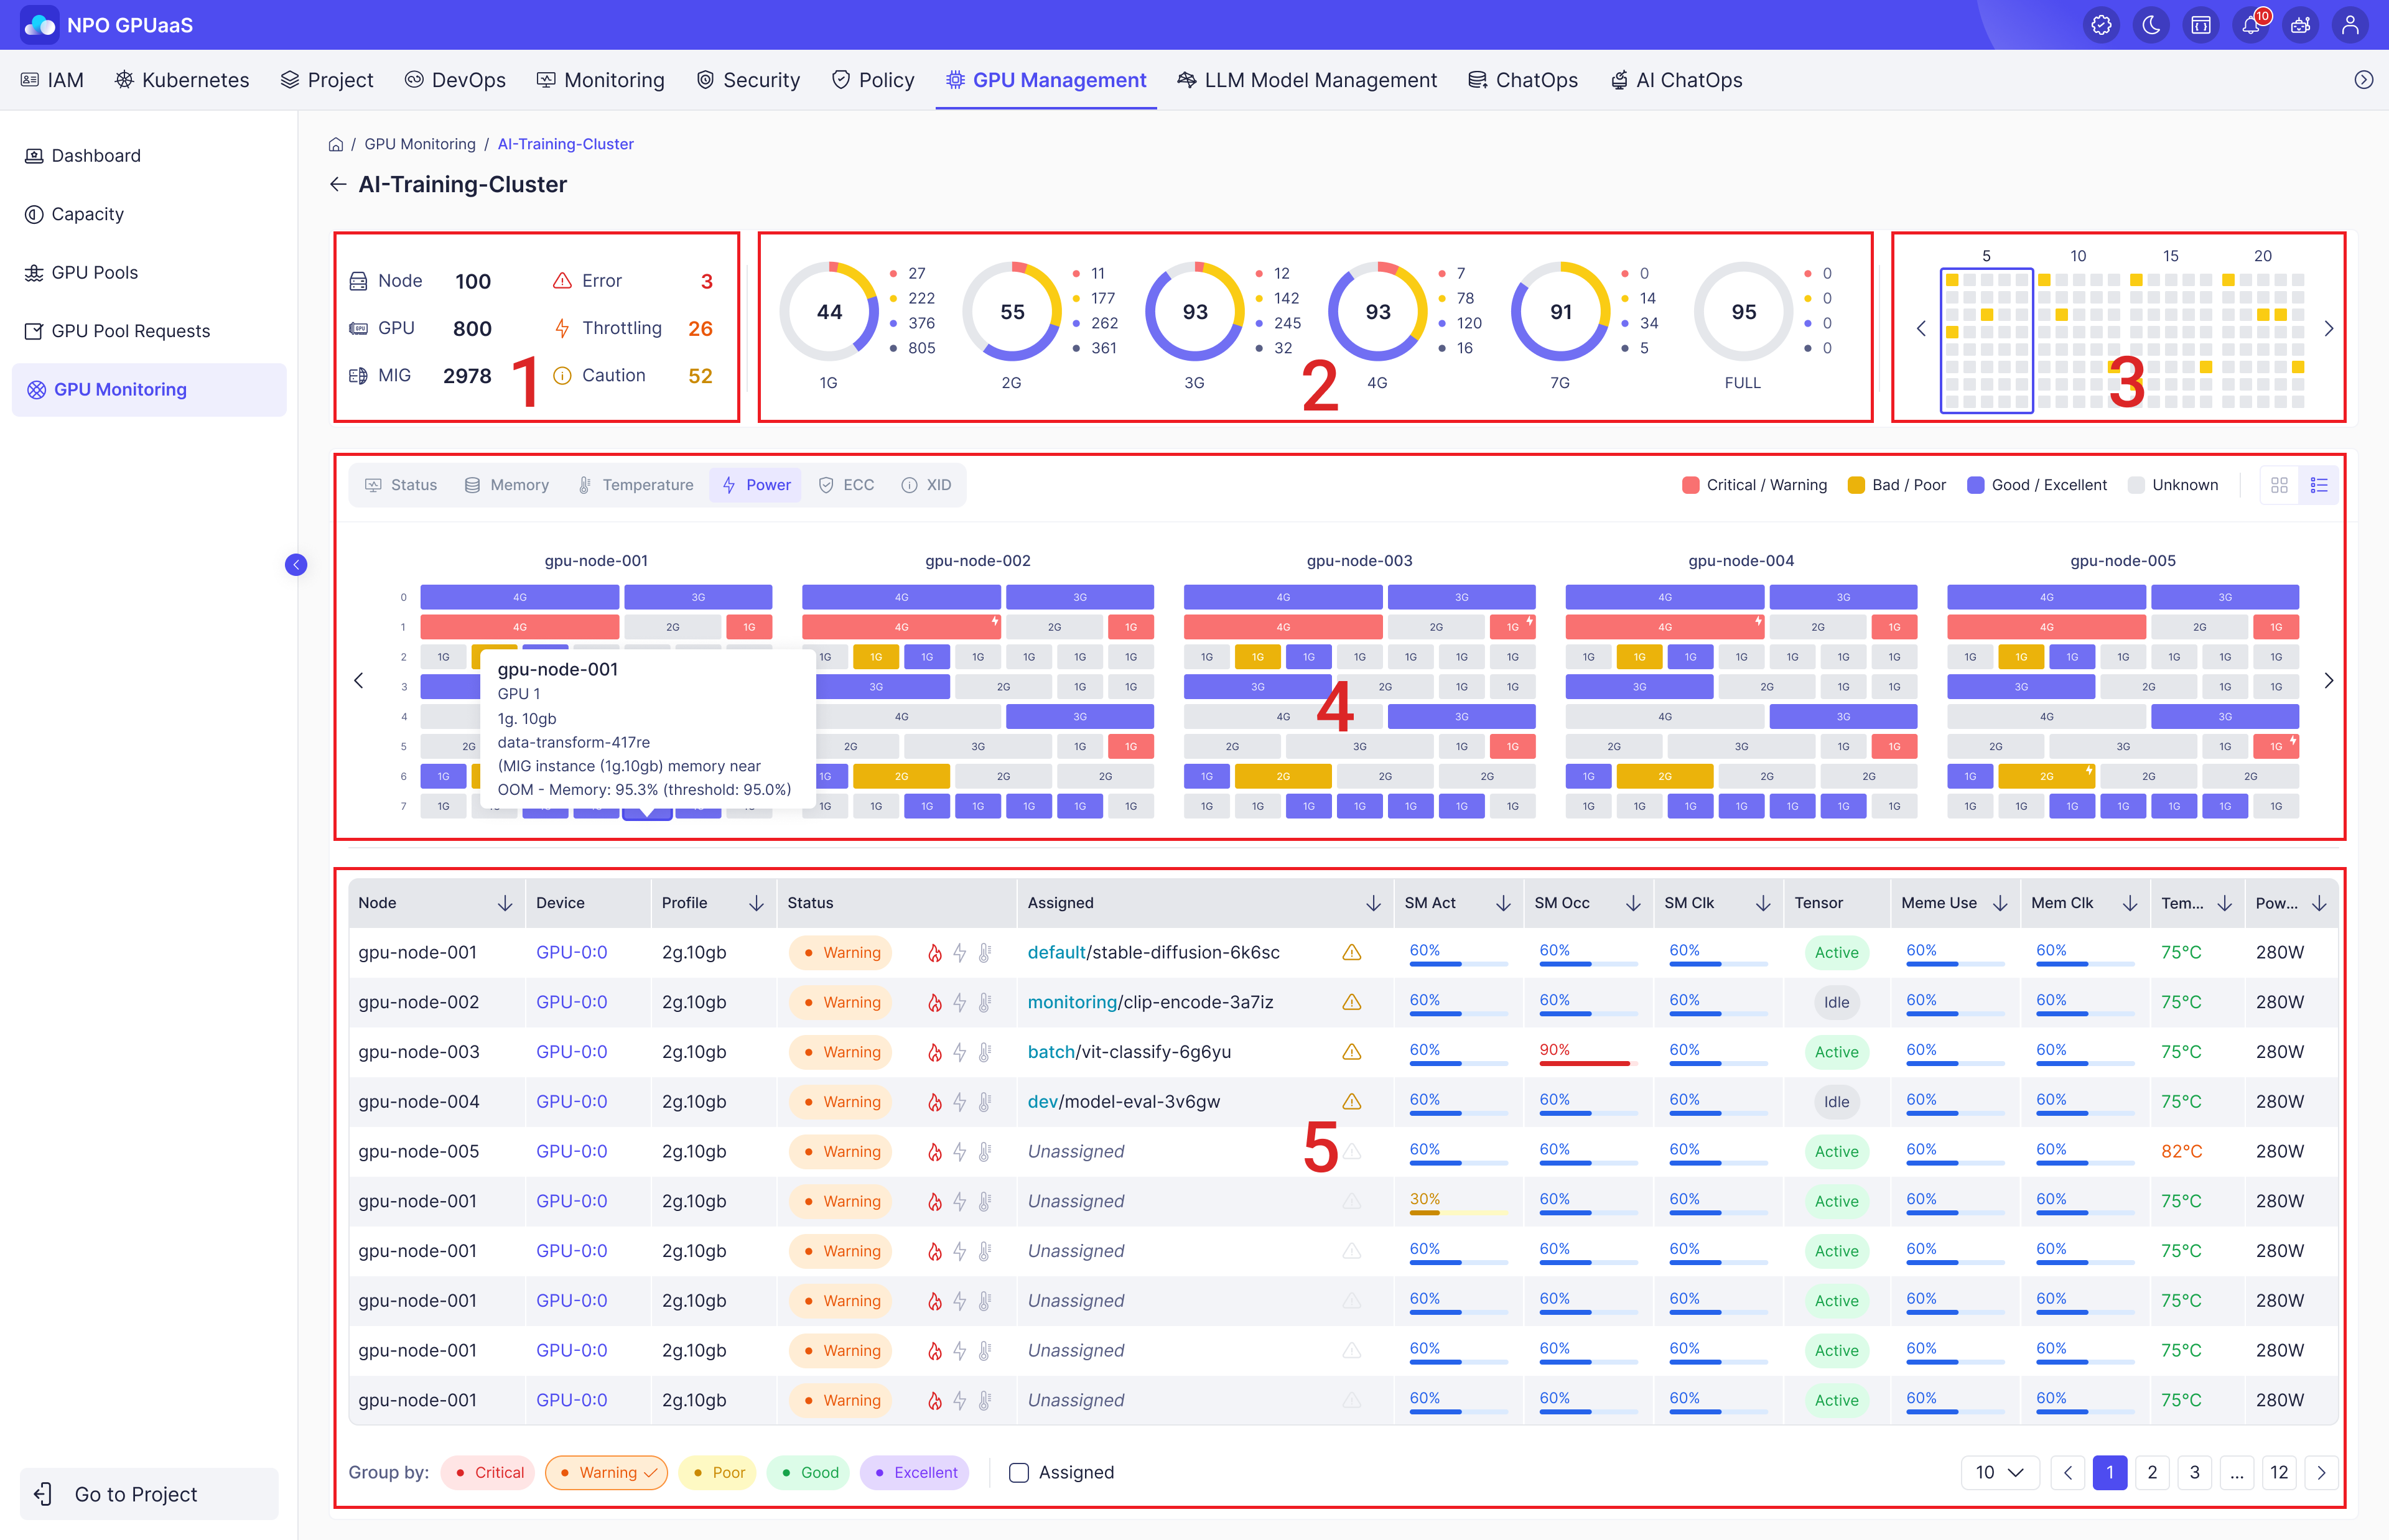
①~③ Tóm tắt Tài nguyên GPU
④ Các chỉ số GPU và MIG Instance
⑤ Thông số chi tiết của các GPU và MIG Instances
Tóm tắt Tài nguyên GPU
Tóm tắt Tài nguyên
- Mục đích: Hiển thị thống kê tổng hợp của các Nút, GPU và MIG trong hệ thống, cùng với các trạng thái tương ứng của chúng.
- Thông tin được hiển thị:
- Node: Số lượng nút trong cụm.
- GPU: Số lượng GPU trong cụm.
- MIG: Số lượng MIG instances trong cụm.
- Error/Throttling/Caution: Thống kê về số lượng lỗi, sự kiện giảm tốc và cảnh báo.
Phân phối Hồ sơ
- Mục đích: Hiển thị số lượng của mỗi thông số hồ sơ MIG và GPU đầy đủ trong cụm, được phân loại theo thông số hồ sơ và trạng thái.
- Màu sắc: Màu sắc thay đổi tùy thuộc vào chỉ số được chọn trong phần ④.
- Các danh mục thống kê: 1G, 2G, 3G, 4G, 7G, Full
- Thông tin được hiển thị:
- Giá trị Trung tâm: Tổng số lượng hồ sơ tương ứng trong cụm.
- Đánh dấu Màu: Hiển thị màu tương ứng với mỗi trạng thái cùng với số lượng hồ sơ trong trạng thái đó.
Hình Ảnh Trạng Thái Hồ Sơ
- Mục đích: Hiển thị trạng thái của mỗi GPU trong một nút để cung cấp cho quản trị viên cái nhìn tổng thể và dễ dàng theo dõi trạng thái của chúng.
- Phần này bao gồm nhiều khối, mỗi khối chứa năm cột. Mỗi cột đại diện cho một nút.
- Các ô dưới một cột đại diện cho các GPU vật lý và màu sắc của mỗi ô chỉ ra trạng thái của nó:
- Xám: Không xác định/Chưa phân bổ
- Xanh dương: Xuất sắc, Tốt
- Vàng: Kém, Tồi
- Đỏ: Cảnh báo, Nghiêm trọng
⇒ Trong chế độ GPU đầy đủ, trạng thái phản ánh trạng thái của chính phiên bản GPU.
Trong chế độ MIG, trạng thái được xác định bởi trạng thái tồi tệ nhất trong số các phiên bản MIG của GPU.
Các Chỉ Số GPU và MIG Instance
- Mục đích: Hiển thị trực quan các chỉ số GPU và MIG Instance trên mỗi Nút theo các chỉ số cụ thể. Thông qua cái nhìn này, người dùng có thể xác định có bao nhiêu GPU mỗi nút có, có bao nhiêu MIG Instances được cấu hình trên mỗi GPU, và các chỉ số tương ứng của chúng.
- Khi người dùng di chuột qua một GPU hoặc một MIG Instance, thông tin tóm tắt của nó được hiển thị:
- Node Name: Tên của nút trong cụm, được sử dụng để xác định nút nào mà GPU hoặc MIG Instance thuộc về.
- GPU Name: Tên của GPU.
- Profile Name: Tên của hồ sơ MIG.
- Status Reason: Lý do giải thích trạng thái hiện tại của hồ sơ.
- Khi nhấp vào một MIG Instance, một bảng điều khiển mở ra ở bên phải, hiển thị thông tin chi tiết về GPU hoặc MIG Instance tương ứng, bao gồm các thay đổi trong Hiệu suất và Trạng thái của chúng theo thời gian:
- Tiêu đề: Hiển thị tên Cụm, tên Nút và tên GPU theo định dạng Tên Cụm/Tên Nút/Tên GPU.
- Thông tin chung:
- Hồ sơ: Tên của hồ sơ
- Trạng thái
- Lý do trạng thái
- Tải công việc
- Xu hướng Hiệu suất:
- SM Activity: Tỷ lệ kích hoạt của các đơn vị tính toán vật lý (SMs) bên trong GPU (%)
- SM Occupancy: Tỷ lệ của các warp đang hoạt động trên một SM so với số warp tối đa được hỗ trợ, cho thấy mức độ hiệu quả mà các kernel CUDA sử dụng tài nguyên GPU (%)
- SM Clock: Tốc độ hiện tại của các SM (MHz)
- Tensor Active: Chỉ ra xem các Tensor Cores có đang hoạt động hay không.
- Memory performance:
- Sử dụng bộ nhớ: Tỷ lệ phần trăm bộ nhớ hiện đang được sử dụng (%)
- Băng thông bộ nhớ: Tốc độ đọc/ghi của bộ nhớ GPU (%)
- Status Trend:
- Nhiệt độ & Công suất
- Temperature: Nhiệt độ của GPU hoặc MIG Instance (°C)
- Power: Mức tiêu thụ điện năng (W)
- Lỗi ECC (GPU):
- ECC Volatile: Số lượng lỗi ECC không ổn định
- ECC Aggregate: Tổng số lỗi ECC đã tích lũy
- Nhiệt độ & Công suất
Thông số chi tiết của GPU và MIG Instances
- Mục đích: Hiển thị các chỉ số chi tiết của từng GPU hoặc MIG Instance.
- Thông tin được hiển thị:
- Node: Tên của nút nơi GPU hoặc MIG Instance được đặt.
- Device: ID thiết bị
- Profile: Tên của hồ sơ.
- Status: Tình trạng hiện tại của hồ sơ.
- Fire icon: Chỉ ra xem việc điều chỉnh nhiệt độ phần cứng có được bật hay tắt.
- Lightning icon: Chỉ ra xem Giới hạn Công suất GPU (giới hạn mức tiêu thụ điện năng) có được bật hay tắt.
- Thermometer icon: Chỉ ra tình trạng của Giới hạn Nhiệt độ Phần mềm
- Assigned:
- Hiển thị pod mà hồ sơ được gán, được hiển thị theo định dạng không gian tên pod (xanh)/tên pod.
- Biểu tượng bên cạnh sẽ được làm nổi bật nếu hồ sơ có lỗi ECC (bao gồm lỗi ECC không ổn định và lỗi ECC tổng hợp).
- SM Act: Hoạt động SM - Tỷ lệ kích hoạt của các đơn vị tính toán vật lý (SMs) bên trong GPU.
- SM Occ: SM Occupy - Tỷ lệ của các warp đang hoạt động trên một SM so với số warp tối đa được hỗ trợ, cho thấy mức độ hiệu quả mà các kernel CUDA sử dụng tài nguyên GPU.
- SM Clk: SM Clock - Tốc độ hiện tại của các SM so với tốc độ tối đa của chúng.
- Tensor: Chỉ ra xem các Tensor Cores có đang được sử dụng hay không.
- Mem Use: Memory Usage - Tỷ lệ phần trăm bộ nhớ GPU đã sử dụng / tổng bộ nhớ có sẵn.
- Mem Clk: Memory Clock - Xác định tốc độ truyền dữ liệu giữa lõi GPU và VRAM.
- Temp: Temperature - Nhiệt độ GPU.
- Power: Power - Mức tiêu thụ điện năng của GPU.
Filter
Cho phép người dùng lọc các Mục ④ và ⑤ với các tiêu chí khác nhau:
- Profile Status: Các giá trị bộ lọc trạng thái có sẵn phụ thuộc vào tab được chọn trong Mục ④. (ví dụ: Critical/Warning, Bad/Poor, Good/Excellent, Unknown)
- Assigned: Xác định xem profile đã được gán cho một pod hay chưa.
⇒ Người dùng có thể áp dụng bộ lọc bằng cách kết hợp trạng thái profile và điều kiện gán.
Grid View
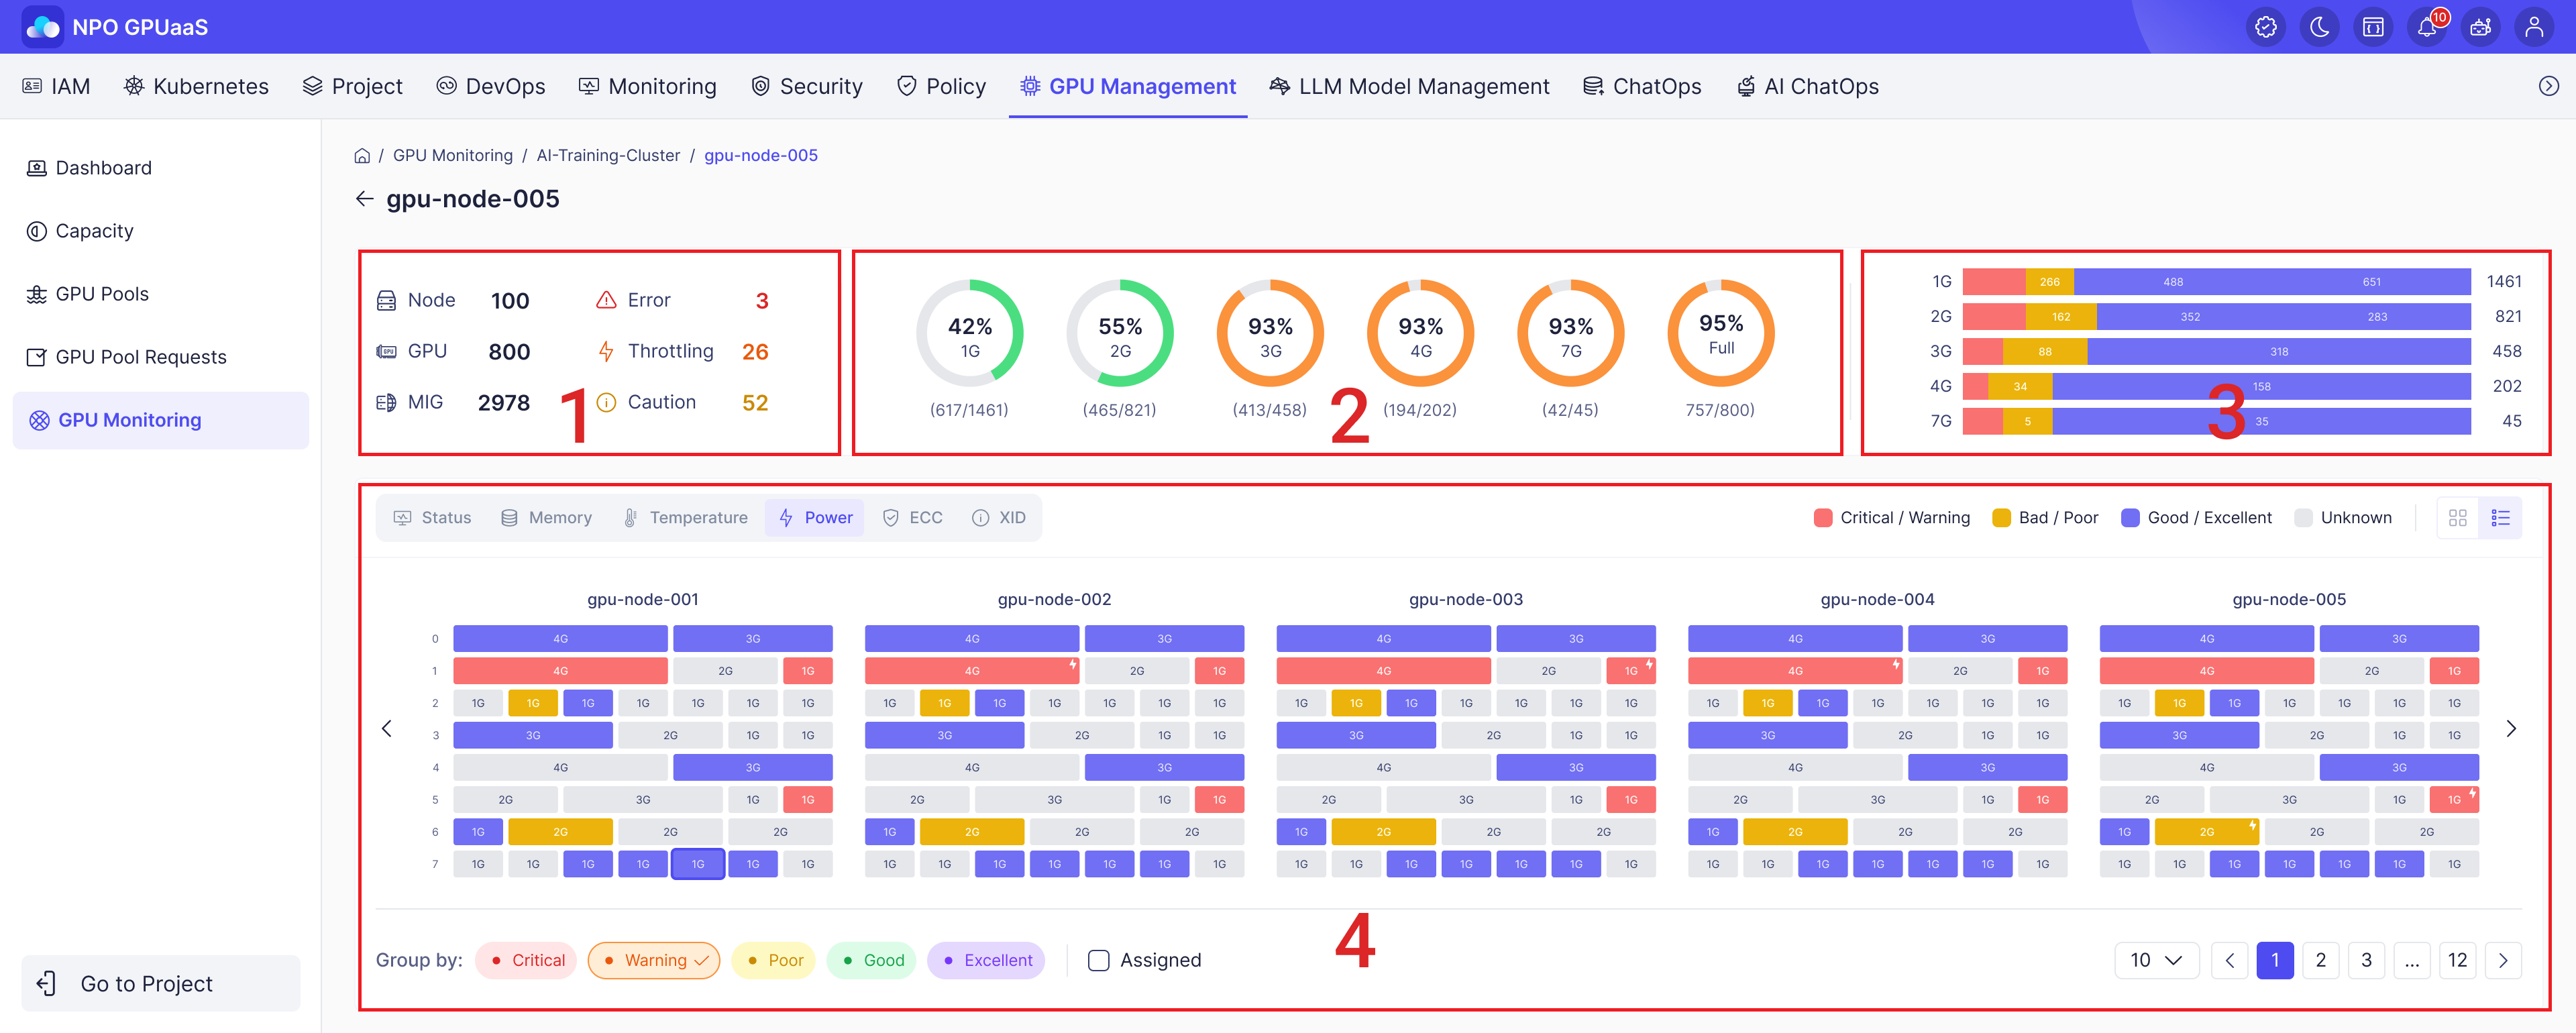
-
~ 3) Tóm tắt Tài nguyên GPU
-
Các chỉ số GPU và MIG Instance
Summary of GPU Resource
Resource Summary
Giống như Chế độ Bảng
Profile Availability
- Mục đích: Hiển thị tỷ lệ phần trăm các profile có sẵn, được phân loại theo thông số kỹ thuật profile.
- Màu sắc:
- Xanh lá: không quá 60%
- Cam: hơn 61%
- Các danh mục thống kê: 1G, 2G, 3G, 4G, 7G, Full
- Thông tin hiển thị:
- Giá trị Trung tâm: Hiển thị tỷ lệ phần trăm các profile có sẵn.
- Tỷ lệ phần trăm các profile có sẵn = (Số lượng profile có sẵn : tổng số profile) x 100%
- Giá trị Trung tâm: Hiển thị tỷ lệ phần trăm các profile có sẵn.
Profile Distribution
- Mục đích: Hiển thị số lượng của mỗi đặc tả hồ sơ MIG, được phân loại theo đặc tả hồ sơ.
- Màu sắc: Màu sắc thay đổi tùy thuộc vào chỉ số được chọn trong phần ④.
- Các danh mục thống kê: 1G, 2G, 3G, 4G, 7G, Toàn bộ
- Thông tin được hiển thị:
- Mỗi thanh hiển thị dữ liệu được chia thành các đoạn màu khác nhau, trong đó mỗi màu đại diện cho một trạng thái hồ sơ khác nhau.
- Tổng số hồ sơ được hiển thị ở bên phải mỗi thanh, cho phép quản trị viên dễ dàng quan sát tỷ lệ của mỗi trạng thái trong tổng số.
GPU và Các chỉ số phiên bản MIG
Giống như chế độ xem bảng
Bộ lọc
Cho phép người dùng lọc các phần 4 và với các tiêu chí khác nhau:
- Trạng thái hồ sơ: Các giá trị bộ lọc trạng thái có sẵn phụ thuộc vào tab được chọn trong phần 4 (ví dụ: Quan trọng/Cảnh báo, Kém/Tồi, Tốt/Tuyệt vời, Không xác định)
- Đã gán: Xác định xem hồ sơ đã được gán cho một pod hay chưa.
Cuối cùng, người dùng có thể áp dụng bộ lọc bằng cách kết hợp trạng thái hồ sơ và điều kiện gán.