Dashboard
1. Overview
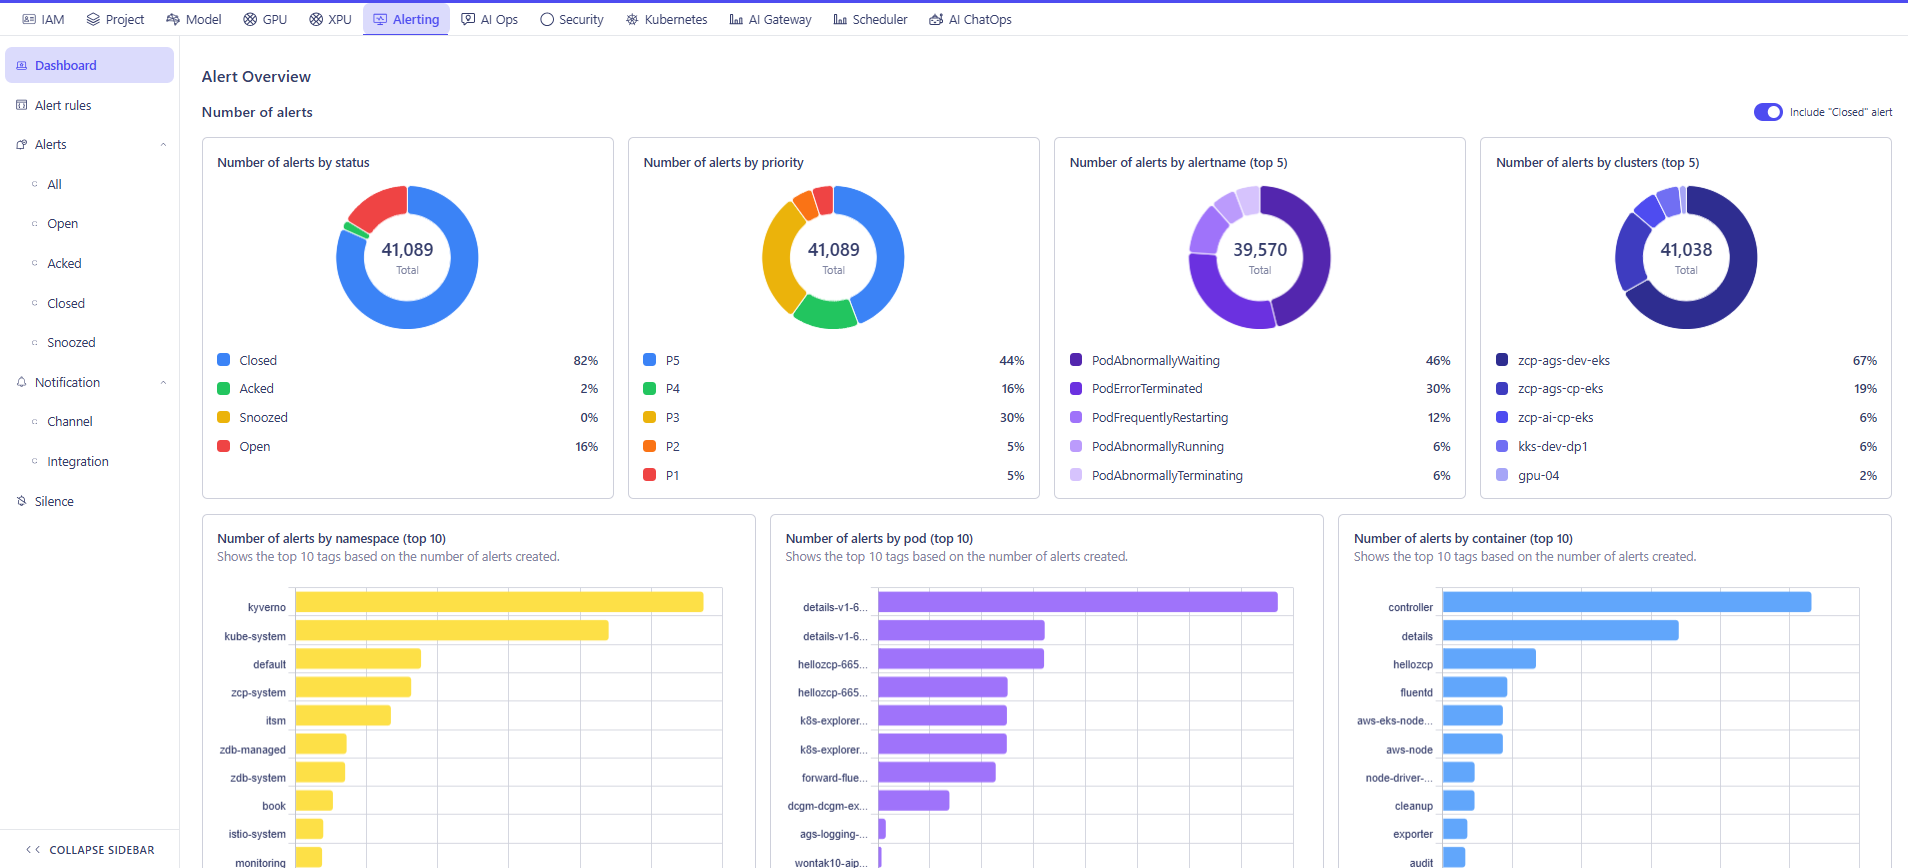
The Dashboard page is made of 2 independent sections, stacked vertically, each with its own header and its own refresh trigger:
| Section | Controls | Charts |
|---|---|---|
| 1. Number of alerts | "Include 'Closed' alert" switch only (no date range) | 7 charts: by status, by priority, by alertname (top 5), by clusters (top 5), by namespace (top 10), by pod (top 10), by container (top 10) |
| 2. MTTA/R Overview | Its own date-range picker (max 31 days) | 4 summary numbers (Created Alerts, Closed Alerts, Mean time to acknowledge, Mean time to resolve) + 3 charts (per-day by priority, daily mean time to acknowledge, daily mean time to resolve) |
2. Number of alerts
| Element | Meaning |
|---|---|
| "Include 'Closed' alert" switch | Controls whether alerts with status Closed are counted in all 7 charts below. • On (default): Closed alerts are included. • Off: Closed alerts are excluded, and all 7 charts reload to reflect only Open/Acked/Snoozed alerts. |
All 7 charts pull live numbers from the system each time the page loads or the switch is toggled — they only care about the "Include Closed alert" switch, not about any specific time period. None of these 7 charts filter by date at all — they always count across the entire history of alerts, not just a chosen date range.
2.1. Number of alerts by status
| Field | Details |
|---|---|
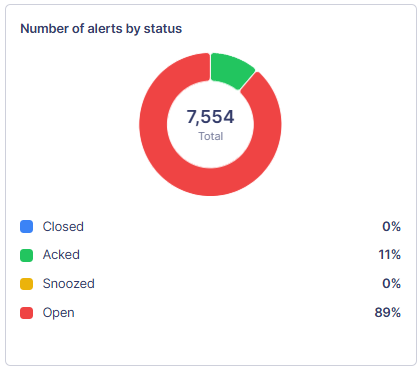
| Meaning | Total alert count split into Closed / Acked / Snoozed / Open. |
| Data source & calculation | Reads the status field stored on each alert record (values: Open, Acked, Snoozed, Closed) and counts how many alerts currently have each value, across all alerts in the system (no date filter). If "Include Closed alert" is off, alerts with status = Closed are excluded from the count before the other 3 groups are tallied. All 4 status labels are always shown, in the same fixed order, with 0 for any group that has no alerts. |
| Color legend | Closed = Blue, Acked = Green, Snoozed = Yellow, Open = Red (fixed colors, not based on the data). |
2.2. Number of alerts by priority
| Field | Details |
|---|---|
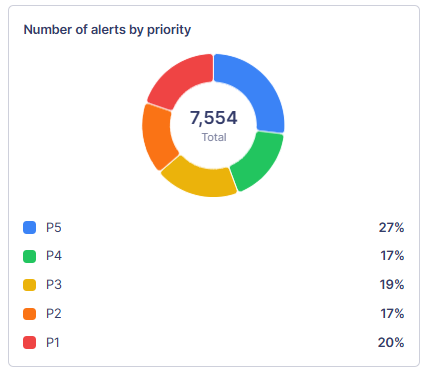
| Meaning | Total alert count split into P1–P5. |
| Data source & calculation | Reads the priority tag stored on each alert record (values: P1–P5) and counts how many alerts currently have each value, across all alerts in the system (no date filter), with the same "Include Closed alert" rule as the status chart above. All 5 priority labels are always shown, in the same fixed order (P5 to P1), with 0 for any level that has no alerts. |
| Color legend | P5 = Blue, P4 = Green, P3 = Yellow, P2 = Orange, P1 = Red (fixed colors). |
2.3. Number of alerts by alertname (top 5)
| Field | Details |
|---|---|
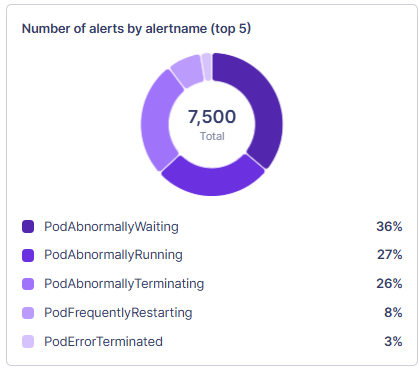
| Meaning | The alert names (rule names) that occurred the most. An "alert name" is basically the title of the rule that triggered — e.g. PodAbnormallyWaiting means "a pod has been stuck waiting to start for too long". |
| Data source & calculation | Reads the alertname tag stored on each alert record, counts how many alerts share each value, sorts the result from highest to lowest count, and keeps only the first 5 rows — a fixed limit set by the system itself, so it will never return a 6th name even if more distinct alert names exist. Covers all alerts in the system (no date filter), subject to the "Include Closed alert" switch. The 5 names are colored from darkest (most frequent) to lightest (least frequent, among the top 5). |
2.4. Number of alerts by clusters (top 5)
| Field | Details |
|---|---|
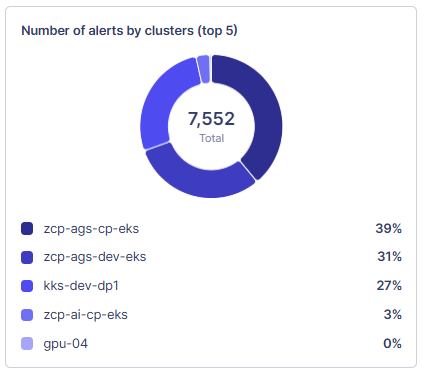
| Meaning | The clusters with the most alerts. A cluster is one whole managed environment/server group (e.g. one company project's set of machines). |
| Data source & calculation | Reads the cluster tag stored on each alert record, counts how many alerts belong to each cluster, sorts the result from highest to lowest count, and keeps only the first 5 rows (same fixed limit as the alertname chart above). Covers all alerts in the system (no date filter), subject to the "Include Closed alert" switch. The 5 clusters are colored from darkest (most alerts) to lightest (fewest, among the top 5). |
2.5. Number of alerts by namespace (top 10)
| Field | Details |
|---|---|
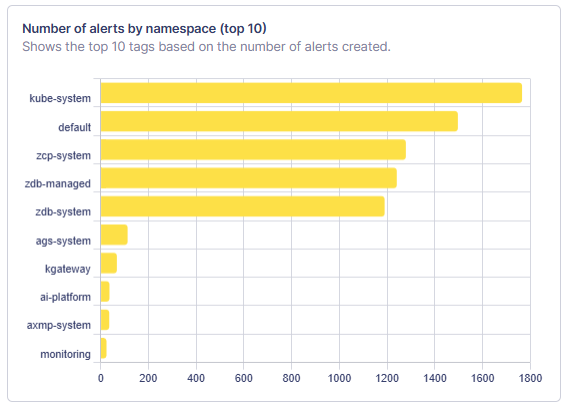
| Meaning | The top 10 namespaces with the most alerts (remember: a namespace is like a folder grouping related applications). |
| Data source & calculation | Reads the namespace tag stored on each alert record. Alerts that don't carry this tag at all (e.g. a node/hardware-level alert not tied to a specific application) are skipped — they simply don't appear in this chart, even though they're still counted in the status/priority charts above. The remaining alerts are counted per namespace value, sorted from highest to lowest count, and only the first 10 rows are kept — a real limit enforced by the system, not just a display choice. Covers all alerts in the system (no date filter), subject to the "Include Closed alert" switch. Drawn as horizontal bars, longest (highest count) at the top. |
2.6. Number of alerts by pod (top 10)
| Field | Details |
|---|---|
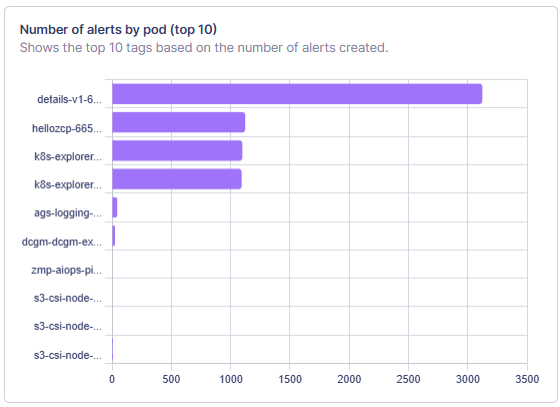
| Meaning | The top 10 pods with the most alerts (remember: a pod is one running copy of an application). |
| Data source & calculation | Reads the pod tag stored on each alert record. Alerts that don't carry this tag at all (e.g. an alert not tied to a specific running pod) are skipped — they simply don't appear in this chart. The remaining alerts are counted per pod value, sorted from highest to lowest count, and only the first 10 rows are kept — a real limit enforced by the system, not just a display choice. Covers all alerts in the system (no date filter), subject to the "Include Closed alert" switch. Drawn as horizontal bars, longest (highest count) at the top. |
2.7. Number of alerts by container (top 10)
| Field | Details |
|---|---|
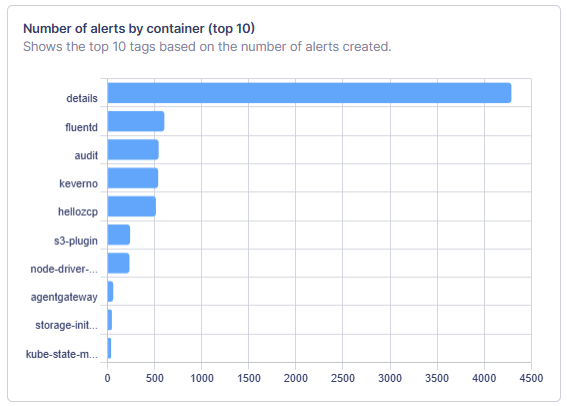
| Meaning | The top 10 containers with the most alerts (remember: a container is the actual program running inside a pod). |
| Data source & calculation | Reads the container tag stored on each alert record. Alerts that don't carry this tag at all (e.g. an alert not tied to a specific running container) are skipped — they simply don't appear in this chart. The remaining alerts are counted per container value, sorted from highest to lowest count, and only the first 10 rows are kept — a real limit enforced by the system, not just a display choice. Covers all alerts in the system (no date filter), subject to the "Include Closed alert" switch. Drawn as horizontal bars, longest (highest count) at the top. |
3. Part 2 — MTTA/R Overview
- Date range picker: Default window last 30 days from now.
- Behavior: the
< / >arrows shift the whole window backward/forward by the same 30-day span; the>arrow is disabled once the window's end date reaches today. - Limit: maximum allowed span is 31 days — picking a longer custom range shows the error "Max Period is 1 Month." and the charts are not refreshed until the range is valid.
3.1. Summary cards — Created Alerts / Closed Alerts / Mean time to acknowledge / Mean time to resolve

Meaning: 4 headline numbers for the selected date range.
| Number | Data source & calculation |
|---|---|
| Created Alerts | Reads the created_at timestamp on each alert record and counts how many fall between the selected start date and end date (inclusive). |
| Closed Alerts | Reads both created_at and closed_at; counts only the alerts where both timestamps fall inside the selected range. An alert created before the range but closed during it is not counted, because its created_at falls outside the range. |
| Mean time to acknowledge | Reads created_at and acknowledged_at; for every alert whose created_at falls inside the selected range and whose acknowledged_at is not empty, computes (acknowledged_at − created_at) in minutes, then averages that value across all matching alerts. Alerts with no acknowledged_at are left out of the average. Shows "-" if no alert matches. |
| Mean time to resolve | Reads created_at, closed_at, and status; for every alert whose created_at falls inside the selected range, whose status is currently Closed, and whose closed_at is not empty, computes (closed_at − created_at) in minutes, then averages that value across all matching alerts. Shows "-" if no alert matches. |
All 4 numbers use comma separators for readability (e.g. 1,788), and the two time values are shown as minutes and seconds (e.g. 12m 34s), with the underlying number cut off — not rounded — at 2 decimal places of a minute.
3.2. Number of alerts per day by priority
| Field | Details |
|---|---|
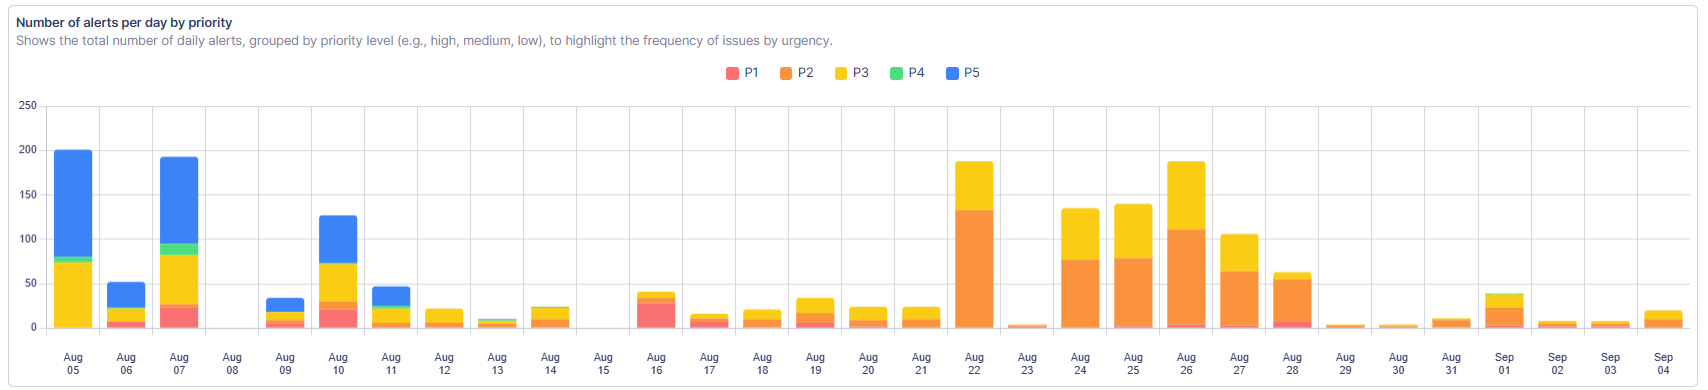
| Meaning | "Shows the total number of daily alerts, grouped by priority level (e.g., high, medium, low), to highlight the frequency of issues by urgency." Shown as one bar per day, split into colored slices for each priority level (P1–P5), stacked on top of each other. |
| Data source & calculation | Reads the created_at timestamp (to determine which day) and the priority tag (to determine which slice) on each alert record. For every day within the selected range, counts how many alerts have a created_at on that day, split by priority level. A day with zero alerts at a priority shows 0 for that slice; a day with no alerts at all still appears as an empty bar. |
3.3. Daily mean time to acknowledge
| Field | Details |
|---|---|
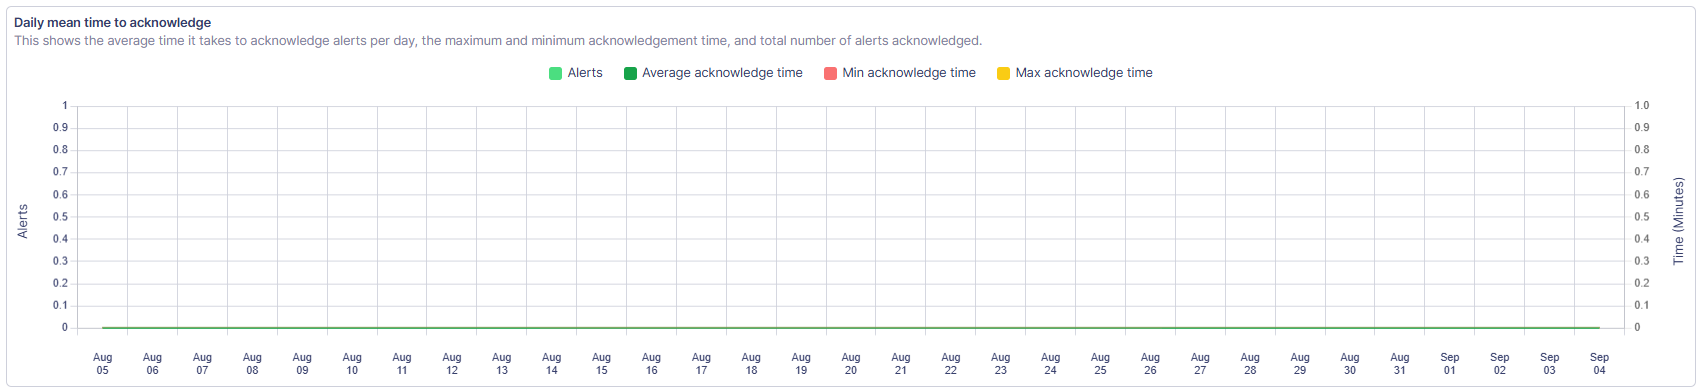
| Meaning | "This shows the average time it takes to acknowledge alerts per day, the maximum and minimum acknowledgement time, and total number of alerts acknowledged." |
| Data source & calculation | Reads created_at and acknowledged_at on each alert record. Only alerts whose created_at falls inside the selected range and whose acknowledged_at is not empty are considered. Each one is bucketed by the calendar day of its acknowledged_at (not created_at). For each such day: counts how many alerts were acknowledged, and computes the average, minimum, and maximum of (acknowledged_at − created_at) in minutes among that day's alerts. A day with no acknowledgements shows 0 across all 4 numbers. Plotted as daily count bars (left axis, "Alerts") plus average/min/max lines (right axis, "Time (Minutes)"). |
3.4. Daily mean time to resolve
| Field | Details |
|---|---|
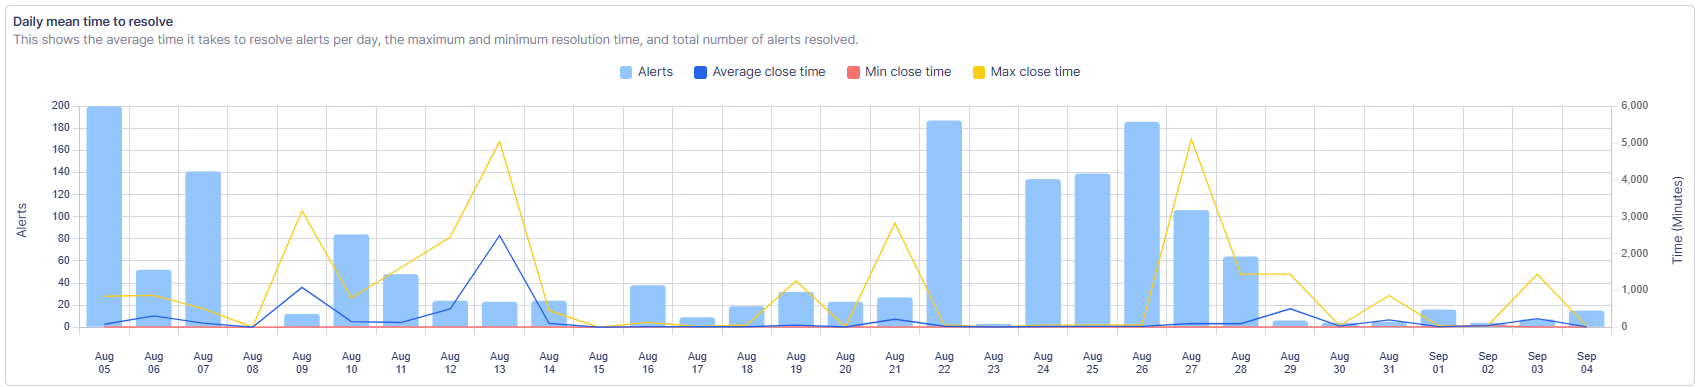
| Meaning | "This shows the average time it takes to resolve alerts per day, the maximum and minimum resolution time, and total number of alerts resolved." |
| Data source & calculation | Same as 3.3, but reads created_at, closed_at, and status. Only alerts whose created_at falls inside the selected range, whose status is currently Closed, and whose closed_at is not empty are considered. Each one is bucketed by the calendar day of its closed_at (not created_at). For each such day: counts how many alerts were closed, and computes the average, minimum, and maximum of (closed_at − created_at) in minutes among that day's alerts. Plotted as daily count bars (left axis, "Alerts") plus average/min/max lines (right axis, "Time (Minutes)"). |