Application Log Query
Cloud ZCP は、ログツールとして OpenSearch Stack をサポートしています。保存されたログデータには、Logging メニューをクリックすることでアクセスできます。
OpenSearch Dashboards へのアクセス
ZCP コンソール内の Logging メニューを通じて OpenSearch Dashboards にアクセスできます。
システム管理者にとって、Logging メニューは完全なアクセスを提供します。この完全なアクセスは、以前の会話に基づいて、マルチクラスターのログデータアクセス、ロール、ユーザー、権限、およびテナントを管理するための「セキュリティ」など、OpenSearch Dashboards 内のメニューへの権利を含む可能性がありますが、この特定のメニューアクセスは提供された OpenSearch Dashboards の抜粋には明示的に詳細が記載されていません。
プロジェクトユーザーにとって、OpenSearch Dashboards メニュー(Discover、Dashboard、Visualize など)へのアクセスは、彼らのプロジェクトロール(Admin/Editor/Viewer)によって決まります。
テナントの変更
ログをクエリする前に、テナントを変更する必要があります
OpenSearch Dashboards では、テナントは ZCP ウェブコンソールで作成されたプロジェクトユニットによって分類されます。
利用可能なテナントタイプには以下が含まれます:
- Global: すべてのユーザーがアクセスできる公開テナント
- Private: ログインしているユーザーのみがアクセスできるテナント
- Choose from custom: ログインアカウントがアクセスできるカスタムテナントを選択できる(アカウントがアクセスできるプロジェクト)
テナントを変更するには、以下の手順に従ってください:
-
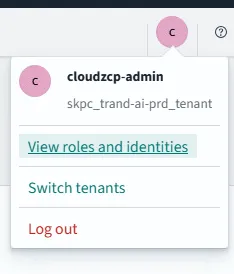
OpenSearch Dashboards の右上隅にあるアイコンをクリックして、ログインアカウントの情報と関連メニューを表示します。
-
これらのメニューから、テナントを変更するために Switch tenants メニューを選択します。
-
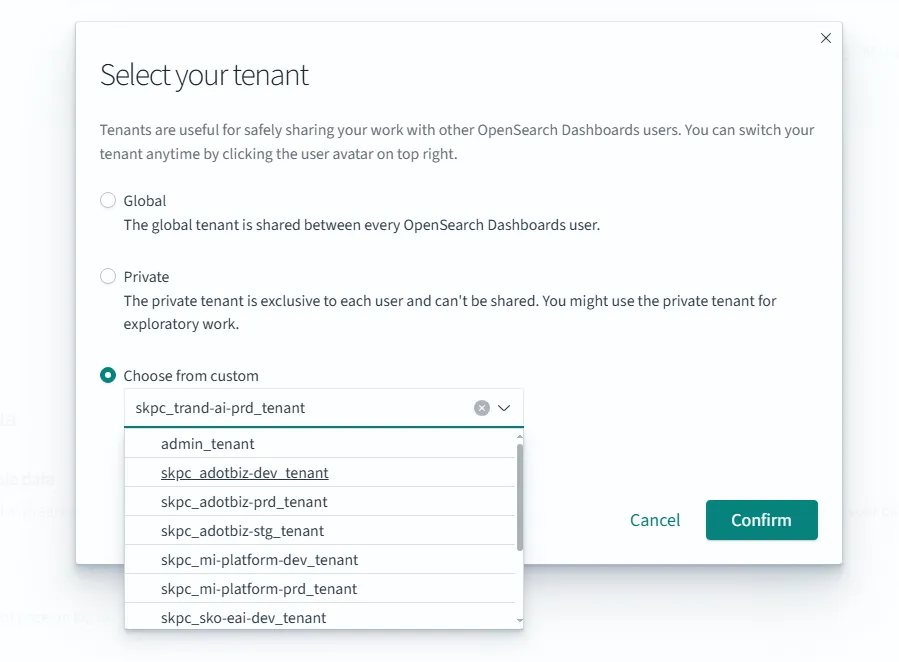
ポップアップウィンドウで、利用可能なテナントタイプから Choose from custom を選択します:
-
ドロップダウンリストからクエリログを表示したいプロジェクトを選択します。
-
Confirm をクリックしてテナントを変更します。
テナントを正常に変更した後、選択したプロジェクトに関連するログインデックスとデータにアクセスできるようになります。
Discover
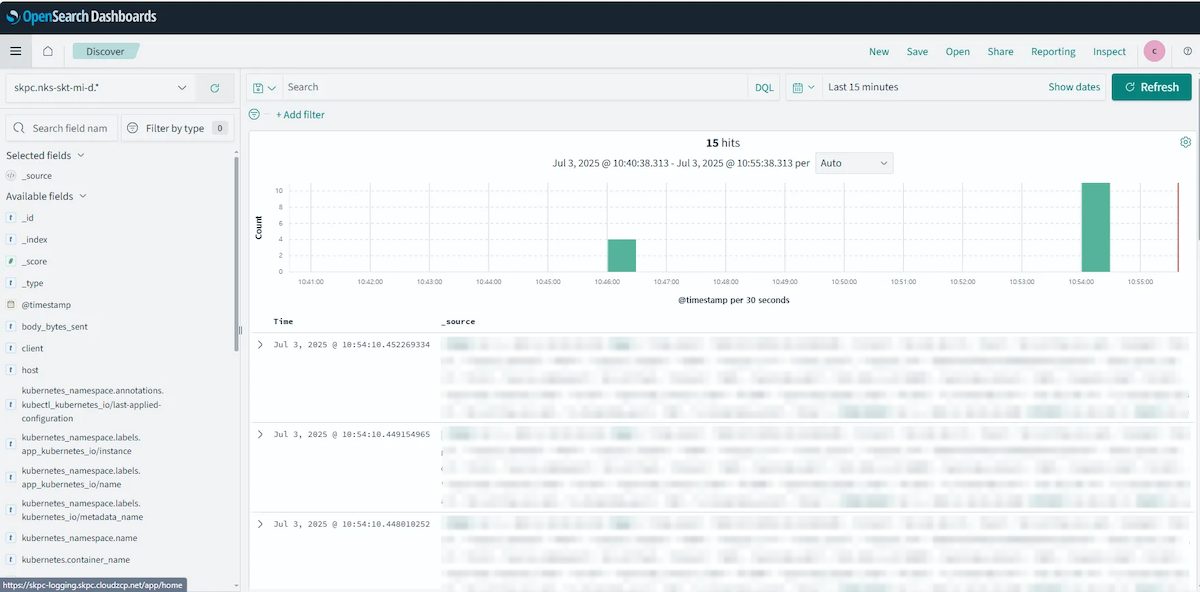
この画面では、ログをクエリすることができます。前のステップでデプロイされたアプリケーションのログを確認できます. (参考:Discover Guide)
ログストレージインデックスはプロジェクトごとに作成されます。
- Search: 指定された時間範囲内でログをフィルタリングするための検索語を入力します。
- 特定の単語(例:error)や特定の key-value ペアを含むログを検索できます。
- Filter: Available fields で利用可能なフィールドに基づいてデータをフィルタリングして表示します。
- ログをクエリするための時間範囲を指定できます。
- 右側のサマリーパネルにフィールドを追加するには、左側の Available fields で目的のフィールドにカーソルを合わせ、"Add" ボタンをクリックします。
インデックスポリシー
Index Policies は、OpenSearch Dashboards 内のインデックスの論理管理に使用されます。これにより、インデックスを管理するポリシーを作成、変更、削除でき、これらのポリシーは OpenSearch Dashboards 内で検索するための基準を形成するターゲットインデックスを指定します。
システム管理者は、インデックス管理とスタック管理に対して完全な制御を持ち、インデックスパターンやポリシーを管理する能力を含みます。
プロジェクトユーザーは通常、インデックスパターンを作成する権限を持っていません。システム管理者はインデックスパターンを作成するための必要な完全な制御を持っています。
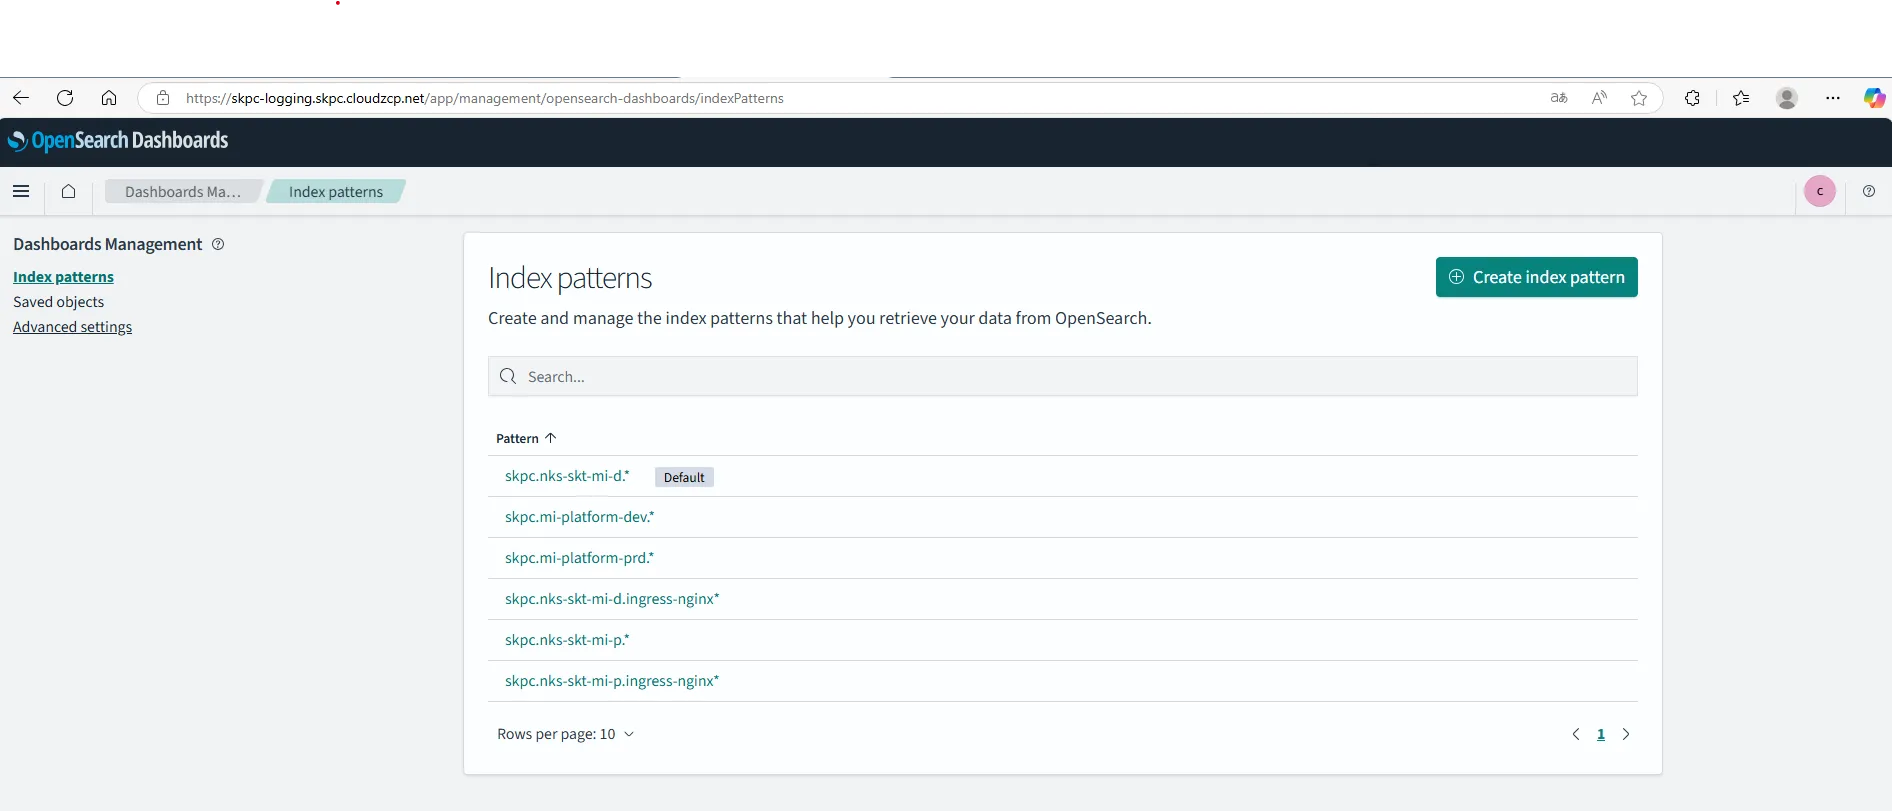
インデックスパターンは、クエリのためのログの範囲を定義するインデックスポリシーの重要なコンポーネントです。インデックスパターンを作成するには:
- Create index pattern ボタンをクリックします:
-
含めたいインデックスをパターン化します
-
検索しているログを表示するための基準となる時間を設定します
-
Create index pattern ボタンをクリックして作成を完了します。
インデックスパターンを作成した後、マッチするインデックスのマッピングを表示できるようになります。テーブルにはフィールドのリストが表示され、それぞれのデータ型とプロパティが示されます。以下の画像はその例を提供します。(参考:Index Patterns)